
6.4 Quantitative Evaluation
As mentioned above, the ground-truth data can be obtained from man-made visual patterns, human labelling and eye-tracking. Using these data one can evaluate the performance of a visual attention model in two ways: qualitative evaluation and quantitative evaluation. Qualitative evaluation involves the comparison of the computed saliency maps with the ground-truth data by visual inspection. However, this is a rather crude method and cannot be used in real-time scenarios. Moreover, it may give less consistent results since it is based on manual inspection. In order to overcome these limitations, quantitative evaluation can be used for a more accurate comparison of visual attention models. To that end, three commonly used criteria are used: one is related to classification such as precision estimation or F-measure, the receiver operating characteristic curve (ROC curve) or area under the ROC curve (AUC) score and so on. The second one is based on Bayesian surprise (discussed in Section 3.8) and is called the KL score, and the final estimated method is Spearman's rank order correlation that is to be introduced in Section 6.6. This section mainly introduces the estimation related to classification.
First, the ground-truth data are converted into binary saliency maps: a value of 1 indicates fixation locations and 0 indicates non-fixation locations. Man-made visual patterns and human-labelling data are easy to derive the binary format (as Figure 6.1(a) and Figure 6.2(b)). The third one, that is a fixation density map from eye-tracking (like Figure 6.3(b)), can be converted into binary format by either using a threshold or directly considering the raw fixation map before the Gaussian dropoff effect (i.e., set fixation point as 1 and non-fixation point as 0).
Like the ground-truth data, the saliency map from a computational visual attention model – Figure 6.1(b), Figure 6.2(c) and Figure 6.3(c) – must also be converted into binary form by using a selected threshold. Since both ground-truth and tested salient data are binary, the evaluation becomes a two-class classification (or prediction) problem. We will discuss the methods that have been used for quantitative evaluation in the following subsections.
6.4.1 Some Basic Measures
For two-class classification, the outcome of the classifier is either positive or negative. There are four categories for classification with the comparison of ground-truth data: a true positive (TP) if the outcome from the classification is positive and the ground-truth value is also positive; a false positive (FP) if the outcome from the classification is positive while the ground-truth value is negative; a true negative (TN) if both the classification outcome and the ground-truth value are negative; and a false negative (FN) if the classification outcome is negative while the ground-truth value is positive.
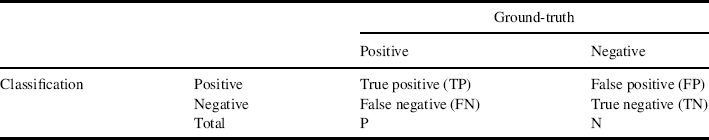
Assume that there are P positive instances and N negative instances in the ground-truth, and TP, FP, TN and FN are used to represent the numbers of instances for the four aforementioned categories, respectively. These are listed in Table 6.1.
Table 6.1 Four possibilities for two-class classification.
The basic measures can be defined as follows [17]. The true positive rate (TPR) (also called hit rate, sensitivity or recall) is defined as
The false positive rate (FPR) (also called fall-out) is defined as
The above indexes can be computed from the binarized ground-truth map and the saliency map (obtained from the computational model to be tested). The percentage of target points in the ground-truth falling into the salient points of a visual attention map is known as TPR (or recall), while the percentage of background points falling into the salient points is called FPR (or fall-out). Clearly, a higher TPR and lower FPR imply better performance of the corresponding visual attention model. It may be noted that the binary saliency map is obtained via thresholding, that is when the pixel value on the saliency map is greater than the threshold, the pixel is set a salient point, otherwise it is set a non-salient point. It follows that for different values of the threshold, the TPR and FPR will be different. When the threshold of the saliency map changes from zero to a large value, for a given image we can draw a curve of TPR vs. FPR, the receiver operating characteristic (ROC) curve. The shape of the ROC curve can more objectively estimate the performance of attention models, as will be discussed below.
Another index for measuring the performance is the accuracy (ACC), which is calculated as
(6.3) ![]()
High ACC means high recognition rate for the classifier. Other indexes for determining the performance of a two-class classifier include the true negative rate (TNR) (also called specificity) and the positive predictive value (PPV) (also called precision). These are defined as
(6.4) ![]()
(6.5) ![]()
The PPV and TPR are two measures for the positive case, which are used to analyse the performance of different computation models. The curves of the precision (PPV) and recall (TPR) have also been used in recent literature [10, 18, 19]. Sometimes, the use of the two indexes is not convenient to estimate the performance of a classifier. Consider that the simple arithmetical mean maybe cannot modulate the effect of each one. An addition measurement, F-measure is defined to balance precision and recall, as follows:
(6.6) ![]()
where η is a positive parameter to decide the relative importance of precision over recall. A greater value for η indicates the higher importance of recall over precision.
Precision (PPV) and Fη are often used to evaluate the performance of the tested saliency map [19]. They are all smaller than or equal to 1, and a higher value indicates a better alignment between the output of a visual attention model and the ground-truth (from human-labelling or eye-tracking). These values are averaged for all the images in a database to obtain the overall measure.
6.4.2 ROC Curve and AUC Score
As already mentioned, the ROC curve is a graphical plot of the TPR versus FPR for a binary classifier system as its discrimination threshold varies [17]. The TPR determines a classifier's performance in classifying positive instances correctly among all positive samples available during the classification. The FPR, on the other hand, defines how many incorrect positive results occur among all negative samples available. An ROC space is then defined with FPR and TPR as the x and y coordinates respectively. Each prediction result, or one instance, represents one point in the ROC space. The perfect classification would yield a point in the upper left corner or coordinate (0, 1) of the ROC space, indicating 100% sensitivity (no false negatives) and 100% specificity (no false positives).
The ROC curve can be used to compare and evaluate the performance of the computational visual attention models in the following manner. Suppose that the binary ground-truth image and the saliency map obtained from a computational attention model or an algorithm are available. Usually, the values in a generated saliency map are from 0 to 255 (or normalized as 0 to 1). Through a threshold, the saliency map can be divided into the salient points (the salient values at the points are larger than or equal to the threshold) and non-salient points (the salient values at the points are smaller than the threshold). These salient points are regarded as the salient regions, while other non-salient points are regarded as the non-salient regions. By varying the threshold between 0 and 1 (assuming a normalized saliency map), we can obtain the TPR and FPR values using Equations 6.1 and 6.2. There are two extreme cases of thresholding. First, when the threshold equals 1, no salient point exists in the saliency map. Therefore, no target points and background points in the ground-truth fall into the salient regions of the saliency map (this means that both TPR and FPR values are 0). On the other hand, when the threshold equals 0, all regions on the saliency map are salient regions (i.e., TPR = FPR = 1). In a random classification case, TPR and FPR in several tests maybe have almost the same percentage (about 50% probability) for any threshold, and this corresponds to a diagonal line from the left bottom to top right corners as shown in Figure 6.4. This represents a completely random guess. In the general classification case, when the threshold varies between 0 and 1, the TPR value is greater than the FPR value. In this manner, we can draw a convex curve on the ROC space as shown in Figure 6.4. The points on the ROC curve at threshold values 1 and 0 are respectively the starting and ending points. The diagonal line from the left bottom to top right corners is the no-discrimination line.
Figure 6.4 The ROC curve
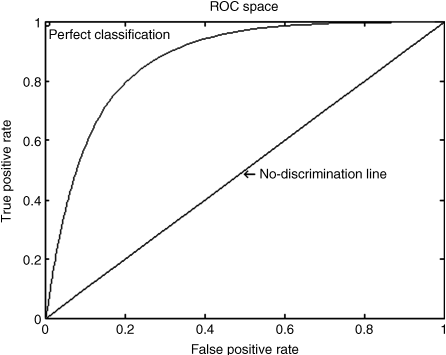
The area under the mean ROC curve (AUC score for short) can be used to evaluate the overall performance of saliency map of the computational model. This is done by using the average of the ROC curves of all the images in a large size database and over several subjects testing results. In the case of random guess the ROC curve over a large number of trials will be a no-discrimination line (i.e., no decision line) with AUC being 50%. In the general case, the AUC value is greater than 50%. A larger AUC score will imply a better predication performance of an attentional computation model (or an algorithm), and thus it can be used for quantitative evaluation. In this way, to compare different models or algorithms, the AUC score is often adopted. In the perfect case, when the ROC curve is along the y-axis to the point (0,1), and then along the x-axis to the point (1,1), we have AUC = 100%. However, this is the ideal case and cannot be achieved in practice. AUC scores are widely employed to compare different computational models mentioned in Chapters 03–05.
6.4.3 Inter-subject ROC Area
As analysed in Section 6.3, the ground-truth data obtained from tracking of the eye fixations of observers can factually reflect the salient regions of human perception in many complex natural images. So many computational models use eye-tracking data to measure the AUC score. For the sake of fairness, each ground-truth image is a fixation density map on average by recording several subjects' fixation points. In general, visual attention of the human subject is driven by both bottom-up and top-down mechanisms. So the fixation points of different human subjects for the same natural image may not be the same due to their diverse prior knowledge. Considering the rationality of these ground-truth data with subjects' discrepancy, a mean inter-subject ROC area as the benchmark are adopted [2, 4, 20, 21]. For each image, the inter-subject ROC area is calculated as follows. Suppose that all subjects view the same image. For every subject, the ‘human saliency map’ of a special image is derived from the fixations of all other subjects by convolving these fixations with a 2D Gaussian kernel. The inter-subject ROC area for a single subject is measured by comparing the subject fixations to the human saliency map. Then the mean inter-subject ROC area of the image is averaged across all subjects. It is worth noting that the mean inter-subject ROC area for different testing image is different. Consider the mean inter-subject ROC values of all images in a testing database and put them on x-axis of Figure 6.5 with a range (e.g., 0.55–0.80 in the figure). The y-axis of Figure 6.5 is the score of mean ROC area of the computational model.
Figure 6.5 Mean ROC metric for each range of inter-subject ROC values
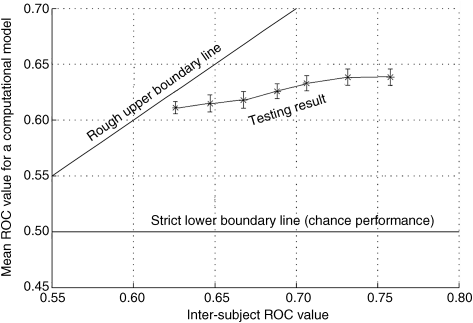
For any computational model, the ROC area is computed using the resultant saliency map together with the fixations from all subjects as detected points, across all viewing images. The mean ROC curve composed of symbols ‘*’ for a computational model is shown in Figure 6.5. In this figure the short bar denotes the variance in the measurement. The line indicated as ‘Rough upper boundary line’ denotes the ideal performance since the mean ROC value of resulting saliency map is exactly equal to the inter-subject ROC value. The line indicated as ‘Strict lower boundary line’ denotes the chance performance. Whatever inter-subject ROC values are, the ROC area of the chance performance always equals 50%. It is clear that a computed saliency map with the mean ROC curve near the upper boundary line has better performance.
The mean area under the ROC curve (the AUC score) and the mean ROC area considering inter-subject the ROC value are commonly used to compare the performance of different computational models in the same ground-truth data.