
Chapter IIC-1
The Photovoltaic Market
Chapter Outline
1. Asia and the Pacific Region
1.4. People’s Republic of China
2.2.9. Other European Countries and Turkey
In 2010, the worldwide photovoltaic market more than doubled, driven by major increases in Europe. For 2010 the market volume of newly installed solar photovoltaic electricity systems varies between 17 GW and 19 GW, depending on the reporting consultancies (Figure 1). This represents mostly the grid-connected photovoltaic market. To what extent the off-grid and consumer product markets are included is not clear, but it is believed that a substantial part of these markets are not accounted for, as it is very difficult to track them. A conservative estimate is that they account for approx. 400 to 800 MW (approx. 1–200 MW off-grid rural, approx. 1–200 MW communication/signals, approx. 100 MW off-grid commercial and approx. 1–200 MW consumer products).
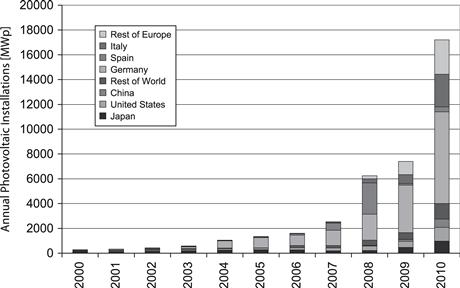
FIGURE 1 Annual Photovoltaic Installations from 2000 to 2010. Data source: EPIA [11], Eurobserver [31] and own analysis.
With a cumulative installed capacity of over 29 GW, the European Union is leading in PV installations with a little more than 70% of the total worldwide 39 GW of solar photovoltaic electricity generation capacity at the end of 2010.
1 Asia and the Pacific Region
The Asia and Pacific Region shows an increasing trend in photovoltaic electricity system installations. There are a number of reasons for this development, ranging from declining system prices, heightened awareness, favourable policies and the sustained use of solar power for rural electrification projects. Countries such as Australia, China, India, Indonesia, Japan, Malaysia, South Korea, Taiwan, Thailand, The Philippines, and Vietnam show a very positive upward trend, thanks to increasing governmental commitment towards the promotion of solar energy and the creation of sustainable cities.
The introduction or expansion of feed-in-tariffs is expected to be an additional big stimulant for on-grid solar PV system installations for both distributed and centralised solar power plants in countries such as Australia, Japan, Malaysia, Thailand, Taiwan, and South Korea.
The Asian Development Bank (ADB) launched an Asian Solar Energy Initiative (ASEI) in 2010, which should lead to the installation of 3 GW of solar

FIGURE 2 Cumulative Photovoltaic Installations from 2000 to 2009. Data source: EPIA [11], Eurobserver [31] and own analysis.
power by 2012 [1]. In their report, ADB states: Overall, ASEI aims to create a virtuous cycle of solar energy investments in the region, toward achieving grid parity, so that ADB developing member countries optimally benefit from this clean, inexhaustible energy resource.
Three interlinked components will be used to realise the ASEI target:
Knowledge management. Development of a regional knowledge platform dedicated to solar energy in Asia and the Pacific.
Project development. ADB will provide $2.25 billion2 (€1.73 billion) to finance the project development, which is expected to leverage an additional $6.75 billion (€5.19 billion) in solar power investments over the period.
Innovative finance instruments. A separate and targeted Asia Accelerated Solar Energy Development Fund is set up to mitigate risks associated with solar energy. The fund will be used for a buy down programme to reduce the up-front costs of solar energy for final customers. ADB aims to raise $500 million (€385 million) and design innovative financing mechanisms in order to encourage commercial banks and the private sector to invest in solar energy technologies and projects.
Innovative finance instruments. Setting up of a separate and targeted Asia Accelerated Solar Energy Development Fund to mitigate risks associated with solar energy and buy down the up-front costs of solar energy. ADB aims to raise $500 million (€385 million) and design innovative financing mechanisms in order to encourage commercial banks and the private sector to invest in solar energy technologies and projects.
1.1 Australia
In 2010, 383 MW of new solar photovoltaic electricity systems were installed in Australia, bringing the cumulative installed capacity of grid-connected PV systems to 571 MW [2]. The 2010 market was dominated by the increase of grid-connected distributed systems, which increased from 67 MW in 2009 to 378 MW in 2010. The newly installed PV electricity generation capacity in Australia accounted for 20% of the new electricity generation capacity in 2010.
Most installations took advantage of the incentives under the Australian Government’s Solar Homes and Communities Plan (SHCP), Renewable Energy Target (RET) mechanisms and feed-in tariffs in some States or Territories. At the beginning of 2010, eight out of the eleven Australian Federal States and Territories had introduced some kind of feed-in tariff scheme for systems smaller than 10 kWp. All of these schemes have built-in caps which were partly reached that year so that in 2011 only five State schemes are still available for new installations and additional changes are expected in the course of this year.
1.2 India
For 2010, market estimates for solar PV systems vary between 50 MW to 100 MW, but most of these capacities are for off-grid applications. The Indian National Solar Mission was launched in January 2010, and it was hoped that it would give impetus to the grid-connected market, but only a few MW were actually installed in 2010. The majority of the projects announced will come on-line from 2011 onwards.
The National Solar Mission aims to make India a global leader in solar energy and envisages an installed solar generation capacity of 20 GW by 2020, 100 GW by 2030 and 200 GW by 2050. The short-term outlook up until 2013 was improved as well when the original 50 MW grid-connected PV system target in 2012 was changed to 1,000 MW for 2013.
1.3 Japan
In 2010, the Japanese market experienced a high growth, doubling its volume to 990 MW, bringing the cumulative installed PV capacity to 3.6 GW. In 2009 a new investment incentive of ¥70,000 per kW for systems smaller than 10 kW, and a new surplus power purchase scheme, with a purchase price of ¥48 per kWh for systems smaller than 10 kW, was introduced and the start of the discussion about a wider feed-in tariff.
In April 2011, METI (Ministry for Economy, Trade and Industry) announced a change in the feed-in tariffs and increased the tariff for commercial installations from ¥20 to 40 per kWh and decreased the tariff for residential installations to ¥42 per kWh.
As a consequence of the accident at the Fukujima Daiichi Nuclear Power Plant, Prime Minister Naoto Kan announced an overall review of the country’s Basic Energy Plan. At the G8 Summit held in Deauville, France, on 26 May 2011, he announced that Japan plans to increase the share of renewable energy in total electricity supply to over 20% in the 2020s. One measure to achieve this goal is to install a PV system on some 10 million houses suitable for it.
1.4 People’s Republic of China
The 2010 Chinese PV market estimates are between 530 MW to 690 MW, bringing the cumulative installed capacity to about 1 GW. This is a significant increase from the 160 MW in 2009, but still only 5% to 7% of the total photovoltaic production. This situation will change because of the revision of the PV targets for 2015 and 2020. According to press reports, the National Energy Administration doubled its capacity target for installed photovoltaic electricity systems to 10 GW in 2015 and further up to 50 GW in 2020 [25].
According to the 12th Five-Year Plan, which was adopted on 14 March 2011, China intends to cut its carbon footprint and be more energy efficient. The targets are 17% less carbon dioxide emissions and 16% less energy consumption unit of GDP. The total investment in the power sector under the 12th Five-Year Plan is expected to reach $803 billion (€618 billion), divided into $416 billion (€320 billion), or 52%, for power generation, and $386 billion (€298 billion) to construct new transmission lines and other improvements to China’s electrical grid.
Renewable, clean, and nuclear energy are expected to contribute to 52% of the increase and it is planned to increase power generation capacity from non-fossil fuels to 474 GW by 2015.
The investment figures necessary are in-line with a World Bank report stating that China needs an additional investment of $64 billion (€49.2 billion) annually over the next two decades to implement an “energy-smart” growth strategy [33]. However, the reductions in fuel costs through energy savings could largely pay for the additional investment costs according to the report. At a discount rate of 10%, the annual net present value (NPV) of the fuel cost savings from 2010 to 2030 would amount to $145 billion (€111.5 billion), which is about $70 billion (€53.8 billion) more than the annual NPV of the additional investment costs required.
1.5 South Korea
In 2010, about 180 MW of new PV systems were installed in South Korea, about the same as the year before, bringing the cumulative capacity to a total of 705 MW. The Korean PV industry expects a moderate increase for 2011, due to the fact that the feed-in tariff scheme is in its final year and the Korean Government continues its “One Million Green Homes” Project, as well as other energy projects in the provinces. The implementation of the Renewable Portfolio Standard in 2012 has additional consequences, as systems will need to be installed by the end of 2011 to generate electricity.
In January 2009, the Korean Government had announced the Third National Renewable Energy Plan, under which renewable energy sources will steadily increase their share of the energy mix between now and 2030. The Plan covers such areas as investment, infrastructure, technology development and programmes to promote renewable energy. The new Plan calls for a renewable energies share of 4.3% in 2015, 6.1% in 2020, and 11% in 2030.
1.6 Taiwan
In June 2009, the Taiwan Legislative Yuan gave its final approval to the Renewable Energy Development Act, a move that is expected to bolster the development of Taiwan’s green energy industry. The new law authorises the Government to enhance incentives for the development of renewable energy via a variety of methods, including the acquisition mechanism, incentives for demonstration projects and the loosening of regulatory restrictions. The goal is to increase Taiwan’s renewable energy generation capacity by 6.5 GW to a total of 10 GW within 20 years. In January 2011, the Ministry of Economic Affairs (MOEA) announced the revised feed-in tariffs for 2011. In 2011, the price paid by the state-owned monopoly utility, Taiwan Power, will fall 30% from 11.12 NT$3/kWh (0.264 €/kWh) to 7.33 NT$/kWh per kWh (0.175 €/kWh) for solar installations, with an exception for rooftop installations which will be eligible for rates of 10.32 NT$/kWh (0.246 €/kWh).
Despite the favourable feed-in tariff, the total installed capacity at the end of 2010 was only between 19 MW and 20 MW and the annual installation of about 7 to 8 MW was far less than 1% of the 3.2 GW solar cell production in Taiwan that year.
1.7 Thailand
Thailand enacted a 15-year Renewable Energy Development Plan (REDP) in early 2009, setting the target to increase the Renewable Energy share to 20% of final energy consumption of the country in 2022. Besides a range of tax incentives, solar photovoltaic electricity systems are eligible for a feed-in premium or “Adder” for a period of 10 years. However, there is a cap of 500 MW eligible for the original 8 THB4/kWh (0.182 €/kWh) “Adder” (facilities in the 3 Southern provinces and those replacing diesel systems are eligible for an additional 1.5 THB/kWh (0.034 €/kWh)), which was reduced to 6.5 THB/kWh (0.148 €/kWh) for those projects not approved before 28 June 2010.
As of October 2010, applications for 1.6 GW, under the Very Small Power Producer Programme (VSPP), and 477 MW, under the Small Power Producer Programme (SPP), were submitted. In 2010 it is estimated that between 20 MW and 30 MW were actually added, increasing the total cumulative installed capacity to 60 MW to 70 MW.
2 Emerging Markets
2.1 Asia
2.1.1 Bangladesh
In 1997, the Government of Bangladesh established the Infrastructure Development Company Limited (IDCOL) to promote economic development in Bangladesh. In 2003, IDCOL started its Solar Energy Programme to promote the dissemination of solar home systems (SHS) in the remote rural areas of Bangladesh, with the financial support from the World Bank, the Global Environment Facility (GEF), the German Kreditanstalt für Wiederaufbau (KfW), the German Technical Cooperation (GTZ), the Asian Development Bank, and the Islamic Development Bank. Since the start of the programme, more than 950,000 SHS, with an estimated capacity of 39 MW, have been installed in Bangladesh by May 2011.
According to a press report, the Government plans to implement a mega project of setting up 500 MW of PV electrical power generation and the Asian Development Bank (ADB) has, in principal, agreed to provide financial support to Bangladesh for implementing the project within the framework of the Asian Solar Energy Initiative [8,32].
2.1.2 Indonesia
The development of renewable energy is regulated in the context of the national energy policy by Presidential Regulation No.5/2006 [26]. The decree states that 11% of the national primary energy mix in 2025 should come from renewable energy sources. The target for solar PV is 870 MW by 2024. At the end of 2010 about 20 MW of solar PV systems were installed, mainly for rural electrification purposes.
2.1.3 Malaysia
The Malaysia Building Integrated Photovoltaic (BIPV) Technology Application Project was initiated in 2000 and at the end of 2009 a cumulative capacity of about 1 MW of grid-connected PV systems has been installed.
The Malaysian Government officially launched their GREEN Technology Policy in July 2009 to encourage and promote the use of renewable energy for Malaysia’s future sustainable development. By 2015, about 1 GW must come from Renewable Energy Sources according to the Ministry of Energy, Green Technology and Water (KETHHA). The Malaysian Photovoltaic Industry Association (MPIA) proposed a five-year programme to increase the share of electricity generated by photovoltaic systems to 1.5% of the national demand by 2015. This would translate into 200 MW grid-connected and 22 MW of grid systems. In the long-term beyond 2030, MPIA is calling for a 20% PV share. Pusat Tenaga Malaysia (PTM), and its IEA international consultant, estimated that 6,500 MW power can be generated by using 40% of the nation’s house rooftops (2.5 million houses) and 5% of commercial buildings alone. To realise such targets, a feed-in tariff is still under discussion, and it is hoped to be under way in the second half of 2011.
First Solar (USA), Q Cells (Germany) and Sunpower (USA) have started to set up manufacturing plants in Malaysia, with a total investment of RM 12 billion and more than 2 GW of production capacities. Once fully operational, these plants will provide 11,000 jobs and Malaysia will be the world’s sixth largest producer of solar cells and modules.
2.1.4 The Philippines
The Renewable Energy Law was passed in December 2008 [27]. Under the Law, the Philippines has to double the energy derived from Renewable Energy Sources within 10 years. On 14 June 2011, Energy Secretary, Rene Almendras unveiled the new Renewable Energy Roadmap, which aims to increase the share of renewables to 50% by 2030. The programme will endeavour to boost renewable energy capacity from the current 5.4 GW to 15.4 GW by 2030.
Early 2011, the country’s Energy Regulator National Renewable Energy Board (NREB) has recommended a target of 100 MW of solar installations that will be constructed in the country over the next three years. A feed-in tariff of 17 PHP/kWh (0.283 €/kWh)5 4 was suggested, to be paid from January 2012 on. The initial period of the programme is scheduled to end on 31 December 2014.
At the end of 2010, about 10 MW of PV systems were installed, mainly off-grid. SunPower has two cell manufacturing plants outside of Manila. Fab. No 1 has a nameplate capacity of 108 MW and Fab. No 2 adds another nameplate capacity of 466 MW.
2.1.5 Vietnam
In December 2007, the National Energy Development Strategy of Vietnam was approved. It gives priority to the development of renewable energy and includes the following targets: increase the share of renewable energies from negligible to about 3% (58.6 GJ) of the total commercial primary energy in 2010, to 5% in 2020, 8% (376.8 GJ) in 2025, and 11% (1.5 TJ) in 2050.
The Indochinese Energy Company (IC Energy) broke ground for the construction of a thin-film solar panel factory with an initial capacity of 30 MW and a final capacity of 120 MW in the central coastal Province of Quang Nam on 14 May 2011.
In March 2011, First Solar broke ground on its four-line photovoltaic module manufacturing plant (250 MW) in the Dong Nam Industrial Park near Ho Chi Minh City.
2.2 Europe and Turkey
Market conditions for photovoltaics differ substantially from country to country. This is due to different energy policies and public support programmes for renewable energies and especially photovoltaics, as well as the varying grades of liberalisation of domestic electricity markets. Within one decade, the solar photovoltaic electricity generation capacity has increased 160 times from 185 MW in 2000 to 29.5 GW in 2010 (Figure 3) [6,11,14,31].

FIGURE 3 Cumulative installed grid-connected PV capacity in EU1 CC. Note that the installed capacities do not correlate with solar resources.
A total of about 58.8 GW of new power capacity was constructed in the EU last year and 2.5 GW were decommissioned, resulting in 56.3 GW of new net capacity (Figure 4) [12,31]. Gas-fired power stations accounted for 28.3 GW, or 48% of the newly installed capacity. According to Platts, about 30 GW of gas-fired power station projects were suspended or cancelled [23]. Solar photovoltaic systems moved to the second place with 13.5 GW (23%), followed by 9.4 GW (16%) wind power; 4.1 GW (7%) MW coal-fired power stations; 570 MW (>1%) biomass; 450 MW (>1%) CSP, 210 MW (>1%) hydro, 230 MW (>1%) peat, and 150 MW (>1%) waste. The net installation capacity for oil-fired and nuclear power plants was negative, with a decrease of 245 MW and 390 MW respectively. The renewable share of new power installations was 40% in 2010.
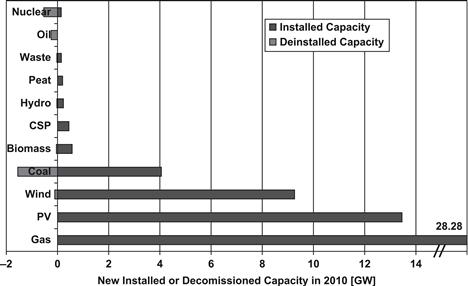
FIGURE 4 New installed or decommissioned electricity generation capacity in Europe in 2010.
In the following sub-sections, the market development in some of the EU Member States, as well as Switzerland and Turkey, is described.
2.2.1 Belgium
Belgium showed another strong market performance year in 2010, with new photovoltaic system installations of 420 MW bringing the cumulative installed capacity to 790 MW. However, most of the installations were done in Flanders, where since 1 January 2006 Green Certificates exist with 0.45 €/kWh for 20 years. In Brussels and Wallonia, the Green Certificates have a guaranteed minimum price between 0.15–0.65 €/kWh, depending on the size of the systems and region (Brussels 10 years, Wallonia 15 years).
2.2.2 Czech Republic
In the Czech Republic, photovoltaic systems with about 1.5 GW capacity, were installed in 2010, bringing the cumulative nominal capacity to 1.95 GW exceeding their own target of 1.65 GW set in the National Renewable Action Plan for 2020. The Law on the Promotion of Production of Electricity from Renewable Energy Sources went into effect on 1 August 2005 and guarantees a feed-in tariff for 20 years. The annual prices are set by the Energy Regulator. The electricity producers can choose from two support schemes, either fixed feed-in tariffs or market price + Green Bonus. The 2010 feed-in rate in the Czech Republic was CZK6 12.25 per kilowatt hour (0.48 €/kWh).
On 3 February 2010, the Czech transmission system operator, EPS, requested all main distribution system operators (EZ, E-ON, PRE) to stop permitting new renewable energy power plants, due to a virtual risk of instability of the electricity grid caused by intermittent renewable sources, especially photovoltaic and wind. Distribution System Operators (DSO) met the requirement on 16 February 2011. The moratorium still exists and SRES (Czech Association of Regulated Energy Companies) announced that the moratorium will continue until at least September.
A number of legislative changes took place in the second half of the year, which resulted in a lower feed-in tariff for systems larger than 30 kW (5.5 CZK/kWh or 0.216 €/kWh), the phase-out of ground-mounted PV systems from 1 March 2011 onwards and the introduction of a retroactive tax on benefits generated by PV installations.
2.2.3 France
In 2010, 720 MW of PV systems were connected to the grid in France, including about 100 MW which were already installed in 2009. This led to an increase of the cumulative installed capacity to 1.05 GW. However, this positive development came to a sudden stop when the French Prime Minister declared a three-month moratorium on new PV installations above 3 kW and a suspension of projects waiting for grid connection in December 2010.
This rapid growth led to a revision of the feed-in scheme in February 2011, setting a cap of 500 MW for 2011 and 800 MW for 2012 [20]. The new tariff levels only apply to rooftop systems up to 100 kW in size. In addition, those installations are divided into three different categories: residential; education or health; and other buildings with different feed-in tariffs, depending on the size and type of installation. The tariffs for these installations range between 0.2883 €/kWh and 0.46 €/kWh. All other installations up to 12 MW are just eligible for a tariff of 0.12 €/kWh.
2.2.4 Germany
Germany had the biggest market with 7.4 GW [6]. The German market growth is directly correlated to the introduction of the Renewable Energy Sources Act or “Erneuerbare Energien Gesetz” (EEG) in 2000 [9]. This Law introduced a guaranteed feed-in tariff for electricity generated from solar photovoltaic systems for 20 years and already had a fixed built in annual decrease, which was adjusted over time to reflect the rapid growth of the market and the corresponding price reductions. Due to the fact that until 2008 only estimates of the installed capacity existed, a plant registrar was introduced from 1 January 2009 on.
The German market showed two installation peaks during 2010. The first one was in June, when more than 2.1 GW were connected to the grid prior to the 13% feed-in cut which took effect on 1 July 2010. The second peak was in December with almost 1.2 GW just before the scheduled tariff reduction of another 13% on 1 January 2011. Compared to 2009, the feed-in tariff has been reduced by 33 to 36% depending on the system size and classification. In June 2011 the Bundesnetzagentur (German Federal Network Agency) announced the results of the PV system installation projection required under the Renewable Energy Sources Act (EEG) in order to determine the degression rates for the feed-in tariffs [7]. According to the Agency approx. 700 MW of PV systems were commissioned between March and May 2011 resulting in a projected annual growth of 2.8 GW, which is below the 3.5 GW threshold set for an additional reduction of the tariffs starting July 2011.
2.2.5 Greece
Greece introduced a new feed-in tariff scheme on 15 January 2009. The tariffs remained unchanged until August 2010 and are guaranteed for 20 years. However, if a grid-connection agreement was signed before that date, the unchanged FIT was applied if the system is finalised within the next 18 months. For small rooftop PV systems, an additional programme was introduced in Greece on 4 June 2009. This programme covers rooftop PV systems up to 10 kWp (both for residential users and small companies). In 2011, the tariffs decreased by 6.8% to 8.5%, depending on the size and location of the installation. In 2010, about 150 MW of new installations were carried out, bringing the total capacity to about 205 MW.
2.2.6 Italy
Italy again took the second place, with respect to new installations and added a capacity of about 2.5 GW, bringing cumulative installed capacity to 3.7 GW at the end of 2010 [14]. At the beginning of July 2011, the total connected PV capacity has surpassed 7 GW [15]. The Quarto Conto Energia (Fourth Energy Bill) was approved by the Italian Council of Ministers on 5 May 2011 [13]. The Bill introduced monthly reductions of the tariffs, starting from June 2011 until January 2012 and then another one in July 2012. In addition, the new Bill limits the feed-in tariffs for new systems up until the end of 2016, or until a cap of 23 GW is reached. In addition, separate caps for large systems are set for the second half of 2011 (1.35 GW) and 2012 (1.75 GW).
2.2.7 Spain
Spain is second regarding the total cumulative installed capacity with 3.9 GW. Most of this capacity was installed in 2008 when the country was the biggest market, with close to 2.7 GW in 2008 [11]. This was more than twice the expected capacity and was due to an exceptional race to install systems before the Spanish Government introduced a cap of 500 MW on the yearly installations in the autumn of 2008. A revised Decree (Royal Decree 1758/2008) set considerably lower feed-in tariffs for new systems and limited the annual market to 500 MW, with the provision that two thirds are rooftop mounted and no longer free-field systems. These changes resulted in a new installed capacity of about 100 MW and about 380 MW in 2010.
In 2010, the Spanish Government passed the Royal Decrees 1565/10 [16] and RD-L 14/10 [17]. The first one limits the validity of the feed-in tariffs to 28 years, while the latter reduces the tariffs by 10% and 30% for existing projects until 2014. Both Bills are “retroactive” and the Spanish Solar Industry Association (ASIF) [3] has already announced taking legal actions against them.
2.2.8 United Kingdom
The United Kingdom introduced of a new feed-in tariff scheme in 2010, which led to the installation of approximately 55 MW, bringing the cumulative installed capacity to about 85 MW. However, in March 2011, the UK Government proposed significant reductions of the tariffs, especially for systems larger than 50 kW.
2.2.9 Other European Countries and Turkey
Despite high solar radiation, solar photovoltaic system installation in Portugal has only grown very slowly and reached a cumulative capacity of 130 MW at the end of 2010.
The market in Slovakia showed an unexpected growth from less than 1 MW installed at the end of 2009 to about 144 MW at the end of 2010. In December 2010, the Slovak Parliament adopted an Amendment to the Renewable Energy Sources (RES) Promotion Act, decreasing the feed-in tariffs and from 1 February 2011 on only solar rooftop facilities or solar facilities on the exterior wall of buildings, with capacity not exceeding 100 kW, are eligible for the feed-in tariff. As a result, larger new solar projects in Slovakia are on hold.
In Turkey in March 2010, the Energy Ministry unveiled its 2010–2014 Strategic Energy Plan. One of Government’s priorities is to increase the ratio of renewable energy resources to 30% of total energy generation by 2023. At the beginning of 2011, the Turkish Parliament passed a Renewable Energy Legislation which defines new guidelines for feed-in tariffs. The feed-in tariff is 0.133$/kWh (0.10 €/kWh) for owners commissioning a PV system before the end of 2015. If components ‘Made in Turkey’ are used, the tariff will increase by up to $0.067 (€0.052), depending on the material mix. Feed-in tariffs apply to all types of PV installations, but large PV power plants will receive subsidies up to a maximum size of 600 MWp.
2.3 North America
2.3.1 Canada
In 2010, Canada more than tripled its cumulative installed PV capacity to about 420 MW, with 300 MW new installed systems. This development was driven by the introduction of a feed-in tariff in the Province of Ontario, enabled by the ‘Bill 150, Green Energy and Green Economy Act, 2009.’ On the Federal level, only an accelerated capital cost allowance exists under the Income Tax Regulations. On a Province level, nine Canadian Provinces have Net Metering Rules, with solar photovoltaic electricity as one of the eligible technologies, Sales Tax Exemptions and Renewable Energy Funds exist in two Provinces and Micro Grid Regulations and Minimum Purchase Prices each exist in one Province.
The Ontario feed-in tariffs were set in 2009 and depend on the system size and type, as follows:
• Rooftop or ground-mounted ≤ 10 kW 80.2 ¢/kWh (0.59 €/kWh7)
• Rooftop > 10 kW ≤ 250 kW 71.3 ¢/kWh (0.53 €/kWh)
• Rooftop > 250 kW ≤ 500 kW 63.5 ¢/kWh (0.47 €/kWh)
• Rooftop > 500 kW 53.9 ¢/kWh (0.40 €/kWh)
• Ground-mounted8 ∗ > 10 kW ≤ 10 MW 44.3 ¢/kWh (0.33 €/kWh)
The feed-in tariff scheme has a number of special rules, ranging from eligibility criteria, which limit the installation of ground-mounted PV systems on high-yield agricultural land to domestic content requirements and additional ‘price adders’ for Aboriginal and community-based projects. Details can be found in the Feed-in Tariff Programme of the Ontario Power Authority [21].
2.3.2 United States of America
With close to 900 MW of new installed PV capacity, the USA reached a cumulative PV capacity of 2.5 GW at the end of 2010. Utility PV installations more than tripled compared to 2009 and reached 242 MW in 2010. The top ten States—California, New Jersey, Nevada, Arizona, Colorado, Pennsylvania, New Mexico, Florida, North Carolina and Texas—accounted for 85% of the US grid-connected PV market [28].
PV projects with Power Purchase Agreements (PPAs), with a total capacity of 6.1 GW, are already under contract and to be completed by 2014 [10]. If one adds those 10.5 GW of projects which are already publicly announced, but PPAs have yet to be signed, this make the total “pipeline” more than 16.6 GW.
Many State and Federal policies and programmes have been adopted to encourage the development of markets for PV and other renewable technologies. These consist of direct legislative mandates (such as renewable content requirements) and financial incentives (such as tax credits). One of the most comprehensive databases about the different support schemes in the US is maintained by the Solar Centre of the State University of North Carolina. The Database of State Incentives for Renewable Energy (DSIRE) is a comprehensive source of information on State, local, utility, and selected Federal incentives that promote renewable energy. All the different support schemes are described therein and it is highly recommended to visit the DSIRE web-site http://www.dsireusa.org/ and the corresponding interactive tables and maps for details.
References
1. Asian Development Bank. Asia Solar Energy Initiative: A Primer. ISBN 978-92-9092-314-5 April 2011;.
2. Watt M, Passey R, Johnston W. PV in Australia 2010—Australian PV Survey Report 2010. Australian PV Association May 2011;.
3. Asociación de la Industria Fotovoltaica (ASIF), <http://www.asif.org/principal.php?idseccion=565/>.
4. Johannes Bernreuther and Frank Haugwitz, The Who’s Who of Silicon Production. 2010;.
5. Bundesverband Solarwirtschaft, Statistische Zahlen der deutschen Solarwirtschaft. June 2011;.
6. German Federal Network Agency (Bundesnetzagentur), Press Release 21 March 2011.
7. German Federal Network Agency (Bundesnetzagentur), Press Release 16 June 2011.
8. The Daily Star. Target 500 MW solar project. 15 May 2011; In: http://www.thedailystar.net/newDesign/news-details.php?nid=185717/; 15 May 2011;.
9. Gesetz über den Vorrang Erneuerbaren Energien (Erneuerbare-Energien-Gesetz—EEG), Bundesgestzblatt Jahrgang 2000 Teil I, Nr. 13, p.305 (29.03.2000).
10. The US PV Market in 2011—Whitepaper. Greentech Media Inc., Enfinity America Corporation 2011.
11. European Photovoltaic Industry Association. Global Market Outlook for Photovoltaics until 2015 2011.
12. European Wind Energy Association. Wind in power—2010 European Statistics. February 2011.
13. Gazzetta Ufficiale, n. 109, 12 maggio 2011, Ministero dello sviluppo economico, D.M. 5-5-2011; Incentivazione della produzione di energia elettrica da impianti solari fotovoltaici.
14. Gestore Servici Energetici, Press Release, 15 February 2011.
15. Gestore Servici Energetici, Aggiornamento: 1 July 2011.
16. Royal Decree 1565/10, published on 23 November 2010 <http://www.boe.es/boe/dias/2010/11/23/pdfs/BOE-A-2010-17976.pdf/>.
17. Royal Decree RD-L 14/10, published on 24 December 2010 http://www.boe.es/boe/dias/2010/12/24/pdfs/BOE-A-2010-19757.pdf/.
18. ICIS news Asia polysilicon prices to firm in 2011 on solar demand. January 2011;13.
19. Ikki Osamu. PV Activities in Japan. May 2011;17.
20. Ministère de l’économie, de l’industrie et de l’emploi, Press Release, 24 February 2011.
21. Ontario Power Authotity, Feed-In Tariff Programme, 30 September 2009 http://fit.powerauthority.on.ca/Storage/97/10759_FIT-Program-Overview_v1.1.pdf/.
22. Photon International. March 2011.
23. Platts, Power in Europe, January 2011.
24. PV News, May 2011, published by Greentech Media, ISSN 0739–4829.
25. Reuters. 06 May 2011; China doubles solar power target to 10 GW by 2015 http://www.reuters.com/article/2011/05/06/china-solar-idUKL3E7G554620110506/; 06 May 2011.
26. Presidential Regulation 5/2006, National Energy Policy, published 25 January 2006.
27. Republic of the Philippines, Congress of the Philippines, Republic Act No. 9513 December 16, 2008, AN ACT PROMOTING THE DEVELOPMENT, UTILIZATION AND COMMERCIALIZATION OF RENEWABLE ENERGY RESOURCES AND FOR OTHER PURPOSES.
28. Solar Energy Industry Association (SEIA). U.S Solar Market Insight, US Solar Industry Year in Review. 2010.
29. Solar Energy Industry Association (SEIA). U.S Solar Market Insight, 1st Quarter. 2011.
30. Semi PV Group, Semi China Advisory Committee and China PV Industry Alliance (CPIA). China’s Solar Future—A Recommended China PV Policy Roadmap 2.0 April 2011.
31. Systèmes. Solaires, le journal du photovoltaique no 5—2011. Photovoltaic Energy Barometer April 2011; ISSN 0295–5873.
32. UNB connect. ADB assures fund for 500 MW solar system. 4 June 2011; In: http://www.unbconnect.com/component/news/task-show/id-49440; 4 June 2011.
33. The World Bank. Winds of Change—East Asia’s Sustainable Energy Future. May 2010.