
To customize or alter a dashboard, click on the Customize link at the top-right section of the dashboard. A pop-up window of selections will appear as shown in the following screenshot. (Your screen may have each grey area expanded to show selections). Three tabs are featured: Content, Layout, and Access. By default, up to 12 portlets may be displayed in a dashboard. Note that this limit can be changed by your system administrator.
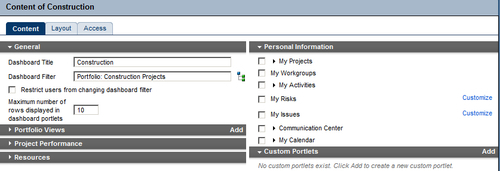
The Content tab contains six sections:
- General
- Portfolio Views
- Project Performance
- Resources
- Personal Information
- Custom Portlets
This is where you name the dashboard. Keep the name short and simple, so that it will fit well on the Dashboard tab.

Choose a filter to set the default project information to display for this dashboard. You can filter by portfolios, specific project codes, or projects.
You may choose to restrict users from changing the dashboard by checking the checkbox. Without this checked, any user can alter this dashboard.
Special 8.2 feature—a user may select a sub-filter for his personal perspective of the dashboards, if desired.
To minimize the screen size and time to display, select a lower number of rows to display in each portlet.
A list of available portfolio views can be chosen from the Portfolio Views portlet. If none are shown, then you must create a portfolio view in the Portfolios section. See Chapter 11, Portfolios of this book for more information.
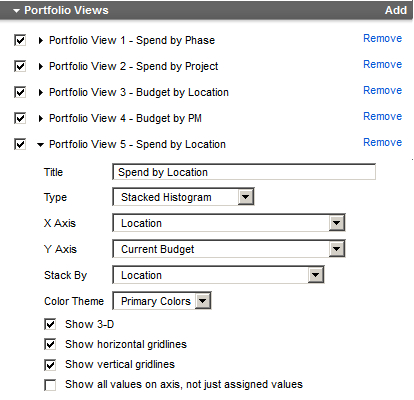
Check the checkbox to display a portfolio view, click the Add link or the Remove link to add or remove portfolio views from this dashboard.
If you are adding a portfolio view to the dashboard, check the box next to the portfolio name. An unchecked box leaves the view available, but not visible.
You can also customize the portfolio view using the same settings as explained in earlier chapters.
This set of portlets is concerned with a range of project properties such as schedule performance, earned value, and key performance indicators (KPIs).

Three main performance portlets are available with choices to each one:
- Schedule Performance
- Earned Value Performance
- Index Performance
The Schedule Performance portlet shows progress from a schedule perspective with columns for data that is To Date and/or Forecast at Completion data. To choose which ones to show, simply check the checkbox with a double-click. The Earned Value Performance portlet has the same two choices on columns.
The Index Performance portle t can show earned value standard indexes for each project such as Schedule Performance Index (SPI), Cost Performance Index (CPI), and To Complete Performance Index (TCPI).
Choose the data you wish to show by double-clicking on the attendant checkbox. These values follow standard numeric values as recommended by the project management institute where 1.00 is a perfect score indicating that all items were executed as planned for both time and cost data. Subsequently, score of 0.85 states that only 85 percent of what was planned to be done or spent was actually completed or spent. A score greater than 1.00 indicates that you did more than planned or spent more than planned. The planned value for these calculations is the baseline and the actual values are in Actual Cost and Actual Units fields on the project.
The Project Statistics portlet is a popular portlet to use on dashboards because it allows a user to choose the columns of data as desired. Dozens of data columns are available to select and show in this portlet.

The Project Health portlet is also popular as a very high-level summary of the project. The data is not editable or customizable but it is generated from Global settings in the administrative menu. The portlet displays a short paragraph about the progress of the project.

The Project Notebooks portlet is where all the project level notebook topics are shown in one location. This is especially helpful if your business process is consistently used to show reasons for delays, reasons for change orders, or other significant project communications:

The Project Gantt Chart portlet is a great way to view the entire group of projects (those matching filter criteria for this dashboard) on a single Gantt-styled chart.
There are two frames in this portlet. The left-hand side frame is a table listing of projects that are typically collapsed to the project level. By clicking on the plus sign next to the project folder icon, the project is expanded to show its milestone activities.

In the right-hand side frame, each group of bars represents each project and is shown along a timeline so that you can evaluate each project against the others in terms of overall timing. Just as in other parts of P6, the blue bar represents completed activities, the green bar represents planned activities, and the yellow bar represents the baseline activities. Ideally the blue/green bars should align perfectly with the yellow to indicate all is progressing as planned. If the yellow bar is separated from the blue/green bar, then work is not progressing as planned in the baseline. If the project is expanded to show milestone activities, planned dates are charted using a black diamond and the baseline dates are charted using a yellow diamond.
In the following example, the first project Arcadia finished later than planned. A milestone in first quarter 2011 was missed by a small margin, which delayed the final milestone by a larger margin—pushing it into the next quarter.
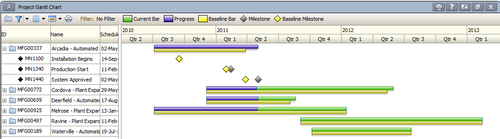
The Melrose project is progressing as planned. The Waterville project shows to be planned in the future with no progress. This chart shows progress as of mid-Q2 according to the imaginary vertical line along the blue part of the bars.
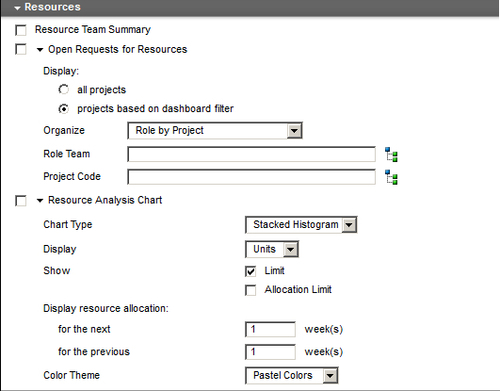
The resources section of the dashboard customization is shown next and has some of the best features in the web-based part of P6. There are three main options to show in portlets for resource information:
- Resource Team Summary
- Open Requests for Resources
- Resource Analysis Chart
The Resource Team Summary portlet shows a list of resources that are assigned to the projects within dashboard filter and which belongs to the team shown in the Resource Team Summary portlet filter at the top-right corner of the portlet.
Resources are listed on the far left-hand side. Over-allocated resources will have a red spot on their icon. In the following example, all resources are over-allocated except Harry Shaw and Robert Lincoln.

The primary role is the designation given to that resource in the resource pool and may or may not be the role they are assigned to perform on the project. The number of active projects to which each resource listed is assigned is in the last column on the right.
A favorite feature of this portlet is the E-mail resource team link at the top-right corner of the portlet. Users can click on this link and an e-mail is auto-populated with the team members' e-mail addresses in the TO field. The login used to access the system must have its own e-mail address assigned for this feature to operate. Additionally the e-mail exchange protocols must be set up by your administrator. See the P6 Admin Guide for more information or contact your administrator.
The E-mail resource team feature does not use Outlook or other e-mail clients to send the e-mail. The e-mail is sent from the P6 e-mail feature within the P6 system. If you want a copy of the e-mail, add your own e-mail address into the CC field.
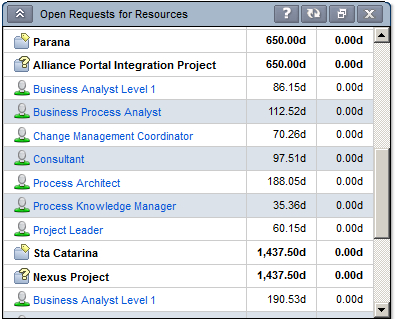
The Open Requests for Resources portlet allows users to show which activities on projects have only a role (that is, engineer) assigned and need a resource (that is, David Jackson) assigned by their Manager.

The portlet has a number of customizations. The first choice to be made is to show open assignments on all projects or just those within the filter for this dashboard. The Organize field allows a user to define how the listed open assignments are sorted and shown. The drop-down list offers views where open assignments are shown as:
- Roles with open assignments project by project
- Projects with open assignments role by role
- Roles with open assignments, sorted by project, and sub-sorted by project codes
If you select the Role by Project by Project Codes feature, then you must select a code before saving this customized dashboard.

The following example shows the Open Request for Resources portlet set to organize by Role by Project by Project Codes, with Location as the selected Project Code. The project Alliance… is under the Project Code location Parana. The project code icon is a file folder with a tag on it.
To learn how to fulfill an open request, see Chapter 6, Resources, and the scheduling/creating a project discussions in this book.
The Resource Analysis portlet is the last one in the Resources section of the Dashboard customization screen. Here several types of graphs can be selected to show resources that are assigned to the projects within the filtered portfolio for this dashboard in terms of usage. Each graph will show a different perspective of resource usage, availability, and assignments.

These charts are similar to the ones shown in Chapter 14, Capacity Planning and ROI.
The next section of the dashboard portlets is the Personal Information section . This section is used to identify you (the user you have logged in as) as a specific resource assigned to project work. The portlets available in this section for viewing on the dashboard will display information as it relates to you (logged-in user) and your assignments (resource on activities and projects). For example, the first portlet is My Projects and this portlet requires that the user is associated with a resource and/or the OBS.
Tip
Keep in mind that choosing to display items in the Personal Information portlets will show items selected for the currently logged-in user. David Flintstone signing in will see all of his personal items on this dashboard, but when Wilma signs in, she will see hers in that portlet. These portlets display user-based information.
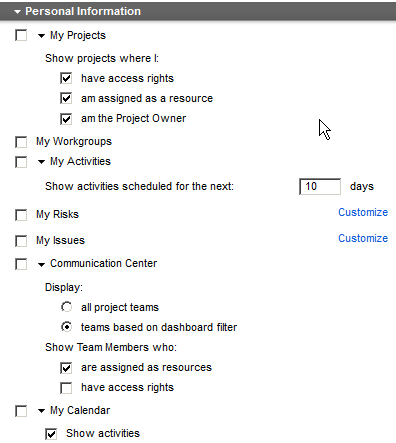
To use the My Projects portlet , select one or more of these three options:
- The have access rights checkbox will display only those projects that your security profile allows—the OBS element you have been assigned to.
- The am assigned as a resource checkbox will display any project on which your associated resource has been assigned to activities. (Resource associated with your login is a setting managed in your security profile and also in the resource administration area).
- The am the Project Owner checkbox will display any project on which you have been deemed the project owner in the Project Owner field of the General tab of Project Details.
The next area of the Personal Information set of portlets options is where you can choose to show workgroups your user ID is associated with, the activities your associated resource is assigned to (and you can indicate how far into the future P6 looks for those activities) and where your assigned risks and issues can be displayed in the portlet. The risks and issues you entered will also show in this portlet.
Remember, these are individually personal and user-based. Each user sees their own information in these portlets.
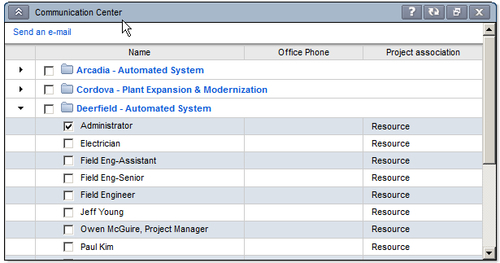
The next portlet is the Communication Center. This is where you can choose to show all project teams or teams that relate to the projects matching the filter criteria for this dashboard. The Communication Center is where a user can send e-mail to one or more team members who are also assigned to the project, or they can view and send to everyone assigned to the project. The Project association column shows how each team member is associated with the project. For example, as an assigned resource, project owner, and so on. Select the person or full team at the project level to send e-mails by checking the appropriate checkbox.
My Calendar is the last portlet available under Personal Information section of the dashboard customization. Check this checkbox to display the My Calendar portlet in which all assignments scheduled for you can be shown week by week as you click on that timeframe in the calendar provided. The colors shown have the same meaning throughout P6 where blue represents work completed, green is work planned, and red is for critical path activities. Blue and green activities represent work currently in progress.
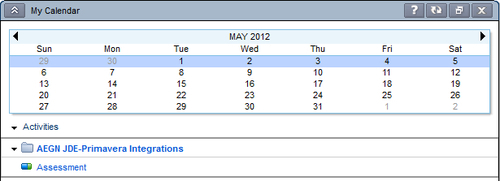
This simple portlet displays useful information so that a user can quickly see activities for the highlighted week.
The final section of the customizing dashboards screen is where users can add a custom portlet to this dashboard. Custom portlets are acually a place to insert any website address or URL. Several websites can be added using the Add button at the top-right corner in the grey title bar for Custom Portlets.
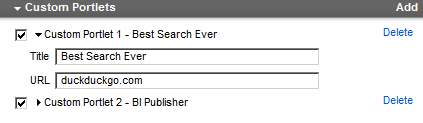
The information that will appear at the top of the portlet is whatever is typed in the Title field. Make the title short so it appears on screen easily and make it very descriptive for the user. Good ideas for this area are to insert your SharePoint site, extranet project area, or other Primavera modules, such as, contract or risk management.
Tip
If the URL you enter here is actually a web-served app, the username and password for P6 must match the username and password for the app. If they do not match, some software will not load and cause an error message to appear in this portlet. Not all apps will allow the first screen to be the actual app as it may bypass a login screen. In these cases, make sure the URL is for the login screen.
The goal for dashboards is to place all relevant project information on one screen and one location so the team members can literally be on the same page. Make sure the custom portlet URL leads users to pertinent information.
We have described every feature that allows a user to define the content of dashboards and now the next step is to work on how that content looks on screen. For this function, we will use the Layout tab.