
When viewing tabular data on a Portfolio Analysis scorecard in Capacity Planning, you can assign a waterline to the table. The waterline will show which items are below the line by shading them blue, as though there were under water.

The waterline has two key properties—the parameter and the sort order.
The parameter is the quantity you will use to measure if a project is above or below the waterline. You choose the parameter, the comparison operator, and a value.
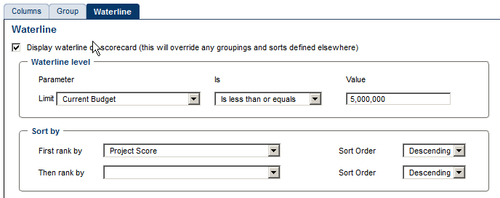
In our example, we use current budget as the parameter, and request that a waterline be drawn for all projects when the cumulative value is less than $5,000,000 and we sort by project score. Therefore, this will show the top-scoring projects whose cumulative value is at or below $5,000,000. All the other projects will show as under water.
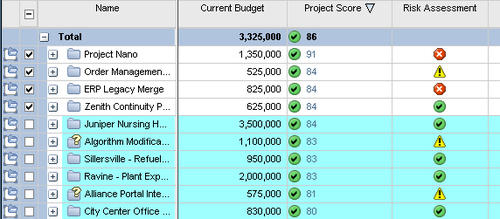
This view will show us the best-scoring projects we can afford for $5,000,000. Now let's ask the question—which are the worst-performing projects that we can get rid of in order to save $10,000,000? To get this information, we simply reverse the Sort Order to Ascending and change the limit to $10,000,000.
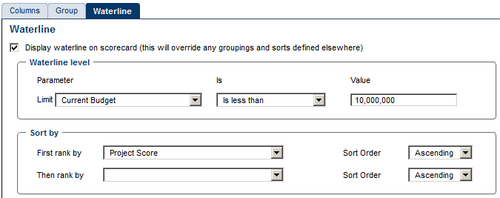
Now the poorest-performing projects are shown above water.

Scorecards can be exported to Excel by pressing the export icon at the top of the display.
Note that the generated file will go to a temporary location on your computer. You must click on Save As… in order to save and make changes to it.