
When resources perform work on an activity, you can choose how the resource units or costs are spread through time. This is done using a resource curve. To see this column, right-click on the Resources tab on an activity, customize the columns, and choose Curve.
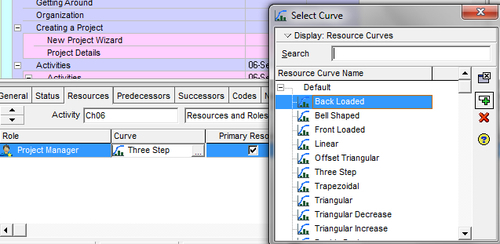
A wealth of curves from which to choose is presented. These curves will determine how the effort and cost of a resource is spread over time. This could reflect expected cost for labor or the expected consumption of a material resource.
To view and modify resource curves, choose the menu Enterprise | Resource Curves. A list of resource curves, much like the one shown in the previous screenshot, appears. This screen allows you to add, modify, and delete curves. In the EPPM web client, resource curves are defined in the Resource Curves section under the Administer | Enterprise Data. Because so many standard curves come standard with P6, there may be no need to define your own.
If you delete a resource curve that is assigned to an existing assignment, you will be prompted and warned that the curve is previously assigned, and that deleting it will remove previous calculations affecting periods of performance reporting that occurred in the past. So only delete with good reason and with great caution.
When you add a resource curve, you are first prompted to select an initial, existing source curve to copy as a starting point, and are then taken to a screen much like the following screenshot:
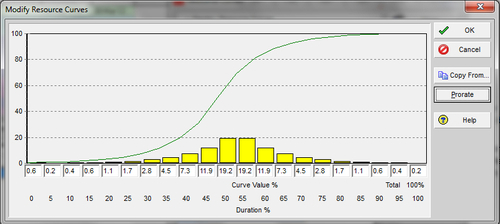
Here a curve is divided into 21 time slices, ranging from 0 to 100 percent in five percent intervals. You may enter any numbers from 0.1 to 100 in these boxes. These represent a time weighting of the resource usage. That is, based on an activity's state of progress, the specific resource will prorate the cost or resource usage accordingly. The cumulative total must be 100 percent, and you can normalize your curve at any time by pressing the Prorate button.
There are three components to the resource curve screen:
- The S curve that provides a summary total for all the to date percent periods.
- The histogram that provides an incremental portrait of the workload for the duration of the activity that will use this curve. The visual weight may be adjusted by clicking on the top of a histogram and moving it up or down.
- The numerical value of the histogram. The specific value for a period may be modified directly in the respective field.
The sum total of the curve must equal 100 percent. To review the correct totals use the Prorate button to adjust the values to the appropriate periodic values.