
The EPS is the outsider's view of your company, showing your lines of business. The EPS is laid out in a tree structure. A construction company may have an EPS tree with only two nodes: development, for work on existing sites and construction, for new sites. Or an oil company may split their work first between Natural Gas and Heavy Oil. The structure may be broken down further. For example, Heavy Oil may be broken down into Primary, Cold EOR, and Thermal. The idea is that all projects under an EPS node share common characteristics and may be managed by the same team. The following is an example from ExxonMobil:
- Refinery Division
- US Domestic Operations
California
- Torrance
Louisiana
- Baton Rouge
New Jersey
- Bayway
- Clinton
- Edison
- Paulsburo
Texas
- Houston
Virginia
- Fairfax
- US Domestic Operations
- Chemical Division
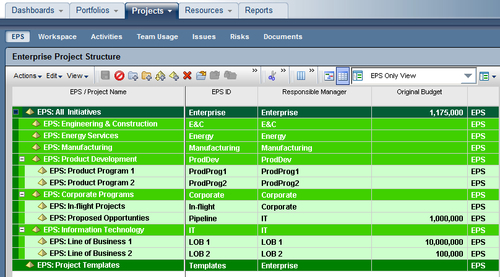
In P6 web, the EPS is administered through the Projects tab in the EPS screen. The default view shows projects within the EPS, but you can choose a pre-defined view called EPS Only View to show only EPS.
In Professional, choose Enterprise | Enterprise Project Structure… to bring up the EPS management screen.

The EPS is basically a tree of information. When discussing this tree, the term node is used to describe each element of the tree. For example, Enterprise is the top node in the previous screenshot. The topmost node, also called the root node, has no parent. A node can have other nodes beneath it, and these are called child nodes. A child node, likewise, can have a parent node above it. In the previous screenshot, the children of the root Enterprise node are E&C, Energy, Manufacturing, and so on. The node Corporate has the children In-flight and Pipeline, and has the parent node Enterprise.
Each element of the EPS has three properties, shown at the bottom of the screen:
- EPS ID
- EPS Name
- Responsible Manager
The first two are straightforward. EPS ID is a unique identifier, a convenient and short way to describe the element, whereas the EPS name is a more verbose description. Responsible Manager shows what OBS element has rights over that particular EPS node. Note that the OBS elements shown have the same name as their EPS nodes. This indicates that the external organization of the company matches its internal responsibility quite well in this instance.
In the upper left-hand corner of the main EPS screen is a dropdown called Display: EPS. This can be used to alter how the EPS is displayed. By default the EPS screen is shown in table view, which lists the EPS elements in a tree. You can also choose Chart View to see a chart-centric display of the EPS.

The Chart View shows the EPS as you might display it on a wall chart.

If you have a very large EPS, you can find elements by using the Find option or by pressing F3 or Ctrl + F. Note that it is better to use the table view when attempting to find items because the chart view does not allow searching over all EPS properties.
Print preview shows the information on the screen in a printable report. This can be useful if you want to actually print and hang your EPS chart on the wall for analysis.
Columns lets you choose which columns to display. In table view the only options are EPS ID and Name. However, in chart view there are many other columns to choose from.
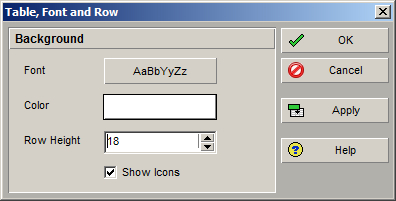
Table, Font and Row is another control that you will commonly see in many different layout menus. Use this screen to alter the font, color, and size of the displayed text.
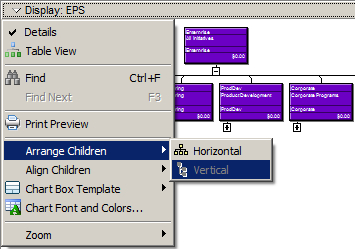
If you view the EPS in Chart View, there are more options on the display menu:
- Arrange Children
- Align Children
- Chart Box Template
These are all fairly straightforward and can be used to modify how the chart appears, which is helpful if printing out the EPS for display.
Now that we have seen how to manage the EPS, let us examine what EPS does. Every project in P6 must exist within a single EPS node. One of the standard project layouts in P6 shows all projects within the EPS structure. This is a common way of displaying projects.

The EPS provides one of the many methods for organizing projects. Some projects may clearly fall under one EPS node, while others should span multiple ones. In later chapters, we will see how to organize projects into portfolios, which is a more flexible solution for organizing reports.