
Cellular Network Security
Peng Liu, Pennsylvania State University
Thomas F. LaPorta, Pennsylvania State University
Kameswari Kotapati, Pennsylvania State University
In recent years, cellular networks have become open public networks to which end subscribers have direct access. This has greatly increased the threats to the cellular network. Though cellular networks have vastly advanced in their performance abilities, the security of these networks still remains highly outdated. As a result, they are one of the most insecure networks today—so much so that using simple off-the-shelf equipment, any adversary can cause major network outages affecting millions of subscribers.
In this chapter, we address the security of the cellular network. We educate readers on the current state of security of the network and its vulnerabilities. We also outline the cellular network specific attack taxonomy, also called the three-dimensional attack taxonomy. We discuss the vulnerability assessment tools for cellular networks. Finally, we provide insights as to why the network is so vulnerable and why securing it can prevent communication outages during emergencies.
1. Introduction
Cellular networks are high-speed, high-capacity voice and data communication networks with enhanced multimedia and seamless roaming capabilities for supporting cellular devices. With the increase in popularity of cellular devices, these networks are used for more than just entertainment and phone calls. They have become the primary means of communication for finance-sensitive business transactions, lifesaving emergencies, and life-/mission-critical services such as E-911. Today these networks have become the lifeline of communications.
A breakdown in the cellular network has many adverse effects, ranging from huge economic losses due to financial transaction disruptions; loss of life due to loss of phone calls made to emergency workers; and communication outages during emergencies such as the September 11, 2001, attacks. Therefore, it is a high priority for the cellular network to function accurately.
It must be noted that it is not difficult for unscrupulous elements to break into the cellular network and cause outages. The major reason for this is that cellular networks were not designed with security in mind. They evolved from the old-fashioned telephone networks that were built for performance. To this day, the cellular network has numerous well-known and unsecured vulnerabilities providing access to adversaries. Another feature of cellular networks is network relationships (also called dependencies) that cause certain types of errors to propagate to other network locations as a result of regular network activity. Such propagation can be very disruptive to the network, and in turn it can affect subscribers. Finally, Internet connectivity to the cellular network is another major contributor to the cellular network’s vulnerability because it gives Internet users direct access to cellular network vulnerabilities from their homes.
To ensure that adversaries do not access the network and cause breakdowns, a high level of security must be maintained in the cellular network. However, though great efforts have been made to improve the cellular network in terms of support for new and innovative services, greater number of subscribers, higher speed, and larger bandwidth, very little has been done to update the security of the cellular network. Accordingly, these networks have become highly attractive targets to adversaries, not only because of their lack of security but also due to the ease with which these networks can be exploited to affect millions of subscribers.
In this chapter we analyze the security of cellular networks. Toward understanding the security issues in cellular networks, the rest of the chapter is organized as follows. We present a comprehensive overview of cellular networks with a goal of providing a fundamental understanding of their functioning. Next we present the current state of cellular network security through an in-depth discussion on cellular network vulnerabilities and possible attacks. In addition, we present the cellular network specific attack taxonomy. Finally, we present a review of current cellular network vulnerability assessment techniques and conclude with a discussion.
2. Overview of Cellular Networks
The current cellular network is an evolution of the early-generation cellular networks that were built for optimal performance. These early-generation cellular networks were proprietary and owned by reputable organizations. They were considered secure due to their proprietary ownership and their closed nature, that is, their control infrastructure was unconnected to any public network (such as the Internet) to which end subscribers had direct access. Security was a nonissue in the design of these networks.
Recently, connecting the Internet to the cellular network has not only imported the Internet vulnerabilities to the cellular network, it has also given end subscribers direct access to the control infrastructure of the cellular network, thereby opening the network. Also, with the increasing demand for these networks, a large number of new network operators have come into the picture. Thus, the current cellular environment is no longer a safe, closed network but rather an insecure, open network with many unknown network operators having nonproprietary access to it. Here we present a brief overview of the cellular network architecture.
Overall Cellular Network Architecture
Subscribers gain access to the cellular network via radio signals enabled by the radio access network, as shown in Figure 12.1. The radio access network is connected to the wireline portion of the network, also called the core network. Core network functions include servicing subscriber requests and routing traffic. The core network is also connected to the Public Switched Telephone Network (PSTN) and the Internet, as illustrated in Figure 12.1 [1].
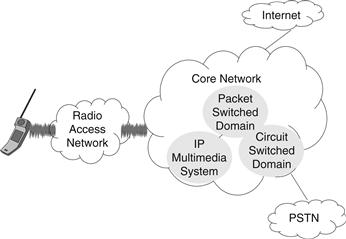
Figure 12.1 Cellular network architecture.
The PSTN is the circuit-switched public voice telephone network that is used to deliver voice telephone calls on the fixed landline telephone network. The PSTN uses Signaling System No. 7 (SS7), a set of telephony signaling protocols defined by the International Telecommunication Union (ITU) for performing telephony functions such as call delivery, call routing, and billing. The SS7 protocols provide a universal structure for telephony network signaling, messaging, interfacing, and network maintenance. PSTN connectivity to the core network enables mobile subscribers to call fixed network subscribers, and vice versa. In the past, PSTN networks were also closed networks because they were unconnected to other public networks.
The core network is also connected to the Internet. Internet connectivity allows the cellular network to provide innovative multimedia services such as weather reports, stock reports, sports information, chat, and electronic mail. Interworking with the Internet is possible using protocol gateways, federated databases, and multiprotocol mobility managers [2]. Interworking with the Internet has created a new generation of services called cross-network services. These are multivendor, multidomain services that use a combination of Internet-based data and data from the cellular network to provide a variety of services to the cellular subscriber. A sample cross-network service is the Email Based Call Forwarding Service (CFS), which uses Internet-based email data (in a mail server) to decide on the call-forward number (in a call-forward server) and delivers the call via the cellular network.
From a functional viewpoint, the core network may also be further divided into the circuit-switched (CS) domain, the packet-switched (PS) domain, and the IP Multimedia Subsystem (IMS). In the following, we further discuss the core network organization.
Core Network Organization
Cellular networks are organized as collections of interconnected network areas, where each network area covers a fixed geographical region (as shown in Figure 12.2). Every subscriber is affiliated with two networks: the home network and the visiting network.

Figure 12.2 Core network organization.
Every subscriber is permanently assigned to the home network, from which they can roam onto other visiting networks. The home network maintains the subscriber profile and current subscriber location. The visiting network is the network where the subscriber is currently roaming. It provides radio resources, mobility management, routing, and services for roaming subscribers. The visiting network provides service capabilities to the subscribers on behalf of the home environment [3].
The core network is facilitated by network servers (also called service nodes). Service nodes are composed of (1) a variety of data sources (such as cached read-only, updateable, and shared data sources) to store data such as subscriber profile and (2) service logic to perform functions such as computing data items, retrieving data items from data sources, and so on.
Service nodes can be of different types, with each type assigned specific functions. The major service node types in the circuit-switched domain include the Home Location Register (HLR), the Visitor Location Register (VLR), the Mobile Switching Center (MSC), and the Gateway Mobile Switching Center (GMSC) [4].
All subscribers are permanently assigned to a fixed HLR located in the home network. The HLR stores permanent subscriber profile data and relevant temporary data such as current subscriber location (pointer to VLR) of all subscribers assigned to it. Each network area is assigned a VLR. The VLR stores temporary data of subscribers currently roaming in its assigned area; this subscriber data is received from the HLR of the subscriber. Every VLR is always associated with an MSC. The MSC acts as an interface between the radio access network and the core network. It also handles circuit-switched services for subscribers currently roaming in its area. The GMSC is in charge of routing the call to the actual location of the mobile station. Specifically, the GMSC acts as interface between the fixed PSTN network and the cellular network. The radio access network comprises a transmitter, receiver, and speech transcoder called the base station (BS) [5].
Service nodes are geographically distributed and service the subscriber through collaborative functioning of various network components. Such collaborative functioning is possible due to the network relationships (called dependencies). A dependency means that a network component must rely on other network components to perform a function. For example, there is a dependency between service nodes to service subscribers. Such a dependency is made possible through signaling messages containing data items. Service nodes typically request other service nodes to perform specific operations by sending them signaling messages containing data items with predetermined values. On receiving signaling messages, service nodes realize the operations to perform based on values of data items received in signaling messages. Further, dependencies may exist between data items so that received data items may be used to derive other data items. Several application layer protocols are used for signaling messages. Examples of signaling message protocols include Mobile Application Part (MAP), ISDN User Part (ISUP), and Transaction Capabilities Application Part (TCAP) protocols.
Typically in the cellular network, to provide a specific service a preset group of signaling messages is exchanged between a preset group of service node types. The preset group of signaling messages indicates the operations to be performed at the various service nodes and is called a signal flow. In the following, we use the call delivery service [6] to illustrate a signal flow and show how the various geographically distributed service nodes function together.
Call Delivery Service
The call delivery service is a basic service in the circuit-switched domain. It is used to deliver incoming calls to any subscriber with a mobile device regardless of their location. The signal flow of the call delivery service is illustrated in Figure 12.3. The call delivery service signal flow comprises MAP messages SRI, SRI_ACK, PRN, and PRN_ACK; ISUP message IAM; and TCAP messages SIFIC, Page MS, and Page.

Figure 12.3 Signal flow in the call delivery service.
Figure 12.3 illustrates the exchange of signal messages between different network areas. It shows that when a subscriber makes a call using his mobile device, the call is sent in the form of a signaling message IAM to the nearest GMSC, which is in charge of routing calls and passing voice traffic between different networks. This signaling message IAM contains data items such as called number that denotes the mobile phone number of the subscriber receiving this call. The called number is used by the GMSC to locate the address of the HLR (home network) of the called party. The GMSC uses this address to send the signaling message SRI.
The SRI message is an intimation to the HLR of the arrival of an incoming call to a subscriber with called number as mobile phone number. It contains data items such as the called number and alerting pattern. The alerting pattern denotes the pattern (packet-switched data, short message service, or circuit-switched call) used to alert the subscriber receiving the call. The HLR uses the called number to retrieve from its database the current location (pointer to VLR) of the subscriber receiving the call. The HLR uses this subscriber location to send the VLR the message PRN. The PRN message is a request for call routing information (also called roaming number) from the VLR where the subscriber is currently roaming. The PRN message contains the called number, alerting pattern, and other subscriber call profile data items.
The VLR uses the called number to store the alerting pattern and subscriber call profile data items and assign the roaming number for routing the call. This roaming number data item is passed on to the HLR (in message PRN_ACK), which forwards it to the GMSC (in message SRI_ACK). The GMSC uses this roaming number to route the call (message IAM) to the MSC where the subscriber is currently roaming. On receipt of the message IAM, the MSC assigns the called number resources for the call and also requests the subscriber call profile data items, and alerting pattern for the called number (using message SIFIC) from the VLR, and receives the same in the Page MS message. The MSC uses the alerting pattern in the incoming call profile to derive the page type data item. The page type data item denotes the manner in which to alert the mobile station. It is used to page the mobile subscriber (using message Page). Thus subscribers receive incoming calls irrespective of their locations in the network.
If data item values are inaccurate, the network can misoperate and subscribers will be affected. Hence, accurate functioning of the network is greatly dependent on the integrity of data item values. Thus signal flows allow the various service nodes to function together, ensuring that the network services its subscribers effectively.
3. The State of the Art of Cellular Network Security
This part of the chapter presents the current state of the art of cellular network security. Because the security of the cellular network is the security of each aspect of the network, that is, radio access network, core network, Internet connection, and PSTN connection, we detail the security of each in detail.
Security in the Radio Access Network
The radio access network uses radio signals to connect the subscriber’s cellular device with the core wireline network. Hence it would seem that attacks on the radio access network could easily happen because anyone with a transmitter/receiver could capture these signals. This was very true in the case of early-generation cellular networks (first and second generations), where there were no guards against eavesdropping on conversations between the cellular device and BS; cloning of cellular devices to utilize the network resources without paying; and cloning BSs to entice users to camp at the cloned BS in an attack called a false base station attack, so that the target user provides secret information to the adversary.
In the current generation (third-generation) cellular network, all these attacks can be prevented because the network provides adequate security measures. Eavesdropping on signals between the cellular device and BS is not possible, because cipher keys are used to encrypt these signals. Likewise, replay attacks on radio signals are voided by the use of nonrepeated random values. Use of integrity keys on radio conversations voids the possibility of deletion and modification of conversations between cellular devices and BSs. By allowing the subscriber to authenticate the network, and vice versa, this generation voids the attacks due to cloned cellular devices and BSs. Finally, as the subscriber’s identity is kept confidential by only using a temporary subscriber identifier on the radio network, it is also possible to maintain subscriber location privacy [7].
However, the current generation still cannot prevent a denial-of-service attack from occurring if a large number of registration requests are sent via the radio access network (BS) to the visiting network (MSC). Such a DoS attack is possible because the MSC cannot realize that the registration requests are fake until it attempts to authenticate each request and the request fails. To authenticate each registration request, the MSC must fetch the authentication challenge material from the corresponding HLR. Because the MSC is busy fetching the authentication challenge material, it is kept busy and the genuine registration requests are lost [8]. Overall there is a great improvement in the radio network security in the current third-generation cellular network.
Security in Core Network
Though the current generation network has seen many security improvements in the radio access network, the security of the core network is not as improved. Core network security is the security at the service nodes and security on links (or wireline signaling message) between service nodes.
With respect to wireline signaling message security, of the many wireline signaling message protocols, protection is only provided for the Mobile Application Part (MAP) protocol. The MAP protocol is the cleartext application layer protocol that typically runs on the security-free SS7 protocol or the IP protocol. MAP is an essential protocol and it is primarily used for message exchange involving subscriber location management, authentication, and call handling. The reason that protection is provided for only the MAP protocol is that it carries authentication material and other subscriber-specific confidential data; therefore, its security was considered top priority and was standardized [9–11]. Though protection for other signaling message protocols was also considered important, its was left as an improvement for the next-generation network [12].
Security for the MAP protocol is provided in the form of the newly proposed protocol called Mobile Application Part Security (MAPSec) when MAP runs on the SS7 protocol stack, or Internet Protocol Security (IPSec) when MAP runs on the IP protocol.
Both MAPSec and IPSec, protect MAP messages on the link between service nodes by negotiating security associations. Security associations comprise keys, algorithms, protection profiles, and key lifetimes used to protect the MAP message. Both MAPSec and IPSec protect MAP messages by providing source service node authentication and message encryption to prevent eavesdropping, MAP corruption, and fabrication attacks.
It must be noted that though MAPSec and IPSec are deployed to protect individual MAP messages on the link between service nodes, signaling messages typically occur as a group in a signal flow, and hence signaling messages must be protected not only on the link but also in the intermediate service nodes. Also, the deployment of MAPSec and IPSec is optional; hence if any service provider chooses to omit MAPSec/IPSec’s deployment, the efforts of all other providers are wasted. Therefore, to completely protect MAP messages, MAPSec/IPSec must be used by every service provider.
With respect to wireline service nodes, while MAPSec/IPSec protects links between service nodes, there is no standardized method for protecting service nodes [13]. Remote and physical access to service nodes may be subject to operator’s security policy and hence could be exploited (insider or outsider) if the network operator is lax with security. Accordingly, the network suffers from the possibility of node impersonation, corruption of data sources, and service logic attacks. For example, unauthorized access to the HLR could deactivate customers or activate customers not seen by the building system. Similarly, unauthorized access to the MSC could cause outages for a large number of users in a given network area.
Corrupt data sources or service logic in service nodes have the added disadvantage of propagating this corruption to other service nodes in the network [14–16] via signaling messages. This fact was recently confirmed by a security evaluation of cellular networks [17] that showed the damage potential of a compromised service node to be much greater than the damage potential of compromised signaling messages. Therefore, it is of utmost importance to standardize a scheme for protecting service nodes in the interest of not only preventing node impersonation attacks but also preventing the corruption from propagating to other service nodes.
In brief, the current generation core network is lacking in security for all types of signaling messages, for MAP signaling messages in service nodes, and a standardized method for protecting service nodes. To protect all types of signaling message protocols and ensure that messages are secured not only on the link between service nodes but also on the intermediate service nodes (that is, secured end to end), and prevent service logic corruption from propagating to other service nodes, the End-to-End Security (EndSec) protocol was proposed [18].
Because signaling message security essentially depends on security of data item values contained in these messages, EndSec focuses on securing data items. EndSec requires every data item to be signed by its source service nodes using public key encryption. By requiring signatures, if data items are corrupt by compromised intermediate service nodes en route, the compromised status of the service node is revealed to the service nodes receiving the corrupt data items. Revealing the compromised status of service nodes prevents corruption from propagating to other service nodes, because service nodes are unlikely to accept corrupt data items from compromised service nodes.
EndSec also prevents misrouting and node impersonation attacks by requiring every service node in a signal flow to embed the PATH taken by the signal flow in every EndSec message. Finally, EndSec introduces several control messages to handle and correct the detected corruption. Note that EndSec is not a standardized protocol.
Security Implications of Internet Connectivity
Internet connectivity introduces the biggest threat to the security of the cellular network. This is because cheap PC-based equipment with Internet connectivity can now access gateways connecting to the core network. Therefore, any attack possible in the Internet can now filter into the core cellular network via these gateways. For example, Internet connectivity was the reason for the slammer worm to filter into the E-911 service in Bellevue, Washington, making it completely unresponsive [19]. Other attacks that can filter into the core network from the Internet include spamming and phishing of short messages [20].
We expect low-bandwidth DoS attacks to be the most damaging attacks brought on by Internet connectivity [21–23]. These attacks demonstrate that by sending just 240 short messages per second, it is possible to saturate the cellular network and cause the MSC in charge of the region to be flooded and lose legitimate short messages per second. Likewise, it shows that it is possible to cause a specific user to lose short messages by flooding that user with a large number of messages, causing a buffer overflow. Such DoS attacks are possible because the short message delivery time in the cellular network is much greater than the short message submission time using Internet sites [24].
Also, short messages and voices services use the same radio channel, so contention for these limited resources may still occur and cause a loss of voice service. To avoid loss of voice services due to contention, separation of voice and data services on the radio network has been suggested [16]. However, such separation requires major standardization and overhaul of the network and is therefore unlikely be implemented very soon. Other minor techniques such as queue management and resource provisioning have been suggested [25].
Though such solutions could reduce the impact of short message flooding, they cannot eliminate other types of low-bandwidth, DoS attacks such as attacks on connection setup and teardown of data services. The root cause for such DoS attacks from the Internet to the core network was identified as the difference in the design principles of these networks. Though the Internet makes no assumptions on the content of traffic and simply passes it on to the next node, the cellular network identifies the traffic content and provides a highly tailored service involving multiple service nodes for each type of traffic [26].
Until this gap is bridged, such attacks will continue, but bridging the gap itself is a major process because either the design of the cellular network must be changed to match the Internet design, or vice versa, which is unlikely to happen soon. Hence a temporary fix would be to secure the gateways connecting the Internet and core network. As a last note, Internet connectivity filters attacks not only into the core network, but also into the PSTN network. Hence PSTN gateways must also be guarded.
Security Implications of PSTN Connectivity
PSTN connectivity to the cellular network allows calls between the fixed and cellular networks. Though the PSTN was a closed network, the security-free SS7 protocol stack on which it is based was of no consequence. However, by connecting the PSTN to the core network that is in turn connected to the Internet, the largest open public network, the SS7-based PSTN network has “no security left” [27].
Because SS7 protocols are plaintext and have no authentication features, it is possible to introduce fake messages, eavesdrop, cause DoS by traffic overload, and incorrectly route signaling messages. Such introduction of SS7 messages into the PSTN network is very easily done using cheap PC-based equipment. Attacks in which calls for 800 and 900 numbers were rerouted to 911 servers so that legitimate calls were lost are documented [28]. Such attacks are more so possible due to the IP interface of the PSTN service nodes and Web-based control of these networks.
Because PSTN networks are to be outdated soon, there is no interest in updating these networks. So, they will remain “security free” until their usage is stopped [29].
So far, we have addressed the security and attacks on each aspect of the cellular network. But an attack that is common to all the aspects of the cellular network is the cascading attack. Next we detail the cascading attack and present vulnerability assessment techniques to identify the same.
4. Cellular Network Attack Taxonomy
In this part of the chapter, we present the cellular network specific attack taxonomy. This attack taxonomy is called the three-dimensional taxonomy because attacks are classified based on the following three dimensions: (1) adversary’s physical access to the network when the attack is launched; (2) type of attack launched; and (3) vulnerability exploited to launch the attack.
The three-dimensional attack taxonomy was motivated by the cellular network specific abstract model, which is an atomic model of cellular network service nodes. It enabled better study of interactions within the cellular network and aided in derivation of several insightful characteristics of attacks on the cellular network.
The abstract model not only led to the development of the three-dimensional attack taxonomy that has been instrumental in uncovering (1) cascading attacks, a type of attack in which the adversary targets a specific network location but attacks another location, which in turn propagates the attack to the target location, and (2) cross-infrastructure cyber attack, a new breed of attack in which the cellular network may be attacked from the Internet [30]. In this part of the chapter we further detail the three-dimensional attack taxonomy and cellular network abstract model.
Abstract Model
The abstract model dissects functionality of the cellular network to the basic atomic level, allowing it to systematically isolate and identify vulnerabilities. Such identification of vulnerabilities allows attack classification based on vulnerabilities, and isolation of network functionality aids in extraction of interactions between network components, thereby revealing new vulnerabilities and attack characteristics.
Because service nodes in the cellular network comprise sophisticated service logic that performs numerous network functions, the abstract model logically divides the service logic into basic atomic units, called agents (represented by the elliptical shape in Figure 12.4). Each agent performs a single function. Service nodes also manage data, so the abstract model also logically divides data sources into data units specific to the agents they support. The abstract model also divides the data sources into permanent (represented by the rectangular shape in Figure 12.4) or cached (represented by the triangular shape in Figure 12.4) from other service nodes.
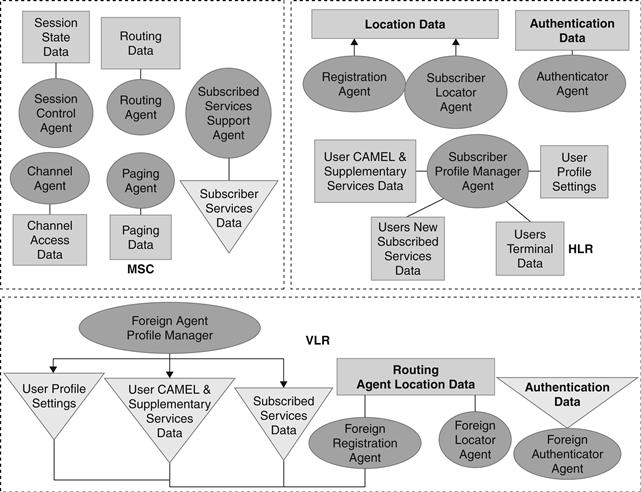
Figure 12.4 Abstract model of circuit-switched service nodes.
The abstract model developed for the CS domain is illustrated in Figure 12.4. It shows agents, permanent, and cached data sources for the CS service nodes. For example, the subscriber locator agent in the HLR is the agent that tracks the subscriber location information. It receives and responds to location requests during an incoming call and stores a subscriber’s location every time they move. This location information is stored in the location data source. Readers interested in further details may refer to [31,32].
Abstract Model Findings
The abstract model had lead to many interesting findings. We outline them as follows:
Interactions
To study the network interactions, service nodes in signal flows (e.g. call delivery service) were replaced by their corresponding abstract model agents and data sources. Such an abstract-model–based signal flow based on the call delivery service is shown in Figure 12.5.
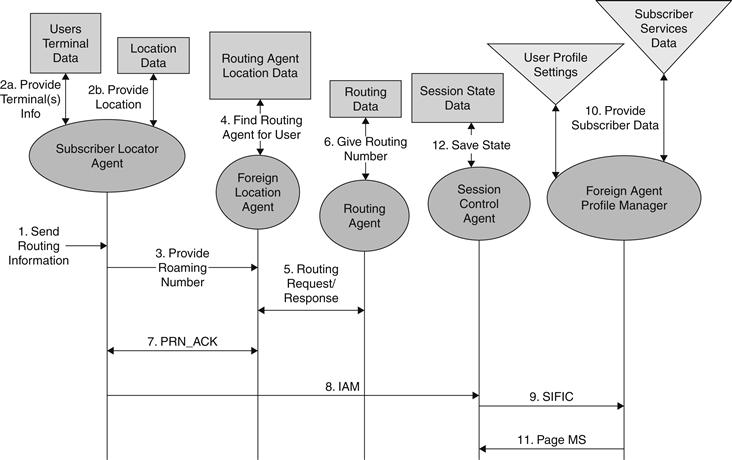
Figure 12.5 Abstract model-based signal flow for the call delivery service.
In studying the abstract model signal flow, it was observed that interactions happen (1) between agents typically using procedure calls containing data items; (2) between agents and data sources using queries containing data items; and (3) between agents belonging to different service nodes using signaling messages containing data items.
The common behavior in all these interactions is that they typically involve data items whose values are set or modified in agents or data source, or it involves data items passed between agents, data sources, or agents and data sources. Hence, the value of a data item not only can be corrupt in an agent or data source, it can also be easily passed on to other agents, resulting in propagation of corruption. This propagation of corruption is called the cascading effect, and attacks that exhibit this effect are called cascading attacks. In the following, we present a sample of the cascading attack.
Sample Cascading Attack
In this sample cascading attack, cascading due to corrupt data items and ultimately their service disruption are illustrated in Figure 12.6. Consider the call delivery service explained previously. Here the adversary may corrupt the roaming number data item (used to route the call) in the VLR. This corrupt roaming number is passed on in message PRN_ACK to the HLR, which in turn passes this information to the GMSC. The GMSC uses the incorrect roaming number to route the call to the incorrect MSCB, instead of the correct MSCA. This results in the caller losing the call or receiving a wrong-number call. Thus corruption cascades and results in service disruption.

Figure 12.6 Sample cascading attacks in the call delivery service.
The type of corruption that can cascade is system-acceptable incorrect value corruption, a type of corruption in which corrupt values taken on system-acceptable values, albeit incorrect values. Such a corruption can cause the roaming number to be incorrect but a system-acceptable value.
Note that it is easy to cause such system-acceptable incorrect value corruption due to the availability of Web sites that refer to proprietary working manuals of service nodes such as the VLR [33,34]. Such command insertion attacks have become highly commonplace, the most infamous being the telephone tapping of the Greek government and top-ranking civil servants [35].
Cross-Infrastructure Cyber Cascading Attacks
When cascading attacks cross into the cellular networks from the Internet through cross-network services, they’re called cross-infrastructure cyber cascading attacks. This attack is illustrated on the CFS in Figure 12.7.

Figure 12.7 Cross-infrastructure cyber cascading attacks on call-forward service.
As the CFS forwards calls based on the emails received, corruption is shown to propagate from the mail server to a call-forward (CF) server and finally to the MSC. In the attack, using any standard mail server vulnerabilities, the adversary may compromise the mail server and corrupt the email data source by deleting emails from people the victim is expecting to call. The CF server receives and caches incorrect email from the mail server.
When calls arrive for the subscriber, the call-forwarding service is triggered, and the MSC queries the CF server on how to forward the call. The CF server checks its incorrect email cache, and because there are no emails from the caller, it responds to the MSC to forward the call to the victim’s voicemail when in reality the call should have been forwarded to the cellular device. Thus the effect of the attack on the mail server propagates to the cellular network service node. This is a classic example of a cross-infrastructure cyber cascading attack, whereby the adversary gains access to the cross-network server, and attacks by modifying data in the data source of the cross-network server.
Note that it has become highly simplified to launch such attacks due to easy accessibility to the Internet and subscriber preference for Internet-based cross-network services.
Isolating Vulnerabilities
From the abstract model, the major network components that are vulnerable to adversaries are (1) data sources; (2) agents (more generally called service logic); and (3) signaling messages. By exploiting each of these vulnerabilities, data items that are crucial to the correct working of the network can be corrupted, leading to ultimate service disruption through cascading effects.
In addition, the effect of corrupt signaling messages is different from the effect of corrupt data sources. By corrupting data items in a data source of a service node, all the subscribers attached to this service node may be affected. However, by corrupting a signaling message, only the subscribers (such as the caller and called party in case of call delivery service) associated with the message are affected. Likewise, corrupting the agent in the service node can affect all subscribers using the agent in the service node. Hence, in the three-dimensional taxonomy, a vulnerability exploited is considered as an attack dimension, since the effect on each vulnerability is different.
Likewise, the adversary’s physical access to the network also affects how the vulnerability is exploited and how the attack cascades. For example, consider the case when a subscriber has access to the air interface. The adversary can only affect messages on the air interface. Similarly, if the adversary has access to a service node, the data sources and service logic may be corrupted. Hence, in the three-dimensional taxonomy, the physical access is considered a category as it affects how the vulnerability is exploited and its ultimate effect on the subscriber.
Finally, the way the adversary chooses to launch an attack ultimately affects the service in a different way. Consider a passive attack such as interception. Here the service is not affected, but it can have a later effect on the subscriber, such as identity theft or loss of privacy. An active attack such as interruption can cause complete service disruption. Hence, in the three-dimensional taxonomy, the attack means are considered a category due the ultimate effect on service.
In the next part of the chapter, we detail the cellular network specific three-dimensional taxonomy and the way the previously mentioned dimensions are incorporated.
Three-Dimensional Attack Taxonomy
The three dimensions in the taxonomy include Dimension I: Physical Access to the Network, Dimension II: Attack Categories, and Dimension III: Vulnerability Exploited. In the following, we outline each dimension.
Dimension I: Physical Access to the Network
In this dimension, attacks are classified based on the adversary’s level of physical access to the cellular network. Dimension I may be further classified into single infrastructure attacks (Level I–III) and cross-infrastructure cyber attacks (Level IV–V):
Level I: Access to air interface with physical device. Here the adversary launches attacks via access to the radio access network using standard inexpensive “off-the-shelf” equipment [36]. Attacks include false base station attacks, eavesdropping, and man-in-the-middle attacks and correspond to attacks previously mentioned.
Level II: Access to links connecting core service nodes. Here the adversary has access to links connecting to core service nodes. Attacks include disrupting normal transmission of signaling messages and correspond to message corruption attacks previously mentioned.
Level III: Access core service nodes. In this case, the adversary could be an insider who managed to gain physical access to core service nodes. Attacks include editing the service logic or modifying data sources, such as subscriber data (profile, security and services) stored in the service node and corresponding to corrupt service logic, data source, and node impersonation attacks previously mentioned.
Level IV: Access to links connecting the Internet and the core network service nodes. This is a cross-infrastructure cyber attack. Here the adversary has access to links connecting the core network and Internet service nodes. Attacks include editing and deleting signaling messages between the two networks. This level of attack is easier to achieve than Level II.
Level V: Access to Internet servers or cross-network servers: This is a cross-infrastructure cyber attack. Here the adversary can cause damage by editing the service logic or modifying subscriber data (profile, security and services) stored in the cross-network servers. Such an attack was previously outlined earlier in the chapter. This level of attack is easier to achieve than Level III.
Dimension II: Attack Type
In this dimension, attacks are classified based on the type of attack. The attack categories are based on Stallings [37]:
Interception. The adversary intercepts signaling messages on a cable (Level II) but does not modify or delete them. This is a passive attack. This affects the privacy of the subscriber and the network operator. The adversary may use the data obtained from interception to analyze traffic and eliminate the competition provided by the network operator.
Fabrication or replay. In this case, the adversary inserts spurious messages, data, or service logic into the system, depending on the level of physical access. For example, in a Level II, the adversary inserts fake signaling messages, and in a Level III, the adversary inserts fake service logic or fake subscriber data into this system.
Modification of resources. Here the adversary modifies data, messages, or service logic. For example, in a Level II, the adversary modifies signaling messages on the link, and in a Level III, the adversary modifies service logic or data.
Denial of service. In this case, the adversary takes actions to overload the network results in legitimate subscribers not receiving service.
Interruption. Here the adversary causes an interruption by destroying data, messages, or service logic.
Dimension III: Vulnerability Exploited
In this dimension, attacks are classified based on the vulnerability exploited to cause the attack. Vulnerabilities exploited are explained as follows:
Data. The adversary attacks the data stored in the system. Damage is inflicted by modifying, inserting, and deleting the data stored in the system.
Messages. The adversary adds, modifies, deletes, or replays signaling messages.
Service logic. Here the adversary inflicts damage by attacking the service logic running in the various cellular core network service nodes.
Attack classification. In classifying attacks, we can group them according to Case 1: Dimension I versus Dimension II, and Case 2: Dimension II versus Dimension III. Note that the Dimension I versus Dimension III case can be transitively inferred from Case 1 and Case 2.
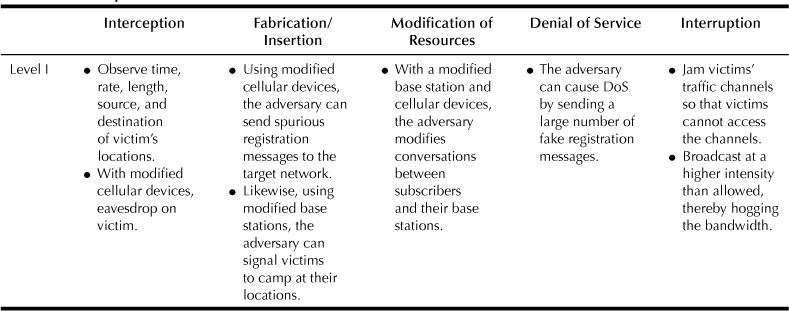
Table 12.1 shows a sample tabulation of Level 1 attacks grouped in Case 1. For example, with Level 1 access an adversary causes interception attacks by observing traffic and eavesdropping. Likewise, fabrication attacks due to Level I include sending spurious registration messages. Modification of resources due to Level 1 includes modifying conversations in the radio access network. DoS due to Level 1 occurs when a large number of fake registration messages are sent to keep the network busy so as to not provide service to legitimate subscribers. Finally, interruption attacks due to Level 1 occur when adversaries jam the radio access channel so that legitimate subscribers cannot access the network. For further details on attack categories, refer to [38].
Table 12.1
Sample Case 1 Classification
5. Cellular Network Vulnerability Analysis
Regardless of how attacks are launched, if attack actions cause a system-acceptable incorrect value corruption, the corruption propagates, leading to many unexpected cascading effects. To detect remote cascading effects and identify the origin of cascading attacks, cellular network vulnerability assessment tools were developed.
These tools, the Cellular Network Vulnerability Assessment Toolkit (CAT) and the advanced Cellular Network Vulnerability Assessment Toolkit (aCAT) [39,40] allow users to input the data item that might be corrupted and output an attack graph. The CAT attack graph not only shows the network location and the network service where the corruption might originate, it also shows the various messages and service nodes through which the corruption propagates.
An attack graph is a diagrammatic representation of an attack on a real system. It shows various ways an adversary can break into a system or cause corruption and the various ways in which the corruption may propagate within the system. Attack graphs are typically produced manually by red teams and used by systems administrators for protection. CAT and aCAT attack graphs allow users to trace the effect of an attack through the network and determine its side effects, thereby making them the ultimate service disruption.
The cellular network is at the nascent stage of development with respect to security, so it is necessary to evaluate security protocols before deploying them. Hence, aCAT can be extended with security protocol evaluation capabilities into a tool [41] called Cellular Network Vulnerability Assessment Toolkit for evaluation (eCAT). eCAT allows users to quantify the benefits of security solutions by removing attack effects from attack graphs based on the defenses provided. One major advantage of this approach is that solutions may be evaluated before expensive development and deployment.
It must be noted that developing such tools—CAT, aCAT, and eCAT—presented many challenges: (1) cellular networks are extremely complex systems; they comprise several types of service nodes and control protocols, contain hundreds of data elements, and support hundreds of services; hence developing such toolkits requires in-depth working knowledge of these systems; and (2) every deployment of the cellular network comprises a different physical configuration; toolkits must be immune to the diversity in physical configuration; and finally (3) attacks cascade in the network due to regular network activity as a result of dependencies; toolkits must be able to track the way that corruption cascades due to network dependencies.
The challenge of in-depth cellular network knowledge was overcome by incorporating the toolkits with cellular network specifications defined by the Third Generation Partnership Project (3GPP) and is available at no charge [42]. The 3GPP is a telecommunications standards body formed to produce, maintain, and develop globally applicable “technical specifications and technical reports” for a third-generation mobile system based on evolved GSM core networks and the radio access technologies that they support [43].
Usage of specifications allows handling of the diversity of physical configuration, as they detail the functional behavior and not the implementation structure of the cellular network. Specifications are written using simple flow-like diagrams called the Specification and Description Language (SDL) [44], and are referred to as SDL specifications. Equipment and service providers use these SDL specifications as the basis for their service implementations.
Corruption propagation is tracked by incorporating the toolkits with novel dependency and propagation models to trace the propagation of corruption. Finally, Boolean properties are superimposed on the propagation model to capture the impact of security solutions.
CAT is the first version of the toolkit developed for cellular network vulnerability assessment. CAT works by taking user input of seeds (data items directly corrupted by the adversary and the cascading effect of which leads to a goal) and goals (data parameters that are derived incorrectly due to the direct corruption of seeds by the adversary) and uses SDL specification to identify cascading attacks. However, SDL is limited in its expression of relationships and inexplicit in its assumptions and hence cannot capture all the dependencies; therefore CAT misses several cascading attacks.
To detect a complete set of cascading effects, CAT was enhanced with new features, to aCAT. The new features added to aCAT include (1) a network dependency model that explicitly specifies the exact dependencies in the network; (2) infection propagation rules that identify the reasons that cause corruption to cascade; and (3) a small amount of expert knowledge. The network dependency model and infection propagation rules may be applied to SDL specifications and help alleviate their limited expression capability. The expert knowledge helps capture the inexplicit assumptions made by SDL.
In applying these features, aCAT captures all those dependencies that were previously unknown to CAT, and thereby aCAT was able to detect a complete set of cascading effects. Through extensive testing of aCAT, several interesting attacks were found and the areas where SDL is lacking was identified.
To enable evaluation of new security protocols, aCAT was extended to eCAT. eCAT uses Boolean probabilities in attack graphs to detect whether a given security protocol can eliminate a certain cascading effect. Given a security protocol, eCAT can measure effective coverage, identify the types of required security mechanisms to protect the network, and identify the most vulnerable network areas. eCAT was also used to evaluate MAPSec, the new standardized cellular network security protocol. Results from MAPSec’s evaluation gave insights into MAPSec’s performance and the network’s vulnerabilities. In the following, we detail each toolkit.
Cellular Network Vulnerability Assessment Toolkit (CAT)
In this part of the chapter, we present an overview of CAT and its many features. CAT is implemented using the Java programming language. It is made up of a number of subsystems (as shown in Figure 12.8). The knowledge base contains the cellular network knowledge obtained from SDL specifications. SDL specifications contain simple flowchart-like diagrams. The flowcharts are converted into data in the knowledge base. The integrated data structure is similar to that of the knowledge base; it holds intermediate attack graph results.

Figure 12.8 Architecture of CAT.
The GUI subsystem takes user input in the form of seeds and goals. The analysis engine contains algorithms (forward and midpoint) incorporated with cascading effect detection rules. It explores the possibility of the user input seed leading to the cascading effect of the user input goal, using the knowledge base, and outputs the cascading attack in the form of attack graphs.
Using these attack graphs, realistic attack scenarios may be derived. Attack scenarios explain the effect of the attack on the subscriber in a realistic setting. Each attack graph may have multiple interpretations and give rise to multiple scenarios. Each scenario gives a different perspective on how the attack may affect the subscriber:
• Cascading effect detection rules. These rules were defined to extract cascading effects from the SDL specifications contained in the knowledge base. They are incorporated into the algorithms in the analysis engine. These rules define what constitutes propagation of corruption from a signaling message to a block, and vice versa, and propagation of corruption within a service node. For example, when a service node receives a signaling message with a corrupt data item and stores the data item, it constitutes propagation of corruption from a signaling message to a block. Note that these rules are high level.
• Attack graph. The CAT attack graph may be defined as a state transition showing the paths through a system, starting with the conditions of the attack, followed by attack action, and ending with its cascading effects.
In Figure 12.9, we present the CAT attack graph output, which was built using user input of ISDN Bearer Capability as a seed and Bearer Service as goal. The attack graph constitutes nodes and edges. Nodes represent states in the network with respect to the attack, and edges represent network state transitions. For description purposes, each node has been given a node label followed by an alphabet, and the attack graph has been divided into layers.

Figure 12.9 CAT attack graph output.
Nodes may be broadly classified as conditions, actions, and goals, with the conditions of the attack occurring at the lowest layer and the final cascading effect at the highest layer. In the following, we detail each node type:
• Condition nodes. Nodes at the lowest layer typically correspond to the conditions that must exist for the attack to occur. These condition nodes directly follow from the taxonomy. They are an adversary’s physical access, target service node, and vulnerability exploited. For example, the adversary has access to links connecting to the GMSC service node, that is, Level II physical access; this is represented as Node A in the attack graph. Likewise, the adversary corrupts data item ISDN Bearer Capability in the IAM message arriving at the GMSC. Hence the target of the attack is the GMSC and is represented by Node B. Similarly, the adversary exploits vulnerabilities in a message (IAM), and this is represented by Node D in the attack graph.
The CAT attack graphs show all the possible conditions for an attack to happen, that is, we see not only the corruption due to the seed ISDN Bearer Capability in signaling message IAM arriving at the GMSC but also other possibilities such as the corruption of goal Bearer Service in signaling message SIFIC, represented by Node M.
• Action nodes. Nodes at higher layers are actions that typically correspond to effects of the attack propagating through the network. Effects typically include propagation of corruption between service nodes, such as from MSC to VLR (Node N), propagation of corruption within service nodes such as ISDN Bearer Capability corrupting Bearer Service (Node L), and so on. Actions may further be classified as adversary actions, normal network operations, or normal subscriber activities. Adversary actions include insertion, corruption, or deletion of data, signaling messages, or service logic represented by Node E. Normal network operations include sending (Node N) and receiving signaling messages (Node E). Subscriber activity may include updating personal data or initiating service.
• Goal nodes. Goal nodes typically occur at the highest layer of the attack graph. They indicate corruption of the goal items due to the direct corruption of seeds by the adversary (Node A).
• Edges. In our graph, edges represent network transitions due to both normal network actions and adversary actions. Edges help show the global network view of adversary action. This is the uniqueness of our attack graph. Transitions due to adversary action are indicated by an edge marked by the letter A (edges connecting Layer 0 and Layer 1). By inclusion of normal network transitions in addition to the transitions caused by the adversary, our attack graph shows not only the adversary’s activity but also the global network view of the adversary’s action. This is a unique feature of the attack graph.
• Trees. In the graph, trees are distinguished by the tree numbers assigned to its nodes. For example, all the nodes marked with number 2 belong to Tree 2 of the graph. Some nodes in the graph belong to multiple trees. Tree numbers are used to distinguish between AND and OR nodes in the graph. Nodes at a particular layer with the same tree number(s) are AND nodes. For example, at Layer 4, Nodes H, I, J, and K are AND nodes; they all must occur for Node M at Layer 5 to occur. Multiple tree numbers on a node are called OR nodes. The OR node may be arrived at using alternate ways. For example, Node O at Layer 6 is an OR node, the network state indicated by Node O may be arrived at from Node M or Node N.
Each attack tree shows the attack effects due to corruption of a seed at a specific network location (such as signaling message or process in a block). For example, Tree 1 shows the attack due to the corruption of the seed Bearer Service at the VLR. Tree 2 shows the propagation of the seed ISDN Bearer Capability in the signaling message IAM. These trees show that the vulnerability of the cellular network is not limited to one place but can be realized due to the corruption of data in many network locations.
In constructing the attack graph, CAT assumes that an adversary has all the necessary conditions for launching the attack. The CAT attack graph format is well suited to cellular networks because data propagates through the network in various forms during the normal operation of a network; thus an attack that corrupts a data item manifests itself as the corruption of a different data item in a different part of the network after some network operations take place.
• Attack scenario derivation. The CAT attack graph is in cellular network semantics, and realistic attack scenarios may be derived to understand the implications of the attack graph. Here we detail the principles involved in the derivation of realistic attack scenarios:
1. End-user effect. Goal node(s) are used to infer the end effect of the attack on the subscriber. According to the goal node in Figure 12.9, the SIFIC message to the VLR has incorrect goal item Bearer Service. The SIFIC message is used to inform the VLR the calling party’s preferences such as voice channel requirements and request the VLR to set up the call based on the calling party and receiving party preferences.
If the calling party’s preferences (such as Bearer Service) are incorrect, the call setup by the VLR is incompatible with the calling party, and the communication is ineffective (garbled speech). From the goal node, it can be inferred that Alice, the receiver of the call, is unable to communicate effectively with Bob, the caller, because Alice can only hear garbled speech from Bob’s side.
2. Origin of attack. Nodes at Layer 0 indicate the origin of the attack, and hence the location of the attack may be inferred. The speech attack may originate at the signaling messages IAM, or the VLR service node.
3. Attack propagation and side effects. Nodes at all other layers show the propagation of corruption across the various service nodes in the network. From other layers in Figure 12.9, it can be inferred that the seed is the ISDN Bearer Capability and the attack spreads from the MSC to the VLR.
• Attack Scenario: Using these guidelines, an attack scenario may be derived as follows. Trudy, the adversary, corrupts the ISDN Bearer Capability of Bob, the victim, at the IAM message arriving at the GMSC. The GMSC propagates this corruption to the MSC, which computes, and hence corrupts, the Bearer Service. The corrupt Bearer Service is passed on to the VLR, which sets up the call between Bob, the caller, and Alice, the receiver. Bob and Alice cannot communicate effectively because Alice is unable to understand Bob.
Though CAT has detected several cascading attacks, its output to a great extent depends on SDL’s ability to capture data dependencies. SDL is limited in its expression capability in the sense that it does not always accurately capture the relationship between data items, and in many cases, SDL does even specify the relationship. Without these details CAT may miss some cascading effects due to loss of data relationships. CAT’s output to a minor extent also depends on user input in the sense that to accurately capture all the cascading effect of a seed, the user’s input must comprise all the seeds that can occur in the cascading effect; otherwise the exact cascading effect is not captured. To alleviate CAT’s inadequacies, aCAT was developed.
Advanced Cellular Network Vulnerability Assessment Toolkit (aCAT)
In this part of the chapter, we present aCAT, an extension of CAT with enhanced features. These enhanced features include (1) incorporating expert knowledge to compensate for the lacking caused by SDL’s inexplicit assumptions; expert knowledge added to the knowledge base with the SDL specifications; (2) defining a network dependency model that accurately captures the dependencies in the cellular network; the network dependency model is used to format the data in knowledge base, thereby clarifying the nature of the network dependency; and (3) defining infection propagation rules that define fine-grained rules to detect cascading attacks; these infection propagation rules are incorporated into the analysis engine, which comprises the forward, reverse, and combinatory algorithms. aCAT is also improved in terms of its user input requirements. It requires as input either seeds or goals, whereas CAT required both seeds and goals.
In principle, cascading attacks are the result of propagation of corruption between network components (such as signaling messages, caches, local variables, and service logic) due to dependencies that exist between these network components. Hence, to uncover these attacks, the network dependency model and infection propagation (IP) rules were defined. In the following, we detail the network dependency model and infection propagation model using Figure 12.10.
• Network dependency model. The network dependency model accurately defines fine-grained dependencies between the various network components. Given that service nodes comprise agents and data sources (from the abstract model), the dependencies are defined as follows. In interagent dependency, agents communicate with each other using agent invocations (as shown by 6 in Figure 12.10) containing data items. Thus, agents are related to each other through data items. Likewise, in agent to data source dependency, agents communicate with data sources using Read and Write operations containing data items. Therefore, agents and data items are related to each other through data items. Within agents, derivative dependencies define relationships between data items. Here data items are used as input to derive data items using derivation operations such as AND, OR operations. Therefore, data items are related to each other through derivation operation. For further detail on the network dependency model, refer to [45].
• Infection propagation (IP) rules. These are fine-grained rules to detect cascading effects. They are incorporated into the algorithms in the analysis engine. An example of the IP rule is that an output data item in the AND dependency is corrupt only if both the input data items are corrupt (as shown by 9 in Figure 12.10). Likewise, an output data item in the OR dependency is corrupt if a single input data item is corrupt (as shown by 8 in Figure 12.10). Similarly, corruption propagates between agents when the data item used to invoke the agent is corrupt, and the same data item is used as an input in the derivative dependency whose output may be corrupt (as shown by 6, 8 in Figure 12.10). Accordingly, corruption propagates from an agent to a data source if the data item written to the data source is corrupt (as shown by 4 in Figure 12.10). Finally, corruption propagates between service nodes if a data item used in the signaling message between the service nodes is corrupt, and the corrupt data item is used to derive corrupt output items or the corrupt data item is stored in the data source (as shown by 1, 3 or 1, 4 in Figure 12.10) [46].

Figure 12.10 Network dependency model.
With such a fine-grained dependency model and infection propagation rules, aCAT was very successful in identifying cascading attacks in several of the key services offered by the cellular network, and it was found that aCAT can indeed identify a better set of cascading effects in comparison to CAT. aCAT has also detected several interesting and unforeseen cascading attacks that are subtle and difficult to identify by other means. These newly identified cascading attacks include the alerting attack, power-off/power-on attack, mixed identity attack, call redirection attack, and missed calls attack.
• Alerting attack. In the following we detail aCAT’s output, a cascading attack called the alerting attack, shown in Figure 12.11. From goal nodes (Node A at Level 5, and Node C at Level 4) in the alerting attack, it can be inferred that the Page message has incorrect data item page type. The Page message is used to inform subscribers of the arrival of incoming calls, and “page type” indicates the type of call. “Page type” must be compatible with the subscriber’s mobile station or else the subscriber is not alerted. From the goal node it may be inferred that Alice, a subscriber of the system, is not alerted on the arrival of an incoming call and hence does not receive incoming calls. This attack is subtle to detect because network administrators find that the network processes the incoming call correctly and that the subscriber is alerted correctly. They might not find that this alerting pattern is incompatible with the mobile station itself.

Figure 12.11 Attack graph for alerting attack.
Also, nodes at Level 0 indicate the origin of the attack as signaling messages SRI, PRN, the service nodes VLR, or the HLR. From the other levels it may be inferred that the seed is the alerting pattern that the adversary corrupts in the SRI message and the attack spreads from the HLR to the VLR and from the VLR to the MSC. For more details on these attacks, refer to [47].
Cellular Network Vulnerability Assessment Toolkit for evaluation (eCAT)
In this part of the chapter, we present eCAT an extension to aCAT. eCAT was developed to evaluate new security protocols before their deployment. Though the design goals and threat model of these security protocols are common knowledge, eCAT was designed to find (1) the effective protection coverage of these security protocols in terms of percentage of attacks prevented; (2) the other kinds of security schemes required to tackle the attacks that can evade the security protocol under observation; and (3) the most vulnerable network areas (also called hotspots) [48].
eCAT computes security protocol coverage using attack graphs generated by aCAT and Boolean probabilities in a process called attack graph marking and quantifies the coverage using coverage measurement formulas (CMF). Attack graph marking also identifies network hotspots and exposes if the security protocol being evaluated protects these hotspots. eCAT was also used to evaluate MAPSec, as it is a relatively new protocol, and evaluation results would aid network operators.
• Boolean probabilities. Boolean probabilities are used in attack graphs to distinguish between nodes eliminated (denoted by 0, or shaded node in attack graph) and nodes existing (denoted by 1, or unshaded node in attack graph) due to the security protocol under evaluation. By computing Boolean probabilities for each node in the attack graph, eCAT can extract the attack effects that may be eliminated by the security protocol under evaluation.
• Attack graph marking. To mark attack graphs, user input of Boolean probabilities must be provided for Layer 0 nodes. For example, if the security protocol under evaluation is MAPSec, then because MAPSec provides security on links between nodes, it eliminates Level 2 physical access. For example, consider the attack graph generated by eCAT shown in Figure 12.12. Here, Node 5 is set to 0, while all other nodes are set to 1.
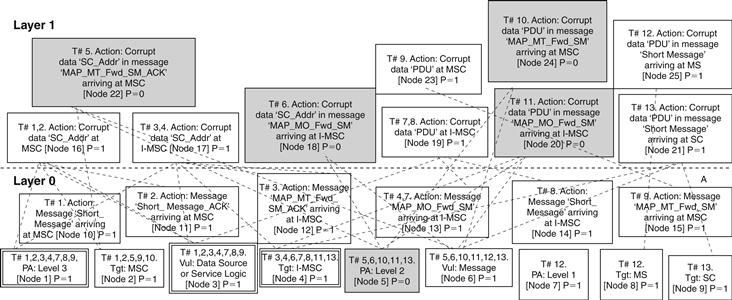
Figure 12.12 Fragment of a marked attack graph generated by eCAT.
eCAT uses the input from Layer 0 nodes to compute the Boolean probabilities for the rest of the nodes starting from Layer 1 and moving upward. For example, the Boolean probability of the AND node (Node 18) is the product of all the nodes in the previous layer with the same tree number. Because Node 5 has the same tree number as Node 18, and Node 5’s Boolean probability is 0, Node 18’s Boolean probability is also 0. This process of marking attack graphs is continued until Boolean probability of all the nodes is computed till the topmost layer.
• Hotspots. Graph marking also marks the network hotspots in the attack graph. With respect to the attack graph, hotspots are the Layer 0 nodes with the highest tree number count. For example in Figure 12.12, Node 3 and Node 4 are the hotspots. A high tree number count indicates an increased attractiveness of the network location to adversaries. This is because by breaking into the network location indicated by the hotspot node, the adversary has a higher likelihood of success and can cause the greatest amount of damage.
Extensive testing of eCAT on several of the network services using MAPSec has revealed hotspots to be “Data Sources and Service Logic.” This is because a corrupt data source or service logic may be used by many different services and hence cause many varied cascading effects, spawning a large number of attacks (indicated by multiple trees in attack graphs). Thus attacks that occur due to exploiting service logic and data source vulnerabilities constitute a major portion of the networkwide vulnerabilities and so a major problem. In other words, by exploiting service logic and data sources, the likelihood of attack success is very high. Therefore data source and service logic protection mechanisms must be deployed. It must be noted that MAPSec protects neither service logic nor data sources; rather, it protects MAP messages.
• Coverage measurement formulas. The CMF comprises the following set of three formulas to capture the coverage of security protocols: (1) effective coverage, to capture the average effective number of attacks eliminated by the security protocol; the higher the value of Effective Coverage the greater the protection the security protocol; (2) deployment coverage, to capture the coverage of protocol deployments; and (3) attack coverage, to capture the attack coverage provided by the security protocol; the higher this value, the greater is the security solution’s efficacy in eliminating a large number of attacks on the network.
Extensive use of CMF on several of the network services has revealed that MAPSec has an average networkwide attack coverage of 33%. This may be attributed to the fact that message corruption has a low spawning effect. Typically a single message corruption causes a single attack, since messages are typically used by a single service. Hence MAPSec is a solution to a small portion of the total network vulnerabilities.
Finally, in evaluating MAPSec using eCAT, it was observed that though MAPSec is 100% effective in preventing MAP message attacks, it cannot prevent a successfully launched attack from cascading. For MAPSec to be truly successful, every leg of the MAP message transport must be secured using MAPSec. However, the overhead for deploying MAPSec can be high, in terms of both processing load and monetary investment. Also, as MAP messages travel through third-party networks en route to their destinations, the risk level of attacks without MAPSec is very high. Hence, MAPSec is vital to protect MAP messages.
In conclusion, because MAPSec can protect against only 33% of attacks, it alone is insufficient to protect the network. A complete protection scheme for the network must include data source and service logic protection.
6. Discussion
Next to the Internet, the cellular network is the most highly used communication network. It is also the most vulnerable, with inadequate security measures making it a most attractive target to adversaries that want to cause communication outages during emergencies. As the cellular network is moving in the direction of the Internet, becoming an amalgamation of several types of diverse networks, more attention must be paid to securing these networks. A push from government agencies requiring mandatory security standards for operating cellular networks would be just the momentum needed to securing these networks.
Of all the attacks discussed in this chapter, cascading attacks have the most potential to stealthily cause major network misoperation. At present there is no standardized scheme to protect from such attacks. EndSec is a good solution for protecting from cascading attacks, since it requires every data item to be signed by the source service node. Because service nodes are unlikely to corrupt data items and they are to be accounted for by their signatures, the possibility of cascading attacks is greatly reduced. EndSec has the added advantage of providing end-to-end security for all types of signaling messages. Hence, standardizing EndSec and mandating its deployment would be a good step toward securing the network.
Both Internet and PSTN connectivity are the open gateways that adversaries can use to gain access and attack the network. Because the PSTN’s security is not going to be improved, at least its gateway to the core network must be adequately secured. Likewise, since neither the Internet’s design nor security will be changed to suit the cellular network, at least its gateways to the core network must be adequately secured.
Finally, because the cellular network is an amalgamation of many diverse networks, it has too many vulnerable points. Hence, the future design of the network must be planned to reduce the number of vulnerable network points and reduce the number of service nodes that participate in servicing the subscriber, thereby reducing the number of points from which an adversary may attack.
References
1. 3GPP, architectural requirements, Technical Standard 3G TS 23.221 V6.3.0, 3G Partnership Project, May 2004.
2. K. Murakami, O. Haase, J. Shin, T. F. LaPorta, Mobility management alternatives for migration to mobile internet session-based services, IEEE Journal on Selected Areas in Communications (J-SAC), special issue on Mobile Internet, 22 (June 2004) 834–848.
3. 3GPP, 3G security, Security threats and requirements, Technical Standard 3G TS 21.133 V3.1.0, 3G Partnership Project, December 1999.
4. 3GPP, network architecture, Technical Standard 3G TS 23.002 V3.3.0, 3G Partnership Project, May 2000.
5. Eberspacher V. GSM Switching, Services and Protocols. John Wiley & Sons 1999.
6. 3GPP, Basic call handling - technical realization, Technical Standard 3GPP TS 23.018 V3.4.0, 3G Partnership Project, April 1999.
7. 3GPP, A guide to 3rd generation security, Technical Standard 3GPP TR 33.900 V1.2.0, 3G Partnership Project, January 2001.
8. 3GPP, A guide to 3rd generation security, Technical Standard 3GPP TR 33.900 V1.2.0, 3G Partnership Project, January 2001.
9. B. Chatras, C. Vernhes, Mobile application part design principles, in: Proceedings of XIII International Switching Symposium, vol. 1, June 1990, pp. 35–42.
10. J.A. Audestad, The mobile application part (map) of gsm, technical report, Telektronikk 3.2004, Telektronikk, March 2004.
11. 3GPP, Mobile Application part (MAP) specification, Technical Standard 3GPP TS 29.002 V3.4.0, 3G Partnership Project, April 1999.
12. Boman K, Horn G, Howard P, Niemi V. Umts security. Electronics Communications Engineering Journal. October 2002;14(5):191–204 Special issue security for mobility.
13. 3GPP, A guide to 3rd generation security, Technical Standard 3GPP TR 33.900 V1.2.0, 3G Partnership Project, January 2001.
14. K. Kotapati, P. Liu, T. F. LaPorta, Dependency relation-based vulnerability analysis of 3G networks: can it identify unforeseen cascading attacks? Special Issue of Springer Telecommunications Systems on Security, Privacy and Trust for Beyond 3G Networks, March 2007.
15. Kotapati K, Liu P, LaPorta TF. Evaluating MAPSec by marking attack graphs. ACM/Kluwer Journal of Wireless Networks Journal (WINET) March 2008.
16. K. Kotapati, P. Liu, T. F. LaPorta, EndSec: An end-to-end message security protocol for cellular networks, IEEE Workshop on Security, Privacy and Authentication in Wireless Networks (SPAWN 2008) in IEEE International Symposium on a World of Wireless Mobile and Multimedia Networks (WOWMOM), June 2008.
17. Kotapati K, Liu P, LaPorta TF. Evaluating MAPSec by marking attack graphs. ACM/Kluwer Journal of Wireless Networks Journal (WINET) March 2008.
18. Kotapati K, Liu P, LaPorta TF. Evaluating MAPSec by marking attack graphs. ACM/Kluwer Journal of Wireless Networks Journal (WINET) March 2008.
19. Moore D, Paxson V, Savage S, Shannon C, Staniford S, Weaver N. Inside the slammer worm. IEEE Security and Privacy. 2003;1(4):33–39.
20. W. Enck, P. Traynor, P. McDaniel, T. F. LaPorta, Exploiting open functionality in sms-capable cellular networks, in: CCS ‘05: Proceedings of the 12th ACM Conference on Computer and Communications Security, ACM Press, 2005.
21. W. Enck, P. Traynor, P. McDaniel, T. F. LaPorta, Exploiting open functionality in sms-capable cellular networks, in: CCS ’05: Proceedings of the 12th ACM Conference on Computer and Communications Security, ACM Press, 2005.
22. P. Traynor, W. Enck, P. McDaniel, T. F. LaPorta, Mitigating attacks on open functionality in sms-capable cellular networks, in: MobiCom ’06: Proceedings of the 12th Annual International Conference on Mobile Computing and Networking, ACM Press, 2006, pp. 182–193.
23. P. Traynor, P. McDaniel, T. F. LaPorta, On attack causality in internet-connected cellular networks, USENIX Security Symposium (SECURITY), August 2007.
24. P. Traynor, W. Enck, P. McDaniel, T. F. LaPorta, Mitigating attacks on open functionality in sms-capable cellular networks, in: MobiCom ’06: Proceedings of the 12th Annual International Conference on Mobile Computing and Networking, ACM Press, 2006, pp. 182–193.
25. P. Traynor, W. Enck, P. McDaniel, T. F. LaPorta, Mitigating attacks on open functionality in sms-capable cellular networks, in: MobiCom ’06: Proceedings of the 12th Annual International Conference on Mobile Computing and Networking, ACM Press, 2006, pp. 182–193.
26. P. Traynor, P. McDaniel, T. F LaPorta, On attack causality in internet-connected cellular networks, USENIX Security Symposium (SECURITY), August 2007.
27. T. Moore, T. Kosloff, J. Keller, G. Manes, S. Shenoi. Signaling system 7 (SS7) network security, in: Proceedings of the IEEE 45th Midwest Symposium on Circuits and Systems, August 2002.
28. G. Lorenz, T. Moore, G. Manes, J. Hale, S. Shenoi, Securing SS7 telecommunications networks, in: Proceedings of the 2001 IEEE Workshop on Information Assurance and Security, June 2001.
29. T. Moore, T. Kosloff, J. Keller, G. Manes, S. Shenoi, Signaling system 7 (SS7) network security, in: Proceedings of the IEEE 45th Midwest Symposium on Circuits and Systems, August 2002.
30. K. Kotapati, P. Liu, Y. Sun, T. F. LaPorta, A taxonomy of cyber attacks on 3G networks, in: Proceedings IEEE International Conference on Intelligence and Security Informatics, ISI, Lecture Notes in Computer Science, Springer-Verlag, May 2005, pp. 631–633.
31. K. Kotapati, P. Liu, Y. Sun, T. F. LaPorta, a taxonomy of cyber attacks on 3g networks, in: Proceedings IEEE International Conference on Intelligence and Security Informatics, ISI, Lecture Notes in Computer Science, Springer-Verlag, May 2005, pp. 631–633.
32. K. Kotapati, Assessing Security of Mobile Telecommunication Networks, Ph. D dissertation, Penn State University, August 2008.
33. Switch, 5ESS Switch, www.alleged.com/telephone/5ESS/.
34. Telcoman, Central Offices, www.thecentraloffice.com/.
35. Prevelakis V, Spinellis D. The Athens affair. IEEE Spectrum 2007; July.
36. H. Hannu, Signaling Compression (SigComp) Requirements & Assumptions, RFC 3322 (Informational), January 2003.
37. Stallings W. Cryptography and Network Security: Principles and Practice. Prentice Hall 2000.
38. K. Kotapati, Assessing Security of Mobile Telecommunication Networks, Ph. D dissertation, Penn State University, August 2008.
39. K. Kotapati, P. Liu, T. F. LaPorta, CAT - a practical graph & SDL based toolkit for vulnerability assessment of 3G networks, in: Proceedings of the 21st IFIP TC-11 International Information Security Conference, Security and Privacy in Dynamic Environments, SEC 2006, May 2006.
40. K. Kotapati, P. Liu, T. F. LaPorta, Dependency relation-based vulnerability analysis of 3G networks: can it identify unforeseen cascading attacks? Special Issue of Springer Telecommunications Systems on Security, Privacy and Trust for Beyond 3G Networks, March 2007.
41. Kotapati K, Liu P, LaPorta TF. Evaluating MAPSec by marking attack graphs. ACM/Kluwer Journal of Wireless Networks Journal (WINET). 2008;12 March.
42. 3GPP2 3GPP, Third Generation Partnership Project, www.3gpp.org/, 2006.
43. Telcoman, Central Offices, www.thecentraloffice.com/.
44. Ellsberger J, Hogrefe D, Sarma A. SDL, Formal Object-oriented Language for Communicating Systems. Prentice Hall 1997.
45. K. Kotapati, P. Liu, T. F. LaPorta, Dependency relation-based vulnerability analysis of 3G networks: can it identify unforeseen cascading attacks? Special Issue of Springer Telecommunications Systems on Security, Privacy and Trust for Beyond 3G Networks, March 2007.
46. K. Kotapati, P. Liu, T. F. LaPorta, Dependency relation-based vulnerability analysis of 3G networks: can it identify unforeseen cascading attacks? Special Issue of Springer Telecommunications Systems on Security, Privacy and Trust for Beyond 3G Networks, March 2007.
47. K. Kotapati, P. Liu, T. F. LaPorta, Dependency relation-based vulnerability analysis of 3G networks: can it identify unforeseen cascading attacks? Special Issue of Springer Telecommunications Systems on Security, Privacy and Trust for Beyond 3G Networks, March 2007.
48. Kotapati K, Liu P, LaPorta TF. Evaluating MAPSec by marking attack graphs. ACM/Kluwer Journal of Wireless Networks Journal (WINET). 2008;12 March.