
A waveform monitor diagrams the scanning movement of the electron.
Waveform Display
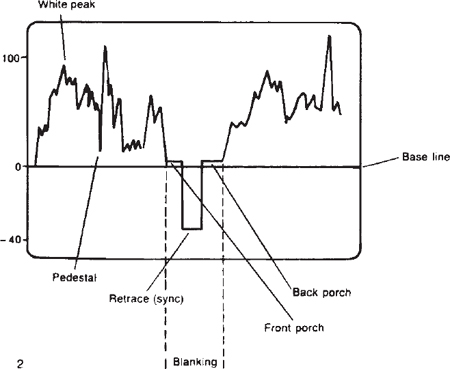
The horizontal scanning movement of the electron beam can be diagrammed another way. Take a look at the figure at the right. This graph represents an electron beam scanning one line of information, returning to the other side of the target during blanking, and reading a new line of video. Everything above the base line represents the electron beam sweeping across the target in its normal direction, collecting information; anything below the base line is the beam returning in the other direction.
The graph actually measures the voltage of the electron beam in special units called IRE units (for Institute of Radio Engineers, now called the Institute of Electrical and Electronics Engineers). The baseline is 0 unit, which is simply 0 voltage. Notice that the height of the graph ranges from 100 to about–40 IRE. Just above the baseline the black portions of the picture are registered. This area near the baseline where the black portions of the picture appear is called the pedestal.
Above the baseline, 100 IRE units indicate the maximum voltage the video system can handle and still provide a good picture. Information located here is called the white peak. Moving from left to right on this diagram, we see that the voltages vary a great deal. As discussed earlier, the higher voltages are the bright parts of the picture, and the lower voltages are the darker parts. Then there is a flat line of very little voltage; this is the start of blanking. The blanking continues for a little way and then suddenly drops below the baseline; this is the start of retrace. After retrace, the voltage rises back above the baseline and remains at this low level until a new video line begins.
When you walk around the equipment area of a TV studio, you'll see several displays, like the one just discussed. These are waveform displays, and they're very important to both production people and engineers. The waveform monitor, which shows these displays, provides a graphic display of the black and white portion of the picture. The voltage signal generated from the black and white portion of the picture, its brightness, is also called the picture's luminance.
When shown on the waveform monitor, however, the blanking and retrace are known by different names. The retrace is called the sync, sync pulse, or horizontal sync; in fact, it's hardly ever called retrace around the studio. Two other parts of the blanking also pick up new names. The first part of the blanking is called the front porch, and the last part of the blanking is called the back porch.

1. Waveform scan.
2. Waveform monitor continuously displaying the scanning of CRT by the electron beam.