

Chapter Eight — Systems of Linear Equations and Inequalities
The Humongous Book of Algebra Problems
168
8.28 Solve the following system using variable elimination.
Like most variable elimination problems, there are various ways to eliminate x
or y from this system. One method is to multiply the first equation by 5 and the
second by –2 so that the x-coefficients are opposites.
Add the equations of the modified system and solve for y.
Substitute y = 7 into either equation of the original system to calculate the
corresponding x-value.
The solution to the inequality is .
Systems of Inequalities
The answer is where the shading overlaps
8.29 According to Problem 7.40, the graph of a linear inequality in two variables is
a region of the coordinate plane. Explain how to generate the graph of a system
of linear inequalities in two variables.
The shaded solution region of a linear inequality graph is a visual
representation of the points that, if substituted into the inequality, would make
the statement true. The solution to a system of inequalities is the set of points
that makes all the inequalities in the system true.
You could
multiply the
rst equation by
7 and the second
by 3 to eliminate
the y’s instead. You
could even multiply
the rst equation by
15 and the second by
–6 to eliminate the x’s
in a different way,
but that’ll make the
numbers in the
equation pretty
big.

Chapter Eight — Systems of Linear Equations and Inequalities
The Humongous Book of Algebra Problems
169
To graph a system of inequalities, graph the individual inequalities on the
same coordinate plane. The solution is the region of the graph on where the
individual solutions overlap. Any point in that region is a solution to all of
the inequalities in the system.
8.30 Graph the following system of linear inequalities.
Graph the inequalities x > 1 and y ≤ 2 using the techniques described in
Problems 7.40–7.43, as illustrated in Figure 8-6.
Figure 8-6: The lightly shaded regions represent solutions to one of the inequalities in
the system, and the darker region represents the common solution to both
inequalities—the solution to the system.
All the points left of the vertical line x = 1 satisfy the first inequality of the
system, and all the points below (and including) the horizontal line y = 2 satisfy
the second inequality. The solution to the system is the dark region of the
coordinate plane in Figure 8-6, the set of points that is both right of x = 1 and
below y = 2.
Graph the
inequalities of
the system, shading
each solution lightly.
The solution to
the system is the
darkest shaded
region, because it’s
where the graphs
overlap.
The lightly
shaded regions
aren’t technically
part of the
graph. They’re just
included so you can
see what parts of
the inequality graph
overlap and what
parts don’t. It’s okay
just to include the
dark region as
the graph and
leave the lightly
shaded
regions out.

Chapter Eight — Systems of Linear Equations and Inequalities
The Humongous Book of Algebra Problems
170
8.31 Graph the following system of linear inequalities.
The graph of y < x consists of all the points below and to the right of the line
y = x, and the graph of y > –x consists of all the points above and to the right of
the line y = –x. The solution to the system, therefore, is the region right of the
y-axis that is bounded above by y = x and bounded below by y = –x, as illustrated
by Figure 8-7.
Figure 8-7: The dark shaded region of the coordinate plane contains points that satisfy
the inequalities y < x and y > –x.
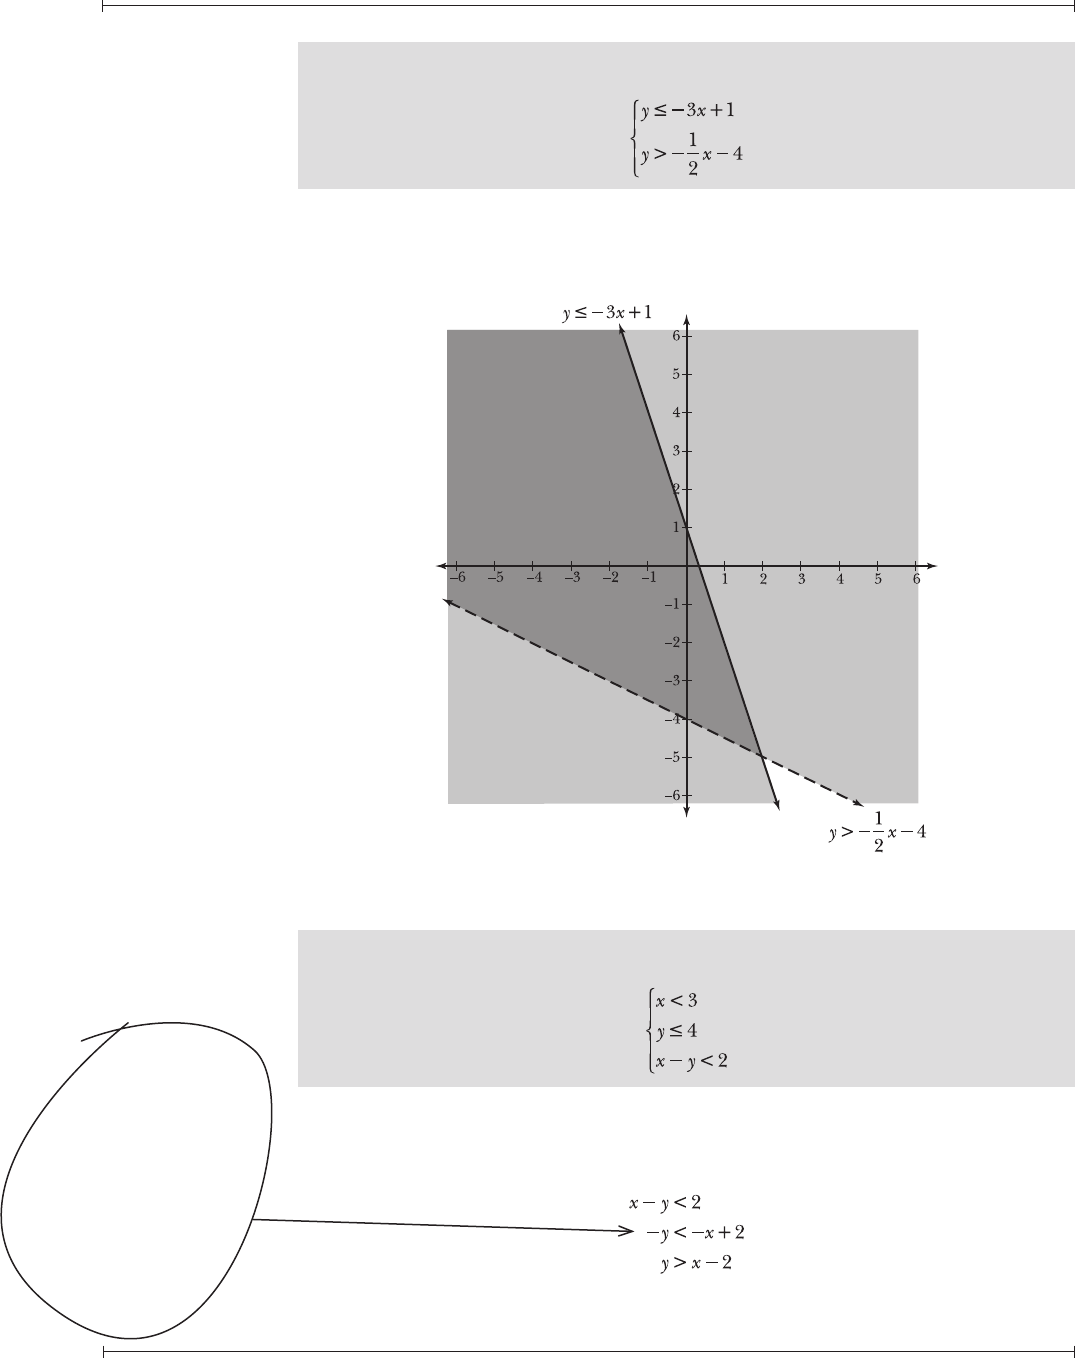
Note: Problems 8.32–8.33 refer to the following system of linear inequalities.
8.32 Graph the system.
The linear inequalities are written in slope-intercept form. Graph both on the
same coordinate plane and indicate the solution to the system by shading it
more darkly than the individual inequality solutions, as illustrated by Figure 8-8.

Chapter Eight — Systems of Linear Equations and Inequalities
The Humongous Book of Algebra Problems
171
Figure 8-8: The dark shaded region of the graph represents the solution to the system.
Note: Problems 8.32–8.33 refer to the following system of linear inequalities.
8.33 Choose one point from the solution region graphed in Problem 8.32 and
verify that it satisfies both inequalities of the system.
The point (0,–4) belongs to the solution graphed in Figure 8-8. To verify that
(x,y) = (0,–4) is a solution to the system, substitute x = 0 and y = –4 into both
inequalities and demonstrate that the results are true statements.
There are an
innite number of
points to choose from
in that solution region.
(0,–4) is only one of them.
You can choose any point
from the darker region of
Figure 8-8, where the
inequality solutions
overlap.
Chapter Eight — Systems of Linear Equations and Inequalities
The Humongous Book of Algebra Problems
172
8.34 Graph the following system of linear inequalities.
Graph the first inequality using a solid line because it is part of the graph,
and graph the second inequality using a dotted line because it is not. The
inequalities and the solution to the system are graphed in Figure 8-9.
Figure 8-9: The dark shaded region is the solution to the system of inequalities.
8.35 Graph the following system of linear inequalities.
The graphs of the first and second inequalities of the system are regions
bounded by vertical and horizontal lines, respectively. To graph the third
inequality, solve it for y.
Figure 8-10 is the graph of the solution to the system of inequalities.
You need to
solve for y (not
–y), so multiply all
the terms by –1. Don’t
forget that multiplying
an inequality by a
negative number means
you have to reverse
the inequality sign
from < to >.
..................Content has been hidden....................
You can't read the all page of ebook, please click here login for view all page.