
Chapter Nineteen — Exponential Functions
The Humongous Book of Algebra Problems
418
Graphing Exponential Functions
Graphs that start close to y = 0 and climb fast
Note: Problems 19.1–19.5 refer to the function j(x) = 2
x
.
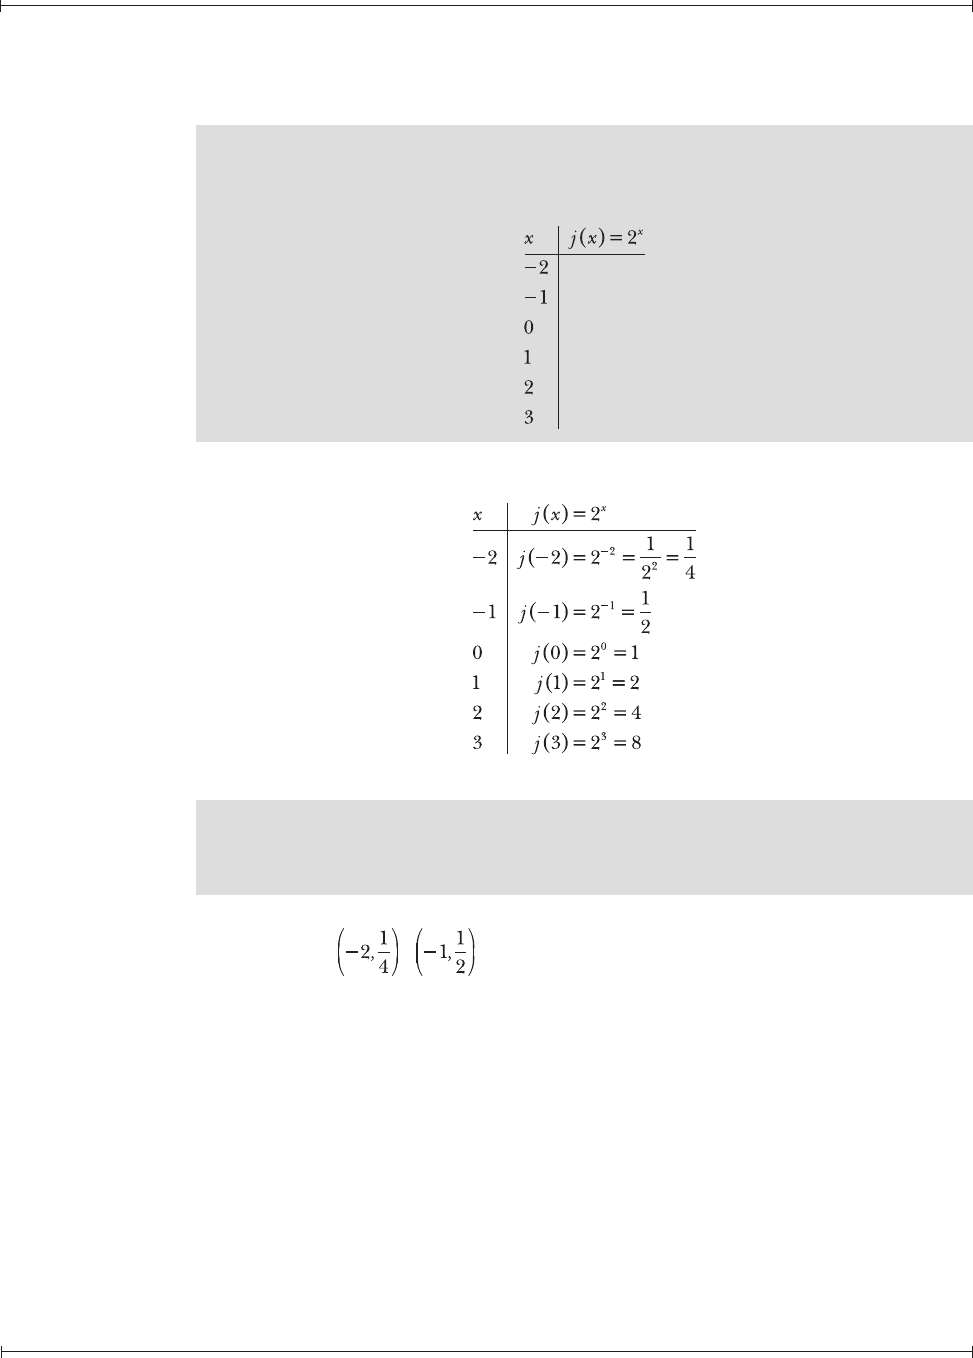
19.1 Complete the table of values below.
Evaluate j(x) for each of the x-values in the left column.
Note: Problems 19.1–19.5 refer to the function j(x) = 2
x
.
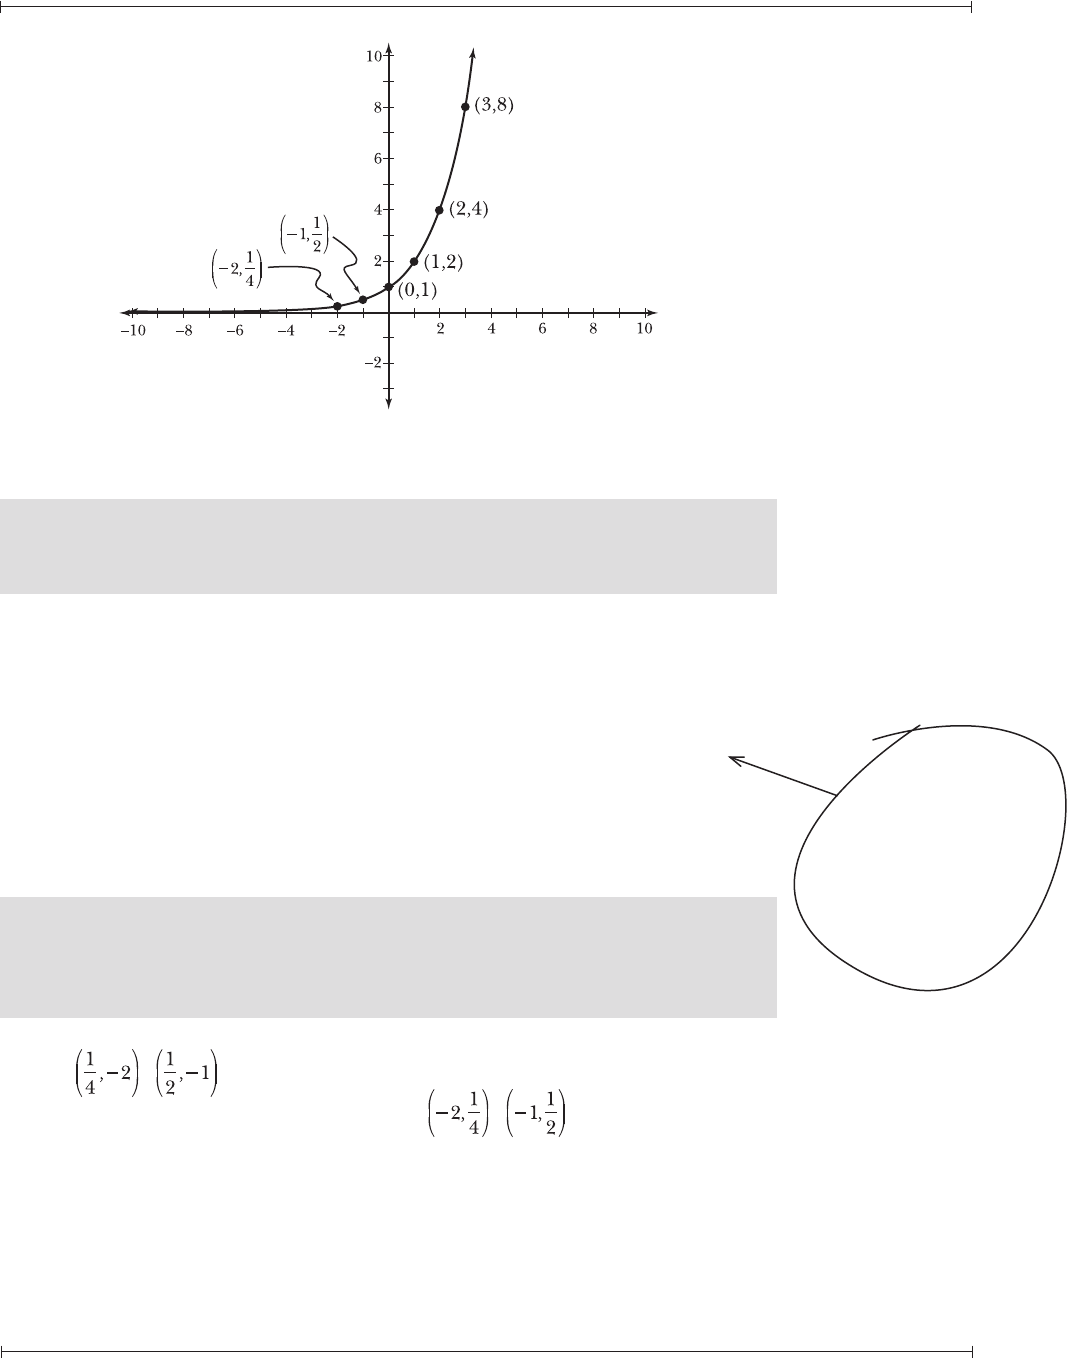
19.2 Graph j(x) using the table of values generated in Problem 19.1.
According to Problem 19.1, the graph of j(x) passes through the following
points: , , (0,1), (1,2), (2,4), and (3,8). The graph of j(x) is
presented in Figure 19-1.
Chapter Nineteen — Exponential Functions
The Humongous Book of Algebra Problems
419
Figure 19-1: The graph of j(x) = 2
x
.
Note: Problems 19.1–19.5 refer to the function j(x) = 2
x
.
19.3 Identify the domain, range, and intercept(s) of j(x).
Consider the graph of j(x) in Figure 19-1. Every vertical line drawn on the
coordinate plane that intersects the graph represents a member of the domain
of j(x). Any vertical line drawn on the graph will intersect j(x), so the domain of
j(x) is all real numbers.
Every horizontal line that intersects the graph of j(x) represents a member
of the range of the function. The line y = 0, the x-axis, does not intersect the
graph, and neither does any horizontal line below it. Only horizontal lines
above y = 0 intersect the graph, so the range of j(x) is j(x) > 0.
The graph of j(x) intersects the y-axis at point (0,1), because j(0) = 2
0
= 1.
Therefore, the y-intercept of j(x) is 1.
Note: Problems 19.1–19.5 refer to the function j(x) = 2
x
.
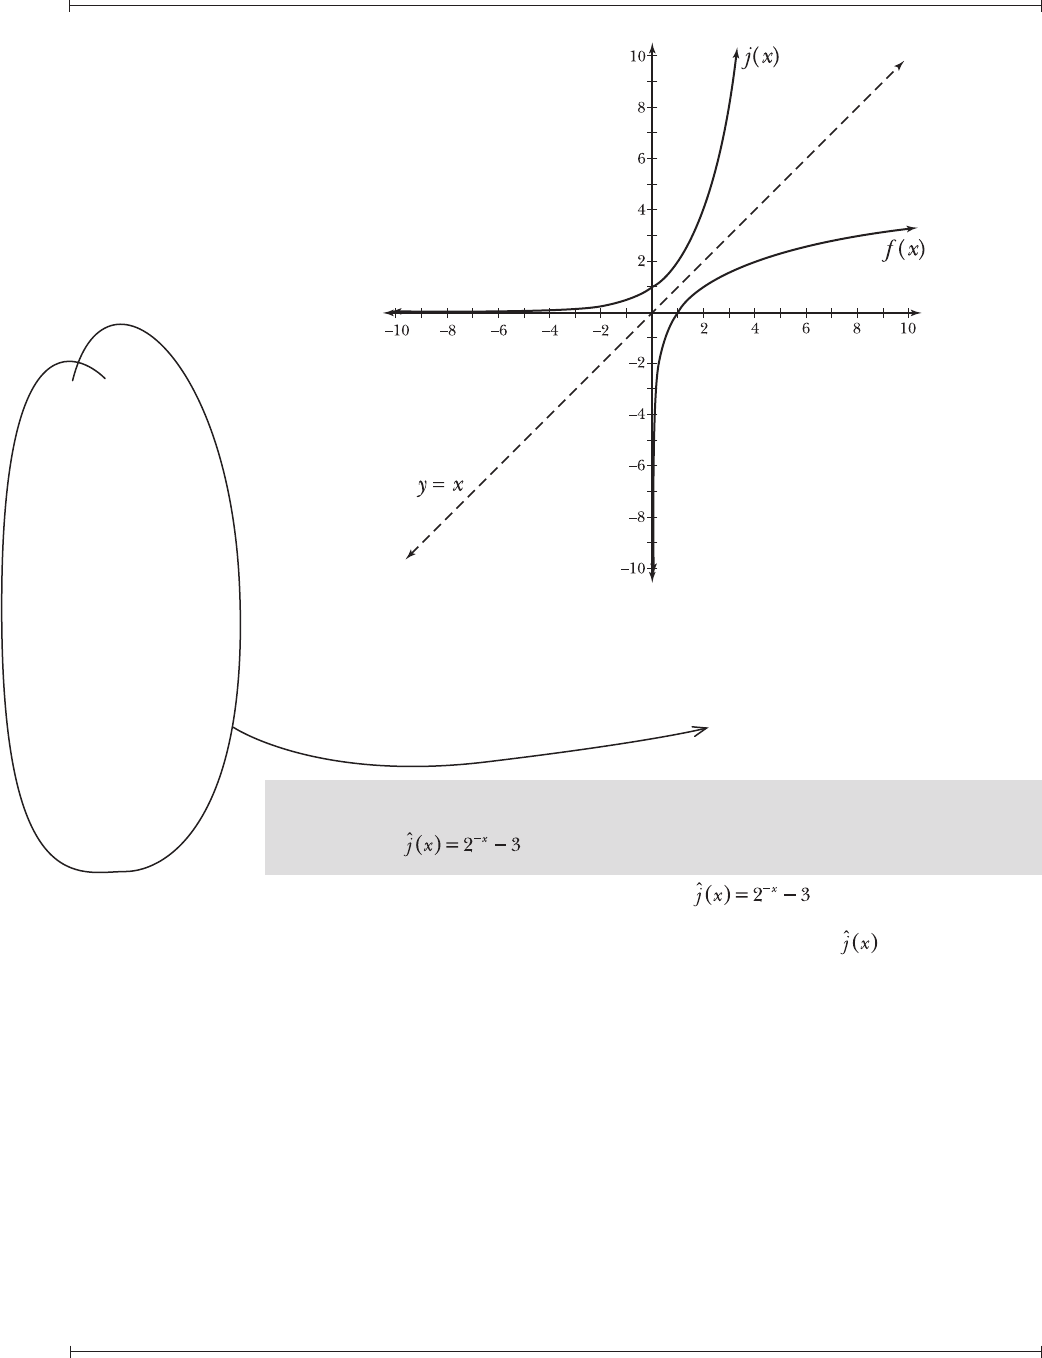
19.4 Demonstrate that f(x) = log
2
x (from Problems 18.11–18.12) and j(x) are
inverses based on their graphs.
According to Problem 18.11, the graph of f(x) = log
2
x passes through points
, , (1,0), (2,1), (4,2), and (8,3). According to Problem 19.1, the
graph of j(x) = 2
x
passes through points , , (0,1), (1,2), (2,4), and
(3,8). Reversing the coordinate pairs of one graph produces the coordinate
pairs of the other, a characteristic of inverse functions. Furthermore, consider
the graphs of f(x) and j(x), plotted on the same coordinate plane in Figure 19-2.
The x-axis
is an asymptote
of the graph, so j(x)
gets innitely close to
the x-axis but never
touches it. That means
j(x) doesn’t have an
x-intercept.
Chapter Nineteen — Exponential Functions
The Humongous Book of Algebra Problems
420
Figure 19-2: The graphs of f(x) = log
2
x and j(x) = 2
x
are reflections of each other across
the dotted line y = x.
The graph of j(x) is the graph of f(x) reflected across the line y = x (and vice
versa), indicating that reversing all the points on one graph will generate the
points on the other.
Note: Problems 19.1–19.5 refer to the function j(x) = 2
x
.
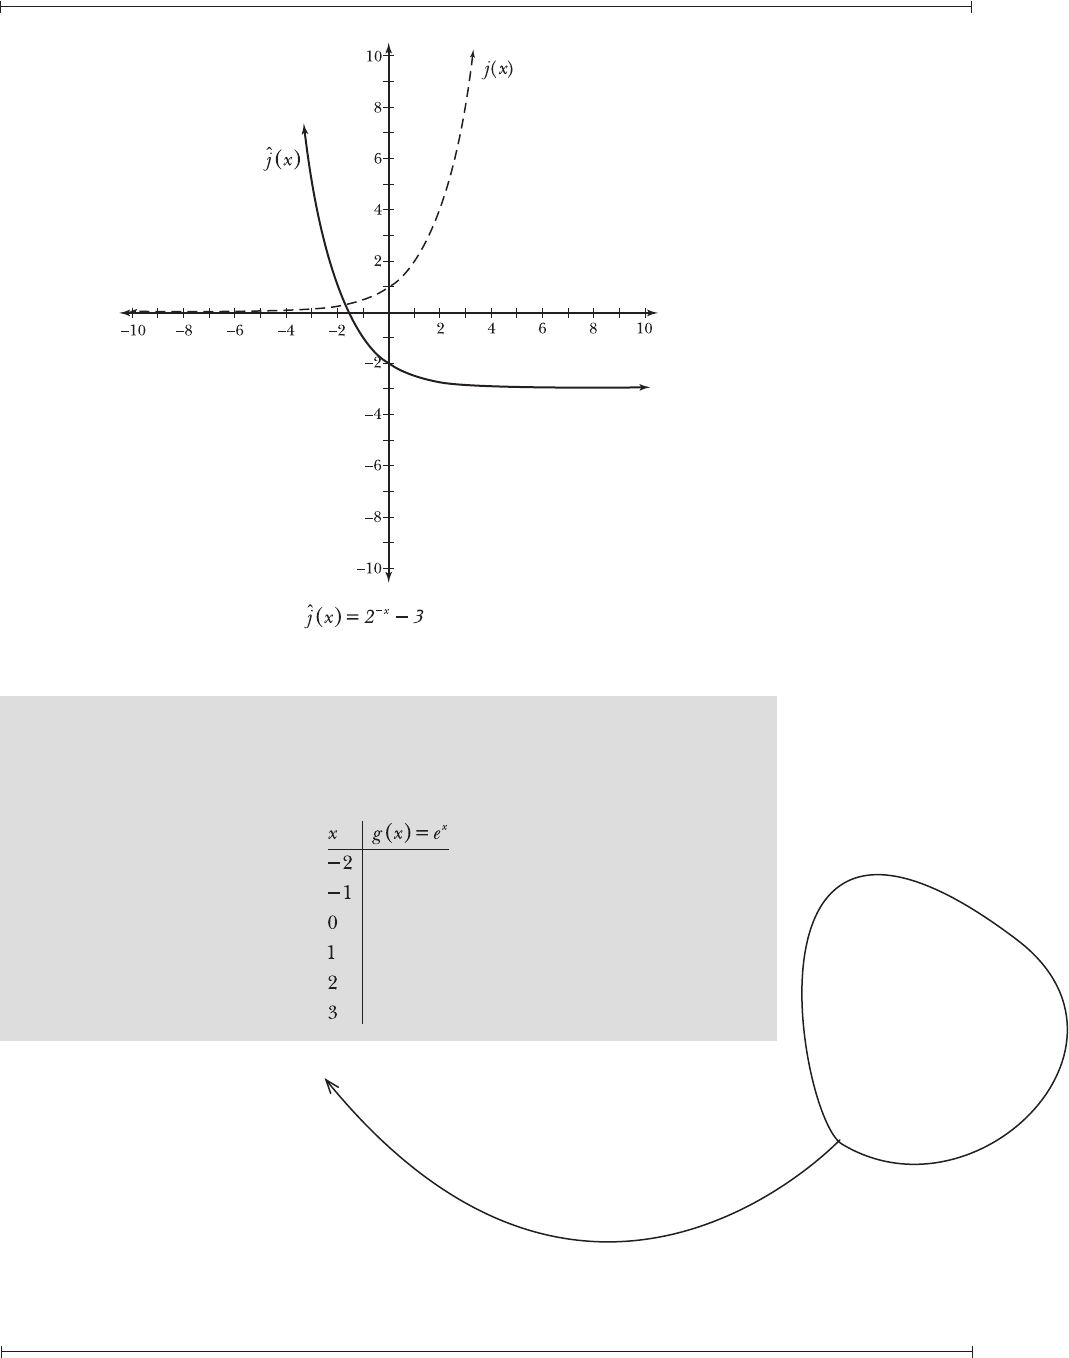
19.5 Graph .
To transform the function j(x) = 2
x
into , multiply the input by
–1 to get –x (which reflects the graph of j(x) across the y-axis) and subtract 3
(which shifts the graph down three units). The graph of is presented in
Figure 19-3.
The table
of values for
f(x) and j(x)
prove that six
coordinate pairs
are reversed copies
of each other.
When functions are
reections of each
other (and the
dotted line
y = x in Figure 19-2
is the mirror), all
of the points on
the graphs are
reversed copies
of each
other.
Chapter Nineteen — Exponential Functions
The Humongous Book of Algebra Problems
421
Figure 19-3: The graph of is the graph of j(x) = 2
x
reflected across the
y-axis and shifted down three units.
Note: Problems 19.6–19.9 refer to the function g(x) = e
x
.
19.6 Use a calculator to complete the table of values below, rounding all values of
g(x) to the thousandths place.
Evaluate the natural exponential function e
x
for each value of x in the left
column.
Euler’s
number (e) is
the base for the
natural exponential
function e
x
, just like
it’s the base for the
natural logarithmic
function log
e
x = ln
x.

Chapter Nineteen — Exponential Functions
The Humongous Book of Algebra Problems
422
Note: Problems 19.6–19.9 refer to the function g(x) = e
x
.
19.7 Graph g(x).
According to Problem 19.6, the graph of g(x) passes through the following
points: (–2,
0.135), (–1,
0.368), (0,1), (1,
2.718), (2,
7.389), and (3,
20.086). The
graph of g(x) is presented in Figure 19-4.
Figure 19-4: The graph of the natural exponential function, g(x) = e
x
.
Note: Problems 19.6–19.9 refer to the function g(x) = e
x
.
19.8 Identify similarities between the graphs of j(x) = 2
x
(in Figure 19-1) and
g(x) = e
x
(in Figure 19-4).
Both functions have the same domain (all real numbers), and both graphs are
entirely contained in the first and second quadrants—neither passes below nor
intersects the x-axis. This behavior is not unexpected, as a positive number
raised to any real number exponent produces a positive number.
Both graphs have values close to zero when x is negative and both increase
steeply when x is positive. Both graphs have a y-intercept of 1, as do all
exponential functions of the form f(x) = a
x
(if a > 0 and a ≠ 1).
A positive number raised
to a negative exponent makes a
fraction that gets smaller as x gets
more negative:
Any positive
number raised
to the zero power
equals 1.
..................Content has been hidden....................
You can't read the all page of ebook, please click here login for view all page.