
Chapter Sixteen — Graphing Functions
The Humongous Book of Algebra Problems
348
Graphing with a Table of Values
Plug in a bunch of things for x
Note: Problems 16.1–16.2 refer to the function f(x) = (x – 3)
2
.
16.1 Complete the table of values.
Evaluate f(x) for each x-value in the left column.
Note: Problems 16.1–16.2 refer to the function f(x) = (x – 3)
2
.
16.2 Graph f(x) using the table of values completed in Problem 16.1.
According to the table of values in Problem 16.1, f(0) = 9, f(1) = 4, f(2) = 1,
f(3) = 0, f(4) = 1, f(5) = 4, and f(6) = 9. Therefore, the graph of f(x), presented
in Figure 16-1, passes through the following points: (0,9), (1,4), (2,1), (3,0),
(4,1), (5,4), and (6,9).
In other
words, plug 0, 1, 2,
3, 4, 5, and 6 into
f(x) one at a time
and simplify.
The numbers
in the left column
of the table of values
are the x-values of
each point, and the
numbers in the right
column are the
matching y’s.

Chapter Sixteen — Graphing Functions
The Humongous Book of Algebra Problems
349
Figure 16-1: The graph of f(x) = (x – 3)
2
.
Note: Problems 16.3–16.4 refer to the function .
16.3 Complete the table of values.
Evaluate g(x) for x = –2, x = –1, x = 0, x = 1, and x = 2.
Chapter Sixteen — Graphing Functions
The Humongous Book of Algebra Problems
350
Note: Problems 16.3–16.4 refer to the function .
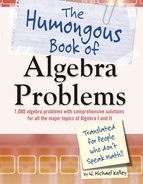
16.4 Graph g(x) using the table of values completed in Problem 16.3.
According to the table of values in Problem 16.3, the graph of g(x), presented in
Figure 16-2, passes through the following points: (–2,0), (–1,1), (0,2), (1,1), and
(2,0).
Figure 16-2: The graph of .
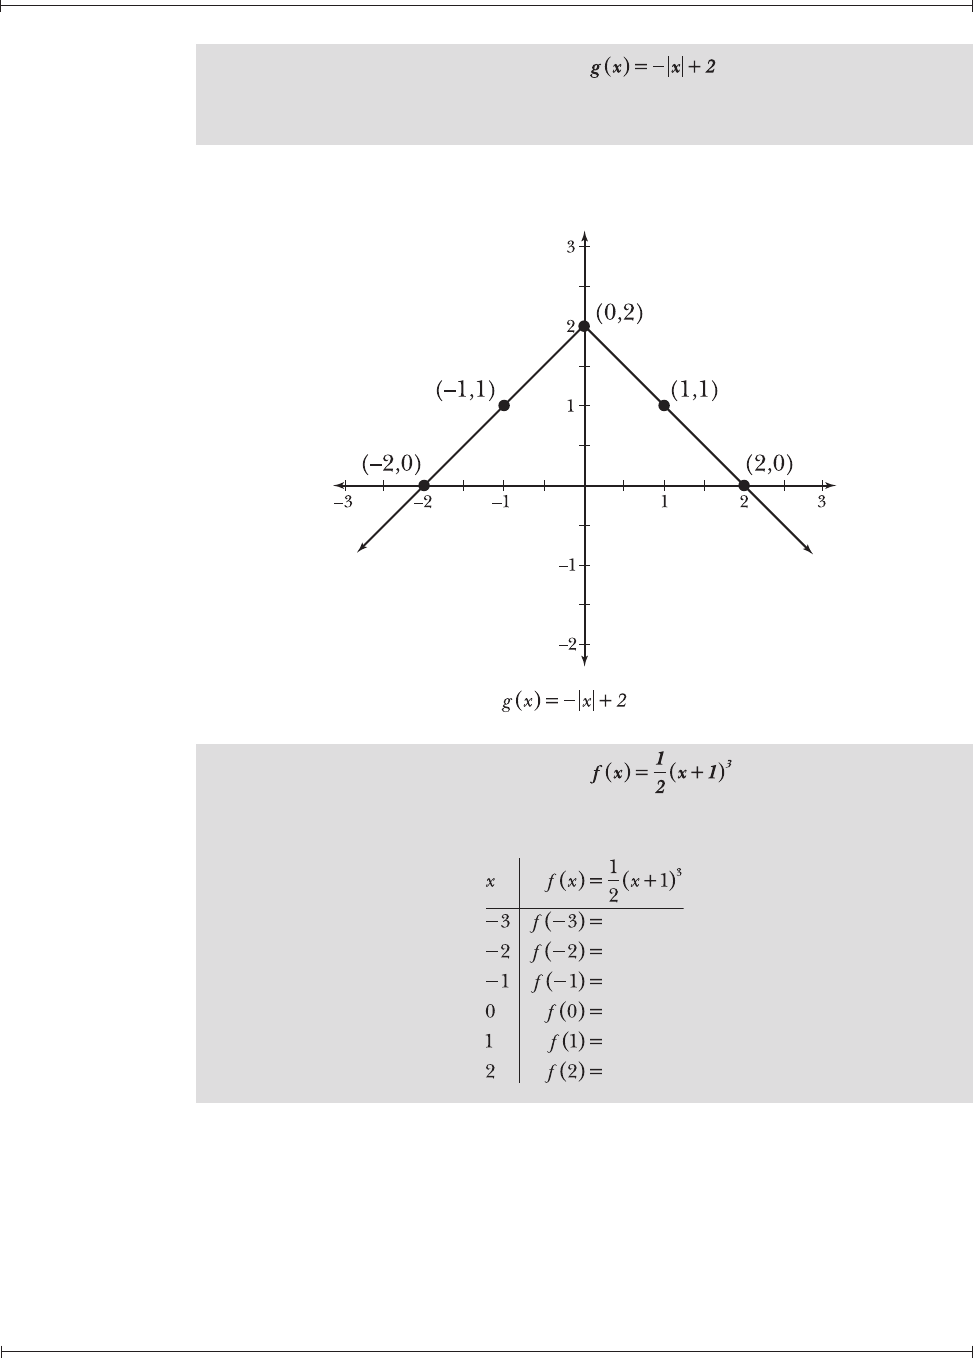
Note: Problems 16.5–16.6 refer to the function .
16.5 Complete the table of values.

Chapter Sixteen — Graphing Functions
The Humongous Book of Algebra Problems
351
Evaluate f(x) for the x-values in the left column of the table.
Note: Problems 16.5–16.6 refer to the function .
16.6 Graph f(x) using the table of values completed in Problem 16.5.
According to the table of values in Problem 16.5, the graph of f(x), presented
in Figure 16-3, passes through the following points: (–3,–4), , (–1,0),
, (1,4), and .
Figure 16-3: The graph of .

Chapter Sixteen — Graphing Functions
The Humongous Book of Algebra Problems
352
Note: Problems 16.7–16.8 refer to the function .
16.7 Complete the table of values.
Evaluate g(x) for the x-values in the left column of the table.
..................Content has been hidden....................
You can't read the all page of ebook, please click here login for view all page.