

Chapter Five — Graphing Linear Equations in Two Variables
The Humongous Book of Algebra Problems
78
Number Lines and the Coordinate Plane
Which should you use to graph?
5.1 What characteristic of an equation dictates whether its solution should be
graphed on a number line or a coordinate plane?
A number line is, like any line, one-dimensional, whereas a coordinate plane
is two-dimensional. Equations with one variable are one-dimensional, so their
solutions must be graphed on a number line. Equations with two different
variables have a two-dimensional graph.
5.2 Graph the values w = 6, x = –5, y = , and z = on the number line in
Figure 5-1.
Figure 5-1: Plot w, x, y, and z on this number line.
To plot w, count six units to the right of 0 and mark the value with a solid dot.
Because x is negative, it should be five units to the left of 0. Plot y two-thirds of a
unit to the right of 0 ( of the distance from 0 to 1 on the number line). It
is easier to plot z if you first convert it from am improper fraction into a mixed
number: . It is located 2.25 units to the left of 0, two full units and
then one-fourth of a unit beyond that. All four values, w, x, y, and z, are
illustrated in Figure 5-2.
Figure 5-2: Negative values, like x and z, are located left of the number 0, and positive
values, like w and y, are located to the right of 0.
5.3 Solve the equation 2x – 3(x + 1) – 5 = –6 and graph the solution.
Use the method described in Problems 4.1–4.36 to isolate x and solve the
equation. Begin by distributing –3 through the parentheses, then combine like
terms, isolate x on the left side of the equation and eliminate the coefficient of x.
A line is
one-dimensional
because it just
allows horizontal
travel, left and right
along the line. On
a coordinate plane,
however, you can
travel horizontally
and vertically, in two
dimensions. Think of an
ant crawling along a
stick as opposed to
crawling around
on a piece of
paper.
If you’re
not sure how
to do this, check
out Problems
2.7–2.8.

Chapter Five — Graphing Linear Equations in Two Variables
The Humongous Book of Algebra Problems
79
To plot the solution, mark the value –2 on a number line, as illustrated by
Figure 5-3.
Figure 5-3: Only one real number, x = –2, satisfies the equation 2x – 3(x + 1) – 5 = –6.
5.4 Identify lines k and m and point A on the coordinate plane in Figure 5-4.
Figure 5-4: Lines k and m intersect at point A = (0,0).
A coordinate plane is a two-dimensional plane created by two perpendicular
lines. Typically, the horizontal line (m in Figure 5-4) is called the x-axis and
has equation y = 0. The vertical line (k in Figure 5-4) is called the y-axis and
has equation x = 0. The axes intersect at a point called the origin, which has
coordinates (0,0), point A in Figure 5-4.
A point
on the plane
is represented
by coordinates,
sort of like an
address for each
point. It’s made up
of two numbers in
parentheses and looks
like B = (2,–1). The
rst number in the
parentheses gives
the horizontal location
of the point (+2 means
two units right of the
origin), and the second
number represents
its vertical location
(–1 means one unit
below the origin).
You’ll practice
plotting points
in Problem
5.5.
Chapter Five — Graphing Linear Equations in Two Variables
The Humongous Book of Algebra Problems
80
Note: Problems 5.5–5.6 refer to the points A = (–1,5); B = (4,4); C = (6,–2); D = ;
E = (0,1); and F = (–6,0).
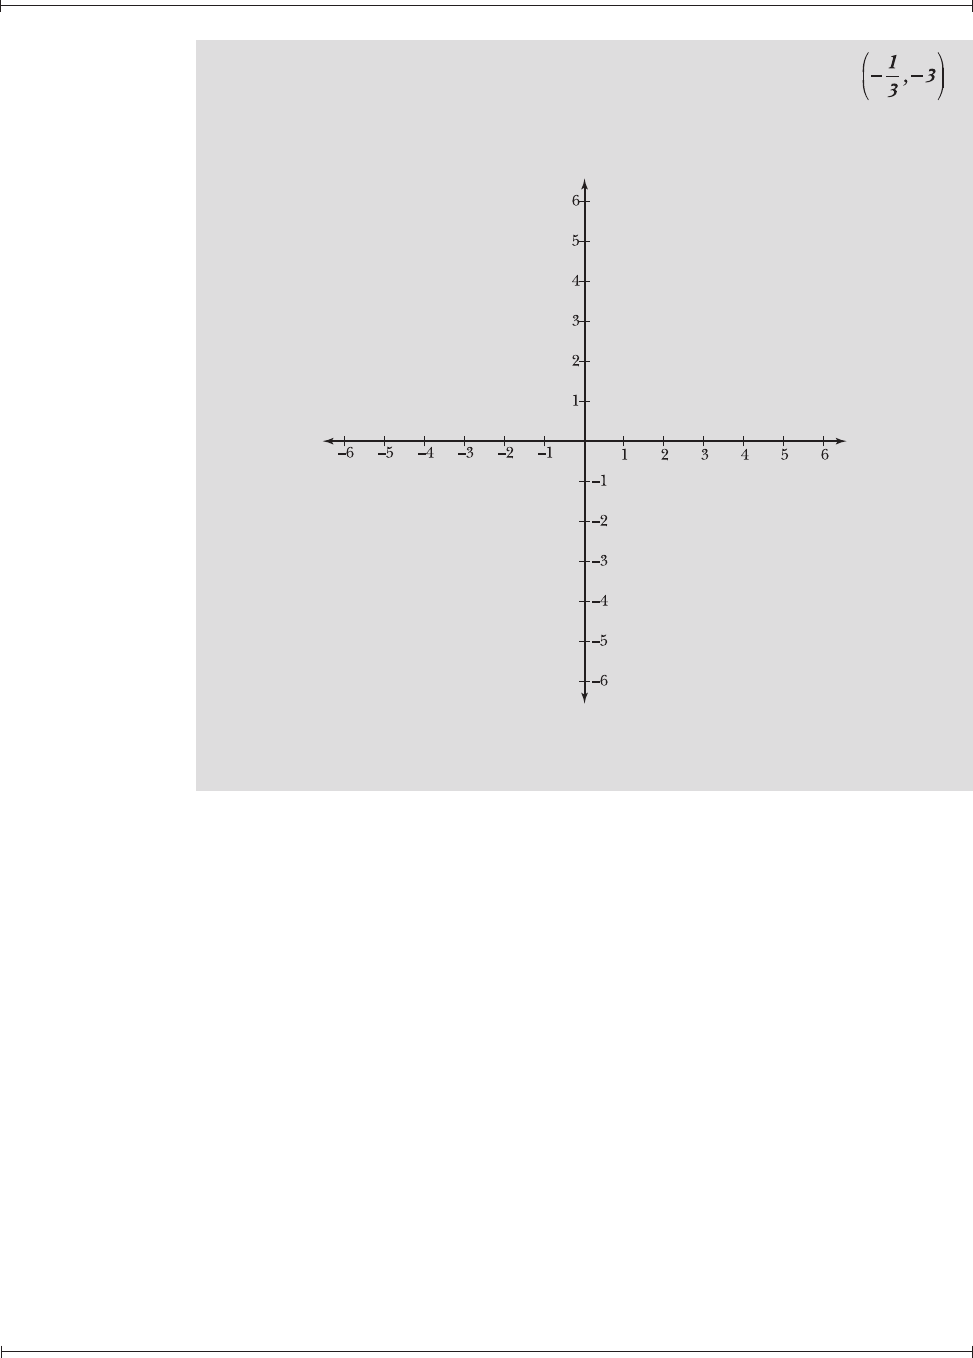
5.5 Plot the points on the coordinate plane in Figure 5-5.
Figure 5-5: Use the coordinates of points A, B, C, D, E, and F to plot the points on this
coordinate plane.
Each coordinate pair has the form (x,y). The left value, x, indicates a signed
horizontal distance from the y-axis. In other words, positive values of x
correspond with points to the right of the y-axis, and negative x-values produce
points left of the y-axis. Similarly, the right value of each coordinate pair, y,
indicates a signed vertical distance from the x-axis. Coordinates with positive
values of y are located above the x-axis, and negative y-values indicate points
below the x-axis. With this in mind, plot each of the points; the results are
graphed in Figure 5-6.

Chapter Five — Graphing Linear Equations in Two Variables
The Humongous Book of Algebra Problems
81
Figure 5-6: One point appears in each of the four quadrants of the graph and the
remaining points fall on the axes of the coordinate plane.
Note: Problems 5.5–5.6 refer to the points A = (–1,5); B = (4,4); C = (6,–2); D = ;
E = (0,1); and F = (–6,0).
5.6 Identify the quadrants in which each of the points A, B, C, and D are located.
The upper-right quadrant of the coordinate plane is quadrant I, or the first
quadrant. The remaining quadrants are numbered counterclockwise from
there, as illustrated in Figure 5-7.
Figure 5-7: Reversing quadrants I and II, thereby mistakenly identifying the top-left
quadrant as quadrant I, is a common error.
According to Figure 5-6, B is in quadrant I, A is in quadrant II, D is in quadrant
III, and C is in quadrant IV.
The x- and
y-axes split the
plane into four
rectangular regions,
called quadrants.
They’re numbered in
a standard way, but
that standard way
is kind of strange.
Check out Problem
5.6 for more
information.
For some
reason, the
quadrants are
usually labeled with
Roman numerals, so
quadrants one, two,
three and four are
written I, II, III,
and IV, as shown
in Figure 5-7.

Chapter Five — Graphing Linear Equations in Two Variables
The Humongous Book of Algebra Problems
82
5.7 Graph the line x = –3 on a coordinate plane and identify two points on its
graph.
Normally, you would graph x = –3 on a number line, much like Problem 5.3
graphed the solution x = –2. However, this problem states that you are to graph
a line, not a point. You can only graph a line on a coordinate plane—not on a
number line. Lines of the form “x = number” are graphed as vertical lines on the
coordinate plane. According to Problem 5.4, the y-axis—another vertical line in
the coordinate plane—has an equation of this form: x = 0. The vertical line with
equation x = –3 should be drawn three units left of the y-axis, as illustrated by
Figure 5-8.
Figure 5-8: Vertical lines in the coordinate plane have form “x = n,” where n is the
signed distance from the y-axis. A positive value of n indicates a line right
of the y-axis, and a negative value of n indicates a vertical line left of the
y-axis.
All the points on the graph in Figure 5-8 have an x-coordinate of –3. If the
x-coordinate of a point is –3, its y-value need only be a real number to ensure
that the graph of x = –3 passes through the point. Therefore, the points (–3,0),
(–3,–9.6), , and all belong to the graph.
5.8 Graph the line y = 2 on a coordinate plane and identify the coordinate at
which it intersects the graph of the line x = –3 (from Problem 5.7).
The graph of y = 2, illustrated in Figure 5-9, is a horizontal line two units above
the x-axis. All horizontal lines have equation “y = n,” where n is the signed
distance from the x-axis. A positive value of n indicates a line above the x-axis,
and a negative value of n indicates a horizontal line below the x-axis. The lines
y = 2 and x = –3 intersect at (x,y) = (–3,2).
Because the num-
ber in the equation
is –3. If the equation
were x = 5, then the
graph would be a
vertical line ve units
right of the y-axis.
After all, the
equa-tion is x = 3,
so that’s the only rule
for these points. The
y-value doesn’t matter
at all. Each point
needs a y-value, of
course, but any real
number will do.
..................Content has been hidden....................
You can't read the all page of ebook, please click here login for view all page.