
Chapter Seven — Linear Inequalities
The Humongous Book of Algebra Problems
142
7.38 Express the solution to the inequality in set notation.
Multiply both sides of the inequality by –4 to isolate the absolute value
expression. Recall that multiplying by a negative number reverses the inequality
symbol.
The left side of the inequality consists of an absolute value statement, so no
matter what value of x is substituted into , its value is nonnegative.
The inequality stipulates that the absolute value expression is less than or equal
to –20, but a nonnegative number cannot be less than a negative number, so
there are no real number solutions to the inequality. Because the set of solutions
is empty, the solution set is the empty, or null, set: .
7.39 Express the solution to the inequality in set notation.
Like Problem 7.38, the absolute value expression left of the inequality symbol
is nonnegative for any real number x, so all real numbers are solutions to the
inequality. In set notation, the solution is {x : x is a real number}; in other words,
if x is a real number, then x is a valid solution to the inequality.
Graphing Inequalities in Two Variables
Lines that give off shade in the coordinate plane
7.40 Graph the inequality y ≤ –3x – 1.
The linear inequality is written in terms of two variables, x and y, so it must
be graphed on a system with two axes, the coordinate plane. Begin by
graphing y = –3x – 1, an equation in slope-intercept form, using the technique
described in Problems 6.21–6.26. However, use a dotted line rather than a
solid line because the points on the line are not solutions to the inequality. The
dotted line separates the coordinate plane into two distinct regions, labeled
A and B in Figure 7-16.
If you plug in
x = 6, you get
.
Any other x-value
produces a positive
number.
The null
set symbol
is NOT a zero,
because zero is a
real number. The
solution set for the
equation x + 5 = 5
is {0}, because x = 0
makes that equation
true and is, there-
fore, a solution. A null
solution set means
there are NO
solutions.
If the left
side is always
greater than or
equal to 0, then it’s
always larger than
the right side, which
is –1.
RULE OF THUMB: When you
see < or > and you’re graphing on a
number line, you use open dots. When
you see < or > and you’re graphing on
a coordinate plane, use a dotted line.
Similarly, ≤ and ≥ indicate solid dots on
the number line and solid lines on the
coordinate plane.

Chapter Seven — Linear Inequalities
The Humongous Book of Algebra Problems
143
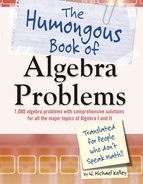
Figure 7-16: The line y = –3x – 1 has y-intercept (0,–1) and slope –3 but does not
represent the graph of the inequality y ≤ –3x – 1. In fact, because the line
is dotted, it is not part of the graph at all. Rather, it splits the coordinate
plane into two regions, here labeled A and B.
Either region A or region B represents the solution to the inequality. Choose
one “test” point, from either of the regions, and substitute it into the inequality.
If that test point makes the inequality true, then the region to which it belongs
is the solution. If it makes the inequality false, then the region not containing
the test point is the solution.
For instance, the point (–2,0) falls within region A in Figure 7-16. Substituting
x = –2 and y = 0 into the inequality y ≤ –3x – 1 produces a true statement.
Because (–2,0) makes the inequality true, region A is the solution to the
inequality. Lightly shade that region on the coordinate plane to complete the
graph, as illustrated by Figure 7-17.
You can
pick any test
point you want, as
long as it’s clearly
in one of the two
regions. Choosing test
points along the line
(whether it’s solid
or dotted) doesn’t
help at all.

Chapter Seven — Linear Inequalities
The Humongous Book of Algebra Problems
144
Figure 7-17: All of the points in the shaded region are solutions to the inequality
y ≤ –3x – 1.
7.41 Graph the solution to the inequality .
Use the method described in Problem 7.40: Draw the graph of the line
, choose a test point to substitute into the inequality, and identify
the solution region based upon the results of that test point. Unlike Problem
7.41, the line is part of the solution region, so use a solid line to
graph it, as illustrated in Figure 7-18.
Figure 7-18: The graph of consists of the shaded region and the
line .
(0,0) is a
great test point
unless the line
passes through the
origin. Substituting
x = 0 and y = 0 into
this inequality results
in 0 ≥ 4, which is
FALSE, so you should
shade the region
that DOESN’T
contain the
origin.

Chapter Seven — Linear Inequalities
The Humongous Book of Algebra Problems
145
7.42 Graph the inequality x ≤ –3.
Graph x = –3, a vertical line three units left of the y-axis, and choose a test point
to substitute into the inequality. The origin, (0,0), belongs to the region right
of the line, and substituting it into the inequality results in the false statement
0 ≤ –3. Therefore, the region left of the line (and the vertical line x = –3 itself)
constitute the solution, as illustrated by the graph in Figure 7-19.
Figure 7-19: The graph of the inequality x ≤ –3.
7.43 Graph the inequality 4x – 3y > 15.
Solve the equation for y to express it in slope-intercept form.
Graph in the coordinate plane using a dotted line. Substituting x = 0
and y = 0 into the inequality produces the false statement 0 < –5, so the solution
is the region of the plane that does not include the origin, as illustrated by
Figure 7-20.

Chapter Seven — Linear Inequalities
The Humongous Book of Algebra Problems
146
Figure 7-20: The graph of 4x – 3y > 15.
..................Content has been hidden....................
You can't read the all page of ebook, please click here login for view all page.