
2. How Major Market Tops Form: Part I, The Preliminaries
As any investor knows, most investment advice is focused on how to make money. We’ve all seen the advertisements promising to guide you on your path to financial wealth and freedom. Less acknowledged is the concept that not losing money can be just as important, if not more so, than making money in achieving a long-term goal of financial freedom. This is especially true during uncertain periods in the stock market.
As pointed out in this book’s Introduction, between 1966 and 1982, the Dow Jones Industrial Average (DJIA) failed to achieve any meaningful gains above its level in early 1966. Despite the lack of overall gain, the DJIA still enjoyed several significant bull markets over this 16-year period—bull markets that afforded ample money-making opportunities. The key, however, was to not give back those bull market gains during the intervening bear trends.
Today, the stock market again appears mired in an uncertain period in which the major price indexes are making little headway over the long term. In fact, as of this writing, the DJIA is at a level first reached in early 1999, while the S&P 500 is at a level first achieved in early 1998. But since 1998–1999, there have been two bear markets, 2000–2003 and 2007–2009, in which the DJIA lost 37% and 54%, respectively. There has been one completed bull market, 2003–2007, in which the DJIA gained 94% and one ongoing bull market beginning in 2009, showing a gain in the DJIA, thus far, of 71%. Because a 100% gain is needed to recoup a 50% loss, it’s easy to see how avoiding these bear markets, while participating in the bull markets, can significantly improve investment performance.
The first step in avoiding a bear market is learning to identify a major market top. Note, this process is in no way an attempt at forecasting prices. Rather, it is the identification of characteristics that have been repeated time and again as a bull market transitions into a bear market. Although no two major market tops are identical, they all share common characteristics. But before a market top can form, there has to be a prior long-term uptrend.
The Life Cycle of a Market Uptrend (a.k.a. a Bull Market)
By the end of a bear market, prices have been driven low enough to the point where supply has been virtually exhausted, and buyers begin to snap up stocks at what they regard as long-term bargain prices. Buying at a true long-term bottom is done primarily by investors who see long-term appreciation potential in stock prices. However, market bottoms generated by traders tend to be temporary, as these buyers will typically sell their stocks after a short-term gain.
This first stage of a new bull market is termed the accumulation phase. Then as prices begin to rise, the new uptrend enters the markup phase. At this point, there is still a healthy dose of skepticism the stock market has entered a long-term uptrend. But demand is clearly dominant over supply as buyers are willing to pay higher prices in hopes of selling at still higher prices. (It has been said that Wall Street is one of the few places where higher prices beget still higher prices). Rising prices during this phase of the uptrend are also characterized as “climbing a wall of worry,” reflecting the skepticism about the durability of the rally. Over time and as prices move steadily higher, this skepticism fades and is replaced by a conviction that the market has nowhere to go but up. This optimism leads to the next and final stage of the uptrend, known as the distribution phase.
The distribution phase can be described as a greedy place, as the dominant characteristic of the distribution phase is investor greed, where caution is generally thrown to the wind. Expectations are the party will never end, and prices will continue to climb ever higher. Even if prices do turn lower, the general consensus is there will be plenty of time to book profits before a new bear trend begins. Such optimism seems well-justified by equally optimistic reports about the economy and corporate earnings. But it is at this point those investors who scooped up stocks at bargain prices during the first phase of the bull market begin to unload their positions. The recipients of these unloaded stock positions are typically late-to-the-party buyers in a process known as the distribution of stock from strong hands (the early buyers) to weak hands (late buyers). Because these late buyers are purchasing stock at already-elevated prices, they are subject to almost immediate losses on any market pullback—hence the term weak hands. For example, had an investor bought XYZ at $10 early in the bull market and it rallied to $50, the stock could pull back to $40 and do little damage to the profit. But compare this to a buyer at $45 who would have almost an immediate loss once the stock began to decline. Consequently, this process of distribution is key to identifying a major market top. But how?
Characteristics of a Major Market Top
Richard Wyckoff was one of the first stock market analysts to recognize bull market tops tend to follow similar patterns of distribution. He also recognized market tops share common characteristics, reflecting the process by which supply overcomes demand. Subsequently, L.M. Lowry, writing in the late 1930s, devised a method of quantifying changes in the longer term trends of Supply and Demand. Taken together, the Wyckoff and Lowry analyses provide powerful tools for identifying major market tops and bottoms.
Idealized Major Market Topping Pattern
While acknowledging that no two major market tops are identical, Richard Wyckoff identified what he believed are two phases common to all tops. The first phase is the distribution of stock from strong to weak hands. The second phase is the dominance of supply over demand, leading to the final collapse of the bull market into a new bear trend. This chapter deals with the distribution phase, and the next chapter details the terminal stage of a bull market and start of a new bear trend. The idealized characteristics of the distribution phase and end of a bull market as defined by Wyckoff are shown in Figure 2.1.
Figure 2.1. Wyckoff’s key points for identifying a major market top
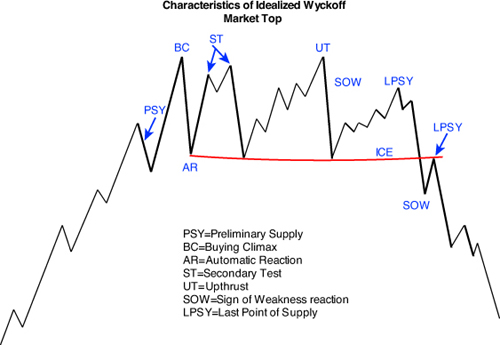
The first point of reference is termed Preliminary Supply (PSY). Prior to this, prices have been moving higher easily. The first sign of an approaching PSY is that prices begin to move higher in smaller amounts but with no significant drop in volume. This resistance to moving higher suggests the demand driving prices higher is beginning to meet more significant supply. Often, this resistance is accompanied by evidence of more selective buying interest. This selective buying is often reflected by lagging breadth as seen in a broad-based advance-decline line, such as the one for stocks traded on the New York Stock Exchange (NYSE). PSY itself is characterized by a heavy volume pullback, frequently the heaviest volume pullback thus far in the uptrend. This is the first indication of aggressive distribution, as long term investors begin to unload positions bought at much lower prices. However, this pullback is typically seen as an opportunity to buy stocks at better prices by those coming late to the rally. This new demand limits the downside in the PSY to an apparently normal correction in the market’s primary uptrend.
As prices recover from the PSY and resume their move higher, buyers begin to panic into stocks, fearing they will miss the next big rally. This panic buying produces the next phase of the topping pattern, the Buying Climax (BC on Figure 2.1). The Buying Climax is typically a one or two-day affair and is characterized by extremely heavy volume. The surge higher, though, cannot be maintained, as the spike in prices motivates earlier buyers to aggressively dump their stocks on the market. The result is an initial spike higher but a close near the low for the day (or for a 2-day BC, the low is recorded on the second day). Typically, the Buying Climax marks the final exhaustion of strong demand in a bull market. From this point on in the topping process demand tends to be of poor quality. That is, most stock is now held by weak hands—those who bought late in the bull market. In contrast supply is of good quality, that is, willing sellers who bought at substantially lower prices and who can still sell at significant profits.
As wary buyers move to the sidelines and sellers step in, the Buying Climax is typically followed by a decline, termed by Wyckoff as the Automatic Reaction (AR on Figure 2.1). Sellers are now active, so volume can remain relatively heavy on this decline. The bottom of this Automatic Reaction often serves to define the lower limit of the trading range that defines price movement as the topping process progresses. The Automatic Reaction also typically marks the start of active distribution. At this point, however, not all late buyers have abandoned hope for higher prices. Rather, they see the pullback on the Automatic Reaction as a temporary pause in an ongoing bull market and as another opportunity to buy at lower prices. The rally that results from these bargain hunters’ activities is termed the Secondary Test (ST).
The primary role of the Secondary Test is to help determine the balance of Supply and Demand. If demand remains strong, then the Secondary Test rally will surpass the top of the Buying Climax. In this case, volume is usually heavy on the rebound. A failed test, however, will likely be accompanied by weak or falling volume and a shrinking range between the daily intraday highs and lows. The initial Secondary Test typically defines the upper limit of the topping formation and is followed in the succeeding days and weeks by a series of rallies and reactions as the process of distribution continues. The end of this distribution process is marked by signs buyers have stepped aside (demand has been exhausted) and sellers have become the dominant players in determining the market’s trend. The end of the distribution process is discussed in the next chapter, which covers the final stages of a major market top.
Lowry Indicators
While the Wyckoff analysis of market tops may seem cut and dried, there can be instances when the patterns of price and volume lack clarity. This is where utilizing the tools offered by the Lowry analysis can shed light and help validate the Wyckoff patterns. In analyzing market tops, there are three primary tools used by the Lowry analysis: 90% Days and, most importantly, the Lowry Buying Power and Selling Pressure Indexes.
As will be explained in Chapter 4, “How Major Market Bottoms Form: Part 1, Panic & Capitulation,” the concept of 90% Days was first introduced by the current principal at Lowry Research, Paul Desmond, in 1982. The rationale for 90% Days is they represent severe imbalances between Supply and Demand. Thus an imbalance in demand could be reflected by panic buying in a 90% Up Day. Likewise, an imbalance in supply reflects panic selling in a 90% Down Day. The calculation for a 90% Day entails both Up and Down Volume plus Points Gained and Points Lost, all of which are the essential elements in measuring Supply and Demand. Up Volume is simply the total volume of all stocks on the NYSE advancing for a day’s session. Down Volume is the total volume for all the NYSE stocks declining for the day. Points Gained is the cumulative total points for all advancing stocks in a day’s trading, while Points Lost is the cumulative total points for all declining stocks. A 90% Up Day, therefore, occurs when Up Volume is 90% or more of the trading session’s total Up plus Down Volume and Points Gained is 90% or more of the total Points Gained plus Points Lost for the session. Similarly, a 90% Down Day occurs when Down Volume is 90% or more of the session’s total Up/Down Volume and Points Lost is 90% or more of the total Points Gained/Points Lost. Variations of the 90% Day concept have appeared over the years, most often based only on Up/Down Volume. However, to qualify as a true 90% Day, both Points and Volume must be included. As an advertisement might state...“accept no substitutes.”
The Law of Supply and Demand is the bedrock for all analysis at Lowry Research. The principal means for measuring the forces of Supply and Demand are the Selling Pressure and Buying Power Indexes. First introduced by L.M. Lowry in the late 1930s, the Buying Power and Selling Pressure Indexes are tools for measuring the intermediate to longer-term trends of Supply and Demand. Although the calculation is proprietary, these Indexes include daily Up/Down Volume, total Volume, Points Gained and Points Lost. Volume figures are based on Composite NY Stock Exchange figures. Expanding or contracting demand is reflected by sustained uptrends or downtrends in Buying Power. Similarly, increasing supply is indicated by an uptrend in Selling Pressure, while a downtrend reflects contracting supply. The strongest market uptrends are accompanied by an uptrend in Buying Power and downtrend in Selling Pressure.
As a bull market matures, profit-taking begins to increase. As a result, it is not uncommon to see both Buying Power and Selling Pressure rising in the latter stage of a bull market. Supply begins to expand on more widespread profit-taking while continued strong fundamental factors (such as rising earnings and a strong economy) fuel continued demand. In the final stages of a bull market, though, it is the action of Selling Pressure that moves to the forefront, as it best illustrates the process of distribution that occurs at major market tops.
Combining the Wyckoff and Lowry Analyses in Identifying Major Market Tops
Although 90% Days are key factors in identifying major market bottoms, they are relatively minor factors at major market tops. When found, 90% Down Days most frequently occur at the time of PSY and act as confirming evidence of the heavy selling that normally marks this pattern. In general, though, 90% Days were relatively rare at major market tops, at least until 2007 when the abolition of the Up-Tick Rule helped fuel a proliferation of both 90% Up and Down Days.
Contrary to the limited appearance of 90% Days at market tops, the Buying Power and, especially, Selling Pressure Indexes are very useful tools in helping identify the various Wyckoff elements of a market top. For instance, at PSY, Selling Pressure will quite often show a sharp spike higher, underlining the surge in supply that identifies this pattern. The Selling Pressure Index can also be useful in highlighting a continued pattern of distribution as prices rise and fall in Secondary Tests and Automatic Reactions as the topping process progresses. A sustained rise in Selling Pressure can be especially useful during these tests of the market’s high, as price alone can be a misleading indicator of market strength. At the same time, a flat to lower trend in Buying Power during Secondary Test rallies suggests a pattern of contracting Demand. In turn, this suggests a market with insufficient strength to renew the bull trend. Taken together, the Buying Power and Selling Pressure indexes are important elements in helping identify the shift in control from buyers to sellers that is part of every major market top.
All this theory is well and good, but how do the Wyckoff and Lowry analytical techniques hold up during actual market tops? For an answer, we turn to an examination of the major market tops during the secular bear market 1966–82 and then to the 2007 top in what many perceive as the current-day secular bear market.
The Top of the 1966–1969 Bull Market
After a 9-month bear market that began in early 1966, the DJIA started a new bull run in October 1966. The bull market was interrupted by a nearly 10% pullback lasting from September 1967 to March 1968, after which the DJIA again turned higher. As seen in Figure 2.2, this rally peaked in early May and was followed by a two-month trading range, after which the DJIA fell to a reaction low in August. From this reaction low, the stock market enjoyed a virtually uninterrupted advance over the next two months that carried the DJIA to a new rally high for the bull market by mid-October. At this point, though, the rally suffered a significant hiccup in the form of a sharp two-week setback that occurred on volume equal to the heaviest seen during the rally from the August low. This heavy volume suggested a potential point of Preliminary Supply (PSY) had been reached. The potential for a PSY was supported by the Selling Pressure Index, which had been in an uptrend since early June, suggesting a pattern of increased selling into the rally. Selling Pressure continued to expand during the two-week October pullback by the DJIA with a sharp spike higher, indicating an increase in supply.
Figure 2.2. The initial phase of the 1968-69 major market top
Charts created with Metastock, a Thomson Reuters product.
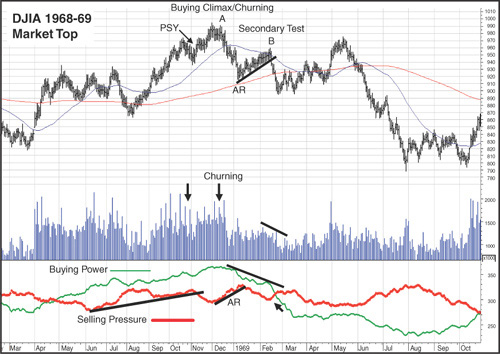
However, demand was still apparent, as indicated by an uptrending Buying Power Index. As a result, the rally quickly resumed, carrying to the final high in November–December. Although a classic Wyckoff top calls for a Buying Climax at this point, the top in 1969 was a better representative of another Wyckoff principle, the Law of Effort vs. Result (in the form of a heavy volume churn). As is evident from the chart at point A, although volume remained heavy, the DJIA was unable to make any further progress after reaching a high on November 29. A rally on heavy volume that fails to make any upside progress suggests aggressive selling into the advance. Coming on top of an extended rally and following the initial signs of increased selling offered by the PSY, such churning suggests a significant market top has been reached. But it is the subsequent movement in prices that confirms whether or not a major top is forming.
After about a week of churning and making no upside progress, Demand dried up, and prices began to fall into the Automatic Reaction (Point AR). Although volume was irregular on the Automatic Reaction pullback, the rise in Selling Pressure was a clear indication sellers were aggressively unloading stocks. However, prices were not yet ready to fall into a protracted decline, as the DJIA again rebounded to a recovery high at the Secondary Test at Point B. Volume on this rebound, however, was light and failed to expand, both aspects typical of an advance with limited upside potential. A continued slide in Buying Power offered additional evidence of a lack of demand behind the advance. The subsequent decline to the February low, however, occurred on decreasing volume and only a nominal rise in Selling Pressure. In fact, although the DJIA dropped below its January low in early February and again in mid-March, the corresponding peak in Selling Pressure was below its early January high. This lower peak in March suggested sellers were content to move to the sidelines, setting the stage for another attempt to rally the market. Rather than marking a renewed bull market, though, this rally began the final stage of the topping process, a process covered in the next chapter.
The Top of the 1970–1973 Bull Market
Starting in May 1970, the DJIA began a long bull run that eventually terminated at a high in early 1973. Figure 2.3 shows the last few months of this rally along with the indications a final top was in place.
Figure 2.3. The initial phase of the 1972-73 market top
Charts created with Metastock, a Thomson Reuters product.

The initial warning of a market top is at Point A, Preliminary Supply (PSY). Typically, PSY is marked by a surge in volume on a pullback, suggesting aggressive selling. In this case, though, while volume does show an increase, it is no higher than the volume accompanying the rally from the October reaction low. However, Lowry’s Selling Pressure Index tells a different story. After showing a steady decline over the prior few months, Selling Pressure shows a sharp increase coincident with the December pullback in the DJIA (Point A). In fact, this increase in Selling Pressure comes close to breaking a multimonth downtrend.
Rather than continuing lower, though, the DJIA resumes its rally in late December. Demand continues to increase, as indicated by the rise in Buying Power. But something else interesting is also happening. Although prices continue to climb into the Buying Climax, marked by the sharp rise in volume at Point B, Selling Pressure rises as well, with its low at the Buying Climax (Point B) well above its low at the bottom of the PSY reaction (Point A). This continued rise in Selling Pressure suggests supply continues to expand, even as prices are rising into the Buying Climax.
The drop into the Automatic Reaction (Point C) and rally back to the Secondary Test (Point D) had all the signs of a rally that has run out its string. Volume is heavy on the pullback to the low of the Automatic Reaction, suggesting active selling into the decline. An expansion in Supply was confirmed by another sharp rise in Selling Pressure, while the drop in Buying Power suggested little interest in buying the pullback. The subsequent rally to the high of the Secondary Test (Point D) occurred on a substantial decrease in volume from the rally to the Buying Climax high. The lack of Demand behind the rebound was also reflected by the minimal increase in Buying Power, while continued selling into the rally was evident in the nominal drop in Selling Pressure. Although the progression from PSY to the Secondary Test occurred over a relatively short period of time, the process appeared to portray a market where control has passed from buyers to sellers in preparation for the descent into a new bear market.
The Top of the 1975–1976 Bull Market
The end of the 1972–74 bear market was followed by a sharp rally beginning in December 1974 that carried the DJIA nearly 50% higher by mid-May 1975. The DJIA then traded generally sideways for about next seven months. But beginning in early December 1975, prices spiked sharply higher into the end of February 1976, doing so on very heavy volume. In Figure 2.4, the first suggestion all was not right with the rally was provided by the Selling Pressure Index. Despite a continued rise in prices, the Index began to rise in mid-January. This increase suggested that, rather than waiting for still higher prices, sellers were becoming more aggressive in dumping stock into the rally. Thus the warning flags were out when prices reacted lower on heavy volume in early February. The volume on this pullback suggested a possible point of Preliminary Supply (PSY at Point A) had been reached.
Figure 2.4. The initial phase of the 1976 major market top
Charts created with Metastock, a Thomson Reuters product.
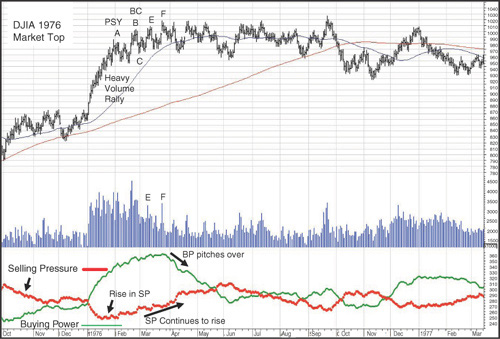
The DJIA quickly recovered from the early February sell-off, though, surging higher on a spike in volume to a new rally high for the bull market in late February. However, this spike in volume at Point B suggested a potential Buying Climax (BC). Suspicions about a possible terminal move were supported by the Selling Pressure Index which had continued to rise during the DJIA’s rally to the late February high. Prices quickly reacted lower after the Buying Climax in an Automatic Reaction. The decline to the Automatic Reaction low at Point C and subsequent rebound in the Secondary Test (Point E) provided further evidence of a rally in its final stages.
Volume remained heavy on the drop to the Automatic Reaction low, suggesting aggressive unloading of stock positions. Volume again spiked on rallies to the Secondary Test highs at Points E and F. However, despite the spikes in volume, prices failed to move substantially above the Buying Climax high. The failure to reach new highs suggested these rallies were being met with aggressive selling, symptomatic of distribution. Buying Power, however, continued a slow rise into the rally peak in late March. This rise suggested demand had not yet been totally exhausted, as late-comers to the bull market remained hopeful the market advance was still intact. At the same time, though, the steady rise in Selling Pressure suggested early buyers in the bull market were using the continued uptrend as an opportunity to unload more of their stock. The stalemate between rising demand and rising supply apparently ended in late March, when the Buying Power Index pitched over into a steep decline while Selling Pressure continued to rise. As things turned out, though, the bull had not yet breathed its last breath, and several months of further distribution were on tap before the DJIA tipped over into a bear decline.
The Top of the 1980–1981 Bull Market
The 1981 market top (Figure 2.5) marked the end of the cyclical bull markets in the 1966–82 secular bear market. From 1982 to 2000, bear markets proved short-lived, averaging only about three months in duration and retracing only a nominal portion of the preceding bull market, as the equity market entered a prolonged period of steadily rising prices in the new secular bull trend.
Figure 2.5. The initial phase of the 1980-81 major market top
Charts created with Metastock, a Thomson Reuters product.

The 1980–81 bull market was a short-lived advance that began on March 27, 1980, the so-called Silver Thursday, when the Hunt Brothers’ Silver Bubble burst. Prices moved steadily higher thereafter through early August 1980 at which point the rally stalled and fell into a sideways trading pattern. The DJIA finally broke out from this trading range in mid-November, reaching a new rally high a few days later. However, signs of a weakening bull market began to develop prior to that early August top. As of mid-July, Selling Pressure began a steady climb while Buying Power fell into a decline, suggesting a pattern of expanding supply and contracting demand. Although volume spiked higher in the rally to the November high, the DJIA was unable to hold its gain, dropping sharply into a reaction low in mid-December. This sharp decline suggested sellers were using the decline as an opportunity to dump stock positions. In addition, the drop to mid-December was accompanied by steady to rising volume, a sharp rise in Selling Pressure and the first appearance of a 90% Down Day in a market top since 1946. The heavy selling indicated by the 90% Down Day and rising volume provided a good indication of aggressive selling and that a point of Preliminary Supply (PSY, Point A) had been reached.
Prices, however, were not yet ready to enter a bear trend as renewed demand was found just below the late October reaction low in the DJIA. The result was a rebound to a new rally high on January 6. Volume spiked higher on the rally to the January 6 high and then even higher on the decline on January 7 in a classic Buying Climax (BC Point B). Selling Pressure, however, showed only a small drop in the rally from mid-December to the Buying Climax high. At the same time, Buying Power showed only a nominal gain, suggesting demand was of low quality in the spike to the Buying Climax high. That is, the panic buying represented by the climactic price/volume resulted in stock positions immediately vulnerable to any reversal in the rally. In other words, this stock was now in weak hands.
As a result, rather than viewing the pullback following the Buying Climax as a buying opportunity, those weak hands began to aggressively unload stock as the decline was accompanied by another 90% Down Day. Panic selling again appeared as the decline to the Automatic Reaction low (AR, Point C) was completed with another 90% Down Day. A third 90% Down Day since the DJIA had reached its preliminary high in mid-November suggested sellers were clearly gaining control of the market. However, this control was not complete given that prices stabilized as the DJIA found support at its 200-day moving average. Enough demand emerged at this presumed support level to lift the DJIA back into another rally that carried to a first Secondary Test (ST) of the Buying Climax high in early March (Point D) and then to a second test later in the month (Point E). Volume rose steadily in the rally from the February test of the 200-day moving average, suggesting renewed demand.
That rally proved short-lived though. Despite heavy volume, the advance failed to move substantially above the level reached at the Buying Climax. Heavy volume that fails to produce corresponding price gains is evidence of churning, which itself is symptomatic of distribution. Clearly, supply was beginning to overcome demand. Churning was also evident in failure of the Buying Power Index to show any gain from its mid-March peak to the late April rally high in the DJIA. At the same time, Selling Pressure failed to show any significant loss. This suggested investors were using the rally to the late March high as an opportunity to dump stocks rather than chase prices higher. As events played out, the March–April churning served as a warning the market was about to roll over into a new bear trend.
The Top of the 2003–2007 Bull Market
The market top inaugurating what many regard as the current secular bear trend formed in 2000–2001. Chapter 8, “The Curious Case of the 2000-2001 Market Top and Demise of the Secular Bull Market,” is devoted to the many unique features of this major market top. The second market peak in the secular bear market occurred in 2007 following the four-year bull market that began in March 2003.
The first indication the bull market might be in trouble began with a sharp drop in the DJIA beginning in mid-July 2007 (Figure 2.6). After a brief recovery, the decline resumed, finally ending with a minor selling climax (Point A) in mid-August. The significant surge in volume accompanying the pullback suggested a point of Preliminary Supply (PSY) might have been reached. Two other factors suggested a significant change in the character of the rally. First, the decline from the July high to the August low was accompanied by four 90% Down Days, indicating intense selling. Except for the three that occurred in 1980–81, 90% Down Days were extremely rare at major market tops. One theory for the sudden proliferation of 90% Days in 2007 places responsibility on the elimination in July of the Up-Tick Rule for short selling. Whatever the merits of this theory, the presence of four 90% Down Days, plus the rise in volume, appeared to provide clear evidence a point of PSY had been reached in the July–August decline. The other factor suggesting a significant change in character for the market was the move by Lowry’s Selling Pressure Index above Buying Power (Point B). This cross has, historically, been a signal supply is dominating demand.
Figure 2.6. The initial phase of the 2007 major market top
Charts created with Metastock, a Thomson Reuters product.
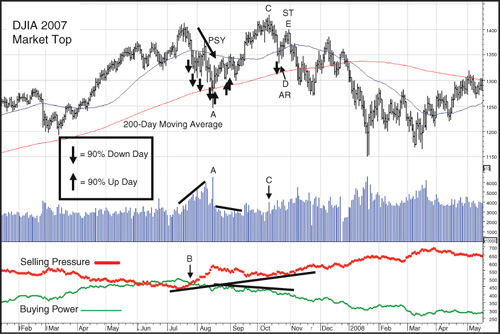
Prices were not yet ready to fall into a bear trend, however, as the August selling climax met support at the DJIA 200-day moving average. Buying appeared intense at times during the subsequent rebound rally, given the three 90% Up Days accompanying the advance. However, overall volume failed to show any significant rise and remained well below the level on the drop from the July high to August reaction low. More importantly, the trend in demand failed to expand on the move to the October high, as Buying Power was flat to lower during the rally. At the same time, sellers remained active, as indicated by the nominal drop in the Selling Pressure Index.
What is conspicuous by its absence in this topping process is a Buying Climax. About the closest the DJIA could come to a Buying Climax was the failed rally on the spike to the ultimate high in the bull market on October 11, which was accompanied by a modest surge in volume (Point C). More significantly, though, was the fact Buying Power, at the October peak in the DJIA was well below its level at the July market high, despite the higher high in price. At the same time the low in Selling Pressure at the October market peak was far above its July low, suggesting much more aggressive unloading of stock. This aggressive selling was further evident during the subsequent drop to the Automatic Reaction low (AR, Point D) in late October, which occurred on a rise in volume, increase in Selling Pressure, and yet another 90% Down Day. Clearly, this pullback was not seen as a buying opportunity but as potentially a last chance for dumping stocks before a significant decline set in.
The rebound from the Automatic Reaction low to the Secondary Test (ST, Point E) managed to occur on a small rise in volume. However, Buying Power continued to fall, indicating the increase in volume was unlikely to represent the start of a trend of strengthening demand. Also the fact the rebound failed well below the October high in the DJIA, despite the rise in volume, suggested the rally was being met by significant new Supply. Again, this failed rally represents a potentially major change in character for the rally. Had expectations been for higher prices, then the rally should have induced new buying from those worried about missing the next leg higher in the bull market. Instead, the rally was met by enough selling to turn prices lower again, evidently the result of those worried about the possibility of having to sell at even lower prices.
In fact, those worries proved well-founded, as the rally to the Secondary Test in late October (Point E) proved to be the last gasp for the bull. What followed was the completion of the distribution process and descent into the bear market of 2007–2009, a process discussed in the following chapter.