
Chapter 12. Basic Movements
“The underlying idea is that stock prices rise for approximately two years, decline for about a year, then rise for another two-year span and drop for a year. And so on indefinitely. The advances of two years, each one followed by a decline of one year, comprise what I call the medium-term counts.”1 —George Lindsay
A long-term interval provides a target range of dates but that range is very broad. “But there must be at least one additional way of counting before any high or low can be established as of prime importance.” For more exact timing, we rely on the Basic Movements. Basic Movements (basic advances and basic declines) are composed of various medium-term counts, also referred to as the Standard Time Spans.
Medium-term counts (whose durations are given in days) and long-term intervals (of 8, 12, and 15 years) are two classes of intervals that must be combined in order to make a forecast. When two counts agree closely, it increases the probabilities of a severe decline. When the end of a Basic Movement and the end of a long-term interval coincide in time, there is a decisive and often violent movement in the market.
The principal time spans are called “basic” and last anywhere from 10 months to three years. The reader has already been exposed to one particular basic advance in the 3PDh formation. Fortunately, the remaining basic advances and basic declines are much more straightforward and are characterized by the length of time (counted in days) for which the advance or decline persists. The duration of the Basic Movements varies but the variations have held within certain limits.
Lindsay’s Rule of Continuity states that when a downtrend ends—either a basic decline or a long-term interval from a high to a low—an uptrend of the same class must begin immediately, and vice versa. We can always begin counting the standard basic durations from any basic high or low. We can also count Basic Movements from “important” highs and lows—the highs and lows that jump off the page at you.
Standard Time Spans
“People say, ‘Times have changed,’ or ‘Conditions are different now.’ Standard Time Spans have remained the same for 190 years. They have always been more nearly uniform than any possible arrangement of the price movement could be.”
Standard Time Spans have been traced back to 1861 in detail and all the way back to 1798. They are called Standard because the same durations have occurred over and over again. They are not identical, of course—they vary within certain limits because they are modified by short-term time spans (i.e., 107-day interval, 3PDh).
The counts that make up each category of time spans (long basic advance, short basic decline, etc.) are not identical, but they tend to cluster together. The numbers are not the same but vary only within certain limits. Throughout history, virtually the same numbers keep cropping up again and again. The Basic Movements method is based on this phenomenon of time spans.
Lindsay identified eight segments of time, which he termed Basic Movements:
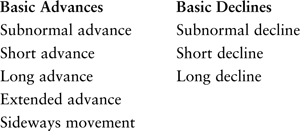
Basic Advances
An advance of about two years is followed by a decline of about one year or a sideways movement. A new advance immediately follows, and so on in unending succession. But the moves are not all equal in length or amplitude. Table 12.1 shows the variations in length. All 3PDh formations are “basic advances” but a basic advance need not take the particular shape of a 3PDh. Note that a basic advance is often the same thing as a bull market, but it may also be only one section of an unusually long bull market.
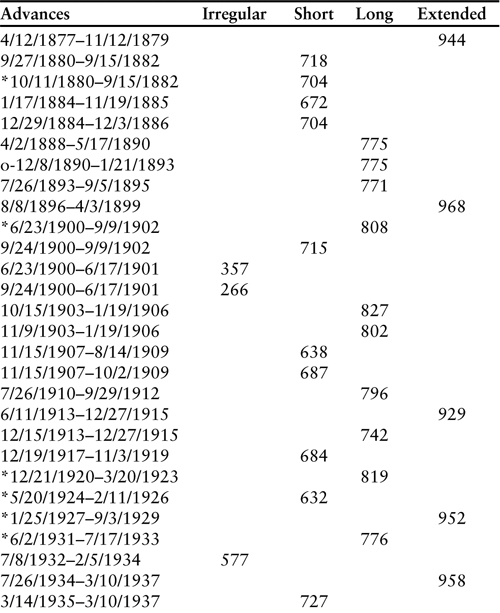
There have been only three genuine advances that have been subnormal: those of 1932–34 (577 days), 1946–48 (615 days), and 1960–61 (414 days). (This observation of Lindsay’s is very interesting because it tends to imply that other subnormal advances that he had listed in various appendixes were only temporary “working counts” used for educational purposes, as opposed to being his final count.)
A short basic advance is about two years or a little less and the average duration is 683 days. A short advance typically varies between 630 and 718 days. Most short advances continue for about 700 days.
The typical duration of long basic advance is roughly two years and two months or 775–805 days and has an average duration of 795 days. It varies between 715 and 830 days.
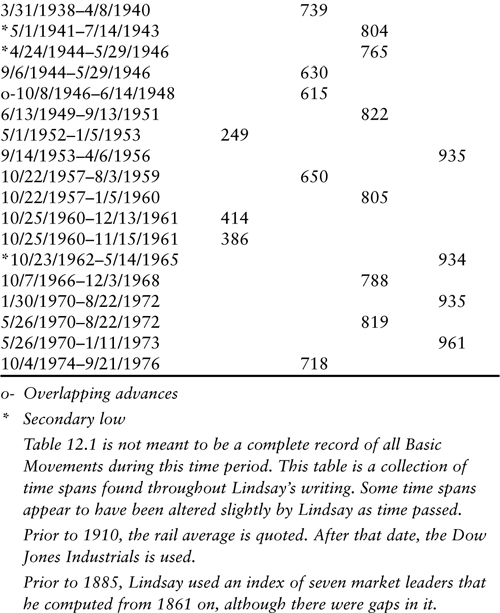
Extended basic advances are the longest continuous advances that are uninterrupted by a bear market. Extended advances range from 929 to 968 days and have an average duration of 953 days. No advance has ever exceeded the extreme of 968 days.
Prior to December 1972, there had been eight extended advances since 1877.
It should be noted that the maximum sideways movement is 348 days or 11 months. The highest point of a sideways movement can come at the start, in the middle, or at the end. The trend is suspended during a sideways movement. Examples of sideways movements can be found in Table 12.3.
Remember: When a basic advance ends, a new basic decline must begin on that same day.
Basic Declines
The subnormal (or irregular) basic decline usually varies between 222 and 250 days and is always less than 300 days.
Short basic declines have varied between 317 and 364 days for an average duration of 345 days. The typical duration of a short basic decline is 340 to 355 days.
Long basic declines range from 376 to 446 calendar days. The typical duration of a long basic decline is 395 to 425 days or 13–14 months. The average duration is 408 days.
Lindsay made note of the tendency of basic declines to include two rallies in succession in roughly the same price range. Lindsay described the rallies during the basic decline from June 1931 to July 1932 this way: “They were just the way the two rallies in the middle of a Basic Decline should look.” He also noted that the two rallies in the April 1930—June 1931 downturn did not occur in approximately the same price range as they theoretically should have. In the majority of cases, the two or three rallies make a series of descending tops.
The subnormal Basic Movement appears regularly in declines and only occasionally in advances. Most of the advances in market history have been of just about normal duration, while many declines have been irregular. While its count varies as much as the other Standard Time Spans, it is interesting how often the 221- to 224-day count appears. Readers will remember that this is the same count as is found in the 3PDh formation. “The interval 221-224 runs all through history. It can extend from a high to a low, from a low to a high, from a high to another high, or from a low to a low.”
Remember: As soon as a basic low occurs, a new basic advance must commence immediately.
Whenever one Basic Movement is extra long or extra short, it is much more likely to be a decline than an advance. This is an important point to remember. There have been many subnormal declines. This is why so many of the basic declines have ended at secondary lows. There was a special reason for each one that could have been calculated ahead of time. Examples of basic declines can be found in Table 12.2.
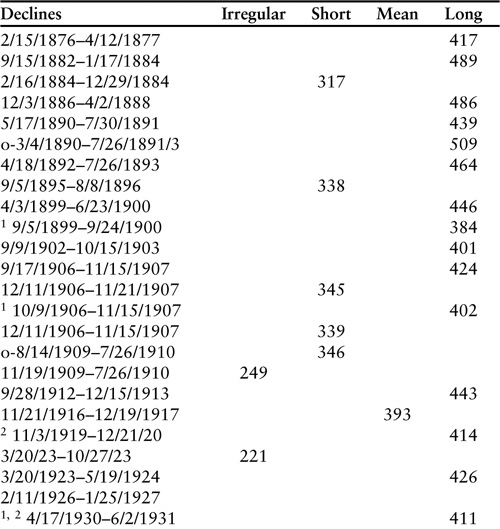
In Tables 12.1 and 12.2, the figures represent the number of calendar days in the market’s main movements since 1876. The time spans for both advances and declines are divided into four groups. The numbers in each column vary in length, but only within fairly narrow limits. All of the advances on record seem to have been cast from just a few molds.
Soon after a basic high has been established and prices are on the way down, we watch for signs of a market low. As soon as a probable low becomes evident, note the length of time that stocks have been dropping since the last basic high. If the elapsed time agrees closely with one of the Standard Time Spans, it is accepted without question as a basic low. It doesn’t matter whether that point is at the very lowest level of the whole decline or not. The practical rule to follow is this: When the market is falling from a high, watch it closely when the downtrend is between 340 and 355 days (the typical duration of a short basic decline) or 395 and 425 days (the typical duration of a long basic decline). If market action suggests that a bottom is being formed, accept that as prima facie evidence that a basic low is at hand. The same holds true for identifying market highs.
Once a Basic Movement (advance or decline) persists for longer than the extreme of that particular Standard Time Span, it should be assumed that it will continue until the next time span. For example, if what appeared to be a short decline has passed the 364-day mark, it should be assumed that it will continue until at least the shortest count of a long decline (376 days). Once a long advance continues longer than 830 days, it can be expected to become an extended advance that has a minimum length of 929 days.
The Principle of Alternation
The Principle of Alternation helps answer the question as to whether we should expect the next advance or decline to be long or short. Since 1798, when one decline was long, the next decline was short and the one after that was long, and so forth. There have been very few exceptions to this principle, and the same holds true of advances. (The 1973–74 bear market was an exception.)
Matching Basic Movements to Long-Term Intervals
By comparing the Basic Movements with the long-term intervals in the foreseeable future, it can be determined whether the current movement should be subnormal, short, long, or extended.
Matching Basic Movements to long-term intervals can also help us to determine the end of the current movement by deciding when the next movement should end. For example, if the current movement is a decline, then it must end in time for the next bull market high (15 years after a low) to arrive after a Standard Time Span. That is, the current decline must end soon enough for a basic advance (using the Standard Time Spans) to run its typical duration and be completed in the targeted time span of a 15-year interval.
Special Rule: Declines Following Extended Basic Advances
One normally starts counting a basic decline from the bull market top. In the case of a decline following an extended advance, however, a Special Rule applies, a rule that has worked consistently all through history: After an extended advance (lasting from 929 to 968 days), the basic decline does not begin immediately. There is a preliminary sell-off, then an effort to regain the high. In Figure 12.1, the basic decline does not begin at the bull market high. Note how prices fell off from January to August in 1973, making several small recoveries on the way down. The average then made a concerted effort to regain its old high on the move from the August low to October 26th. The October high is commonly called the “Right Shoulder.” As a rule, the Right Shoulder does not equal the bull market high, but there have been two cases when a Right Shoulder occurred at a level higher than the Head.
Figure 12.1. Special Rule. Chart created by MetaStock®.
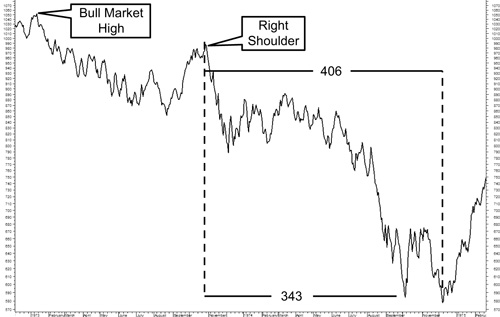
From Table 12.2, it is seen that short basic declines have varied between 317 and 364 days, for an average duration of 345 days. The low of October 4, 1974, was 343 days after the count from October 26, 1973—2 days prior to the average short decline and well within the typical range.
As an alternative, suppose we started counting a long basic decline from October 26, 1973. Long declines range from 376 to 446 calendar days. The average duration is 408 days. Counting forward 408 days from October 26, 1973, arrives at December 8, 1974. The Dow Industrials made their low just 2 days previously on December 6th.
How could we have known the peculiarities of the 1973–74 bear market ahead of time? The key to this enigma lay in the distance between the bull market high (the Head) and the Right Shoulder. If the distance between them is more than five months, the whole decline has often (but not always) been very long.
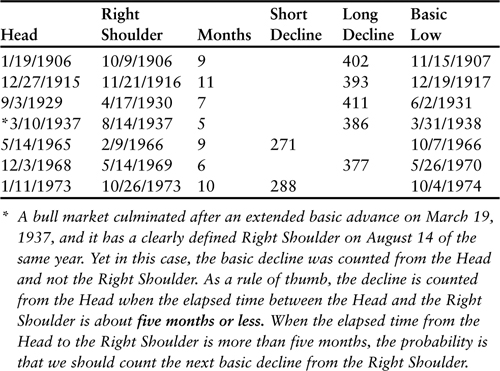
See the following for examples of counts from a Right Shoulder:
Secondary Lows
“I am amazed because few technicians recognize that the length of time that market movements last has always been much more nearly uniform than the number of points which the averages gain or lose. Perhaps it is because, at least in my version of it, I sometimes start counting from secondary highs and lows. But such counts are made comparatively seldom.”
The typical length of a major bear market has always been between 13 and 14 months. Some are shorter and sometimes it lasts longer, but the segment of the downtrend that comes after the 14-month limit has been brief. No matter how long it lasts, there is usually an obvious low between 13 and 14 months after the bull market high—“not just any secondary top or bottom. But the secondary high or low, the one that fairly jumps out at you from a bar chart.” When this is the case, that low becomes the important one. This need not be the lowest point of the whole bear market. It must simply be an obvious low that stands out on a chart. We must start counting the next advance from the low that occurs around month 13 or 14.
When a bear market lasts more than 14 months (in response to a long-term interval that does not, and cannot, coincide with the basic low), we still count from the low that came 13 or 14 months after the previous high. The low at the 13th or 14th month is the key in establishing the continuity. Every time the 13/14-month low has occurred prior to the ultimate bottom, the length of the following long basic advance has varied between 775 and 805 days. In this case, the duration of any rally after month 13/14 is variable; it can continue as long as 5 months. The duration of the rally is a relatively minor matter. The important part is this: Once the period of rallies ends and the market again turns down, the active part of the remaining decline has always been brief—not more than about 3 months. The decline leading down to a secondary low has rarely lasted longer than 101 days.
Sometimes the bear market will last only 8 or 10 months and there is no well-defined low at the month 13/14 at all. In that case, we must use the low as it occurs and let it go at that. This was the case in 1966 when the bear market lasted only 8 months and there was never a clearly defined secondary bottom after that.
While basic declines have often ended at a secondary low, a basic advance nearly always ends at the extreme top. The need to use a secondary high as the top of a basic advance has occurred only once in the past 80 years.
Secondary Low Sequence
Focusing on the direction and time of the market, rather than the number of points gained or lost, the pattern following every one of the secondary lows has been very similar. Figure 12.2 is a composite of the formations that have been completed so far.
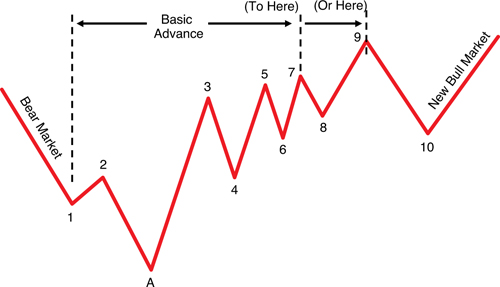
Point 1 represents the end of a standard basic decline, whether long or short. According to Lindsay’s Rule of Continuity, it automatically becomes the low of a new basic advance. Point 2 is the top of the first rally after it. Point A represents the break to a new low. The move from point A to point 3 always took the average well above the level of point 2. After point 3, there has always been a rather deep decline (by intermediate trend standards) to point 4. From point 5 onward, there has always been an extended period of very narrow fluctuations. The period both just before point 5 and just after has always been marked by slow and halting movement. Point 5 goes only slightly above point 3, and point 7 also exceeds point 5 by a relatively narrow margin, although the rise from point 6 to point 7 has usually been of intermediate scope. The basic advance has normally run from point 1 to point 7, and ends there. The basic advance has continued past point 7 only when there is a definite reason for it. It has ended at point 3 only under unusual circumstances, such as 1943. This was because the decline from point 2 to point A lasted an extremely long time—over nine months.
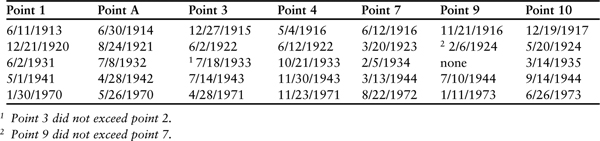
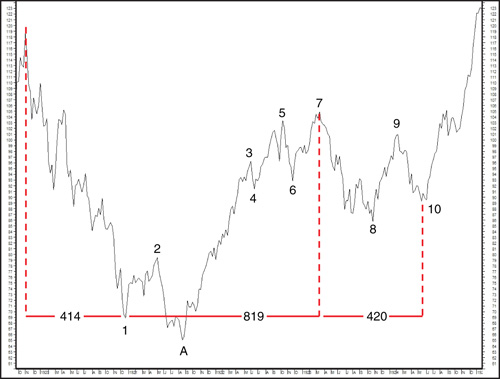
In all of Lindsay’s examples, point 10 lies after a long basic decline (1 year, 1–2 months) after a previous high in his sequence. Those tops are not limited to point 9 but include points 3, 5, 7, and 9.
“I consider the action in 1923-1924 as the most typical example of what the 9 to 10 movement should be....” Figure 12.3 shows stocks dropped 414 days or 13½ months (a typical long basic decline) after the November 3, 1919, bull market top to bottom on December 21, 1920, at point 1. Stocks had to rally and they did, for more than 4 months—longer than they usually do during the course of a single basic decline. Finally, they sank to a new low in August 1921 (point A), decisively under the low of December 1920. The market high, at point 7, was a perfect basic long advance as it counted 819 days from the secondary low at point 1. The drop from point 7 to point 10 was another long basic decline counting 420 days. Note that the basic advance of 819 days is marginally longer than Lindsay’s estimate of 775–805 days following a secondary low that occurs before a final low.
Figure 12.3. Secondary low. Chart created by MetaStock®.
Sideways Movements
Occasionally, an advance ends at the appointed time, but there is an interim period before the next decline sets in. This is an intervening period when the theoretical trend is neither up nor down. Lindsay called the market action during this theoretically neutral period a sideways movement. During this time period, the overall result of price movement is approximately sideways—regardless of what price may do in the interim. A sideways period may be thought of as “a pause in the action while the market is regrouping for the next sustained trend.” A sideways movement may be better described as “extra time” that must be sandwiched in while the average fluctuates back and forth while waiting for the right moment when a continuous trend can begin. This is the chief way in which the Principle of Continuity is interrupted.
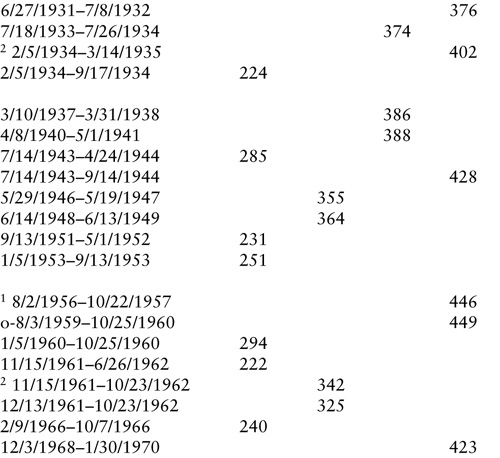
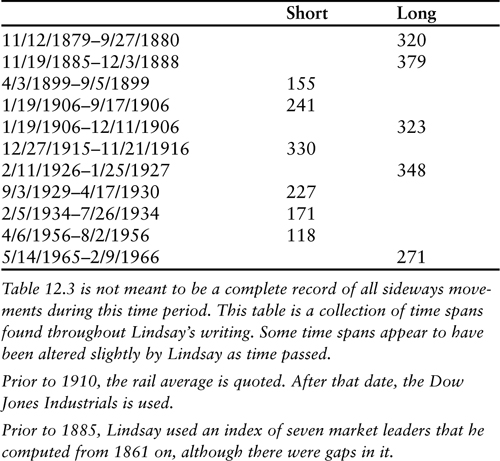
Sideways movements have almost always occurred at a top. A sideways movement starts with a break, a rather sharp one in nearly every case. Then there is a recovery back to the approximate level of the old high. Sometimes the average falls short of the high and sometimes it exceeds it. This is not important. Eleven months has been the maximum duration of sideways movements. There have been shorter ones. It is usually best to start counting the next basic decline (not the 12-year interval) from the top of the last rally in a sideways movement. Examples of sideways movements can be found in Table 12.3.
Table 12.3. Sideways Movements
Lindsay wrote that, since 1842, there had been 40 basic advances. Of these, 31 were followed by recognizable basic declines and 5 were followed by sideways movements. There have also been several minor sideways movements.
Important Rule: The basic decline following a sideways movement begins at the very end of the movement, regardless of whether that was the highest point. But when we count a 12-year interval from a sideways movement, it always begins from the highest point, no matter where it is located.
It is essential to know when there will be a sideways movement. The long-term intervals are the best guide. Following the bull market high of December 3, 1968, the Dow dropped for 14 months until January 30, 1970 (see Figure 12.4). This was the key point from which to count even though the Dow rallied for 2 months after that, until April, and then continued declining until arriving at a lower low on May 26th.
Figure 12.4. Sideways movement. Chart created by MetaStock®.
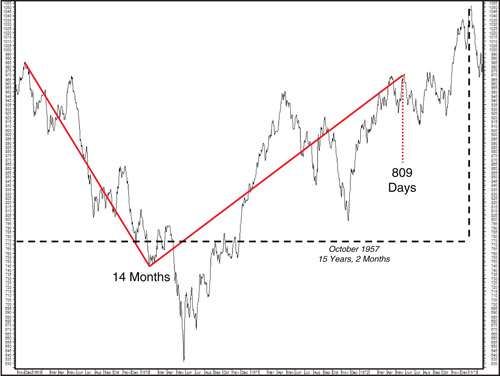
The next important high was expected somewhere between March 14th and April 14, 1972, 775–805 days after the January 30th secondary low. As it was, the high was 4 days late on April 18th.
The way in which the short- and long-term segments of time fit together suggested that there was to be a sideways movement in 1972. Counting the 15-year interval forward from the low of October 22, 1957, targets a period between October 23, 1972 (15 years) and September 22, 1973 (15 years, 11 months). Our rule of thumb count, 15 years, 2 months, targets December 22, 1972, and the actual high was printed on January 11, 1973—15 years, 2 months, and 20 days after the 1957 low.
Moving Upward Out of a Sideways Movement
“Only twice in history—in 1880 and in 1927—has a basic advance started upward at the end of a major sideways movement. On both occasions, it was followed by a drastic bear market, each one consisting of two complete Basic Declines, which followed one another with only a brief rally in between.”
Normally the market declines after a sideways movement. Only twice in history has a new basic advance begun at the end of one. It was the formation in 1926 that inspired Lindsay with the concept of the “sideways movement.” The break in February and March of that year was much too short to constitute a basic decline.
The first time was 1880; the market had risen to a basic high on November 12, 1879, and then moved sideways until October 11, 1880, when stocks were still below the 1879 top. The market then moved upward from the sideways movement and the bull market high was printed on May 26, 1881. But the basic advance did not end until September 14, 1882, when many market leaders made new highs. This was 704 days after the end of the sideways movement—the typical duration of a short basic advance.
“My index of seven market leaders then declined until 1/21/1884, making the downtrend last 494 days, the longest Basic Decline on record. Until 1927, this was the only case when a Basic Advance began at the end of a Sideways Movement.”
Bear in mind that it was the sideways movements of 1880 and 1926 that hinted at what lay ahead. Disaster looms when a basic advance starts at the end of a sideways movement that lasts 11 months.
Conclusion
The following is a quick summary of this chapter and can serve as a quick reference guide in the future for the reader:
The Rule of Continuity states when a downtrend ends—either a basic decline or a long-term interval—an uptrend of the same class must begin immediately, and vice versa.
Basic declines have a tendency to include two rallies in succession in roughly the same price range.
After an extended advance (lasting from 929 to 968 days), the basic decline does not begin immediately. If the distance between the Head and the Right Shoulder is more than five months, the whole decline has normally been very long.
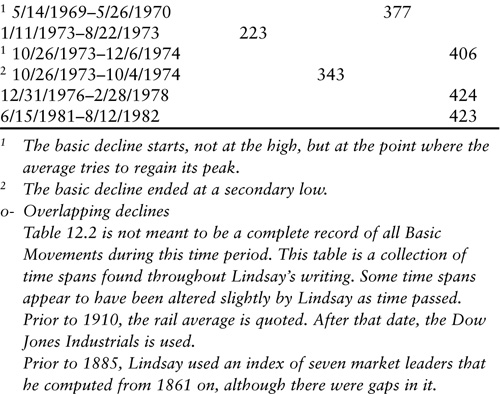
The decline is counted from the Head when the elapsed time between the Head and the Right Shoulder is about five months or less. When the elapsed time from the Head to the Right Shoulder is more than five months, the probability is that we should count the next basic decline from the Right Shoulder.
There is usually an obvious low between 13 and 14 months after the bull market high.
Every time the 13/14-month low has occurred prior to the ultimate bottom, the length of the following long basic advance has varied between 775 and 805 days.
Once a Basic Movement (advance or decline) persists for longer than the extreme of that particular Standard Time Span, it should be assumed that it will continue until the next time span.
Eleven months has been the maximum duration of sideways movements.
Twelve-year intervals count from highs even in sideways movements.
It is usually best to start counting the next basic decline from the last rally in a sideways movement.
Disaster looms when a basic advance starts at the end of a sideways movement that lasts 11 months.
Endnote
1 Unless otherwise indicated, all quotes in this chapter are taken from George Lindsay’s self-published newsletter, George Lindsay’s Opinion, during the years 1959–72.