
Chapter 10. Combining the Counts
“To get a big decline in the market, there must first of all be a Top-to-Top count. Second, the Top-to-Top count must either approximately coincide with an important Low-Low-High count; or, as an alternative, it must expire while the average is in the same trading range.”1 —George Lindsay
Lindsay created four2 categories of how Top-to-Top counts might coincide with LLH counts, and they are presented in this chapter with examples. Not all categories should be expected to produce greater than marginal results. Some combinations are more effective than others. Recognizing the different categories in real time will aid in estimating the depth of an expected market decline. In his original newsletter, Lindsay used examples from 1961 and 1962. This book draws from his original examples. A list of all the Top-to-Top counts in this period can be found in Table 10.1.
Table 10.1. Principal Top-to-Top Counts Between August 1961 and March 1965

Coincident Counts
“When several counts jibe so perfectly we have the ideal setup for a sharp decline immediately.” In this case, Lindsay was referring to counts expiring within 24 hours of each other.
The first task is to locate a Key Range (there are several Key Ranges in the time frame shown in Figure 10.1). The Key Range between May 31, 1962, and June 6th is an example of a Sinking Key Range (a consolidation in a declining market). This key date is an example of a Post Top Count (PTC) because we have identified June 5th as the key date but the high of the Key Range fell beforehand on May 31st. Counting forward 107 days from the key date targets September 20th. This targeted date is two days after the intraday or True High on September 18th, which is well within the count’s five-day window. (As for the high of August 23rd, workable counts have been found for this high, but they don’t coincide within 24 hours; hence, they are not “Coincident Counts.”)
Figure 10.1. Coincident Counts. Chart created by MetaStock®.

The next task in our example is to identify important and minor lows. The extreme intraday low on May 29, 1962, qualifies as an important low. There exist several important and minor lows between May 29th and the targeted date of September 20th. The analyst would be expected to take counts between all of them. The double bottom in late July is a good reminder to not succumb to the temptation of excluding any lows because the second low on July 25th is the low that completes the puzzle. Counting from the day of the extreme intraday low (May 29th) to the minor low in late July (July 25th) yields a count of 57 days. Counting forward 57 days from that minor low in July produces the date September 20th—the exact date produced by the 107-day count and within 2 days of the intraday high of the advance. This count is an important count because it originates at an important low.
Another LLH cycle points to our targeted date. The overt important low on June 25, 1962, counts 43 days to the minor low of August 7th. Counting forward another 43 days from the second low of August 7th targets September 19th, only 1 day after the date of the True High of the advance and 1 day before the 107-day count target of September 20th. Observe that Lindsay used the intraday low on June 25th in this example, but he chose the closing low of August 7th. In July, he used the intraday low, again using his exception for “extreme” intraday lows. Comparing Lindsay’s use of intraday lows versus closing lows begins to give the analyst a feel for what Lindsay considered “extreme” (since he provides no definition), but one should not fail to count through all lows.
Lindsay included a final example that does not belong in this category (Coincident Counts), but the reader would do well to examine it while focusing on this particular Top-to-Top count. This time he counts from the important low of January 29, 1962, and labels the closing low of May 28th (rather than the extreme intraday low a day later) as the second low—a count of 119 days. Counting forward another 119 days points to September 24th. This date is after the decline has started (hence, this LLH interval fails to target a “high”) but is within the 5-day window of the True High. This is an example of how the second date in an LLH cycle may not necessarily be a “high” but can play a role in pinpointing a top.
Clusters
“When the last count of a cluster expires, prices begin dropping at a faster pace—if an important decline is coming at all.”
For this category, Clusters, Lindsay used examples from the Major Top formation of 1961–62 (see Figure 10.2). Major Top formations tend to extend over a multimonth period and are likely to contain several Compact Top formations as this one does. “The second kind of top formation is the long drawn out one.... Each formation of this type usually has two key dates.... Note that these key dates are found far below the highest level of the whole top pattern. Observe how far the key dates of September 25, 1961, and January 29, 1962, dip below the formation.
Figure 10.2. Clusters. Chart created by MetaStock®.
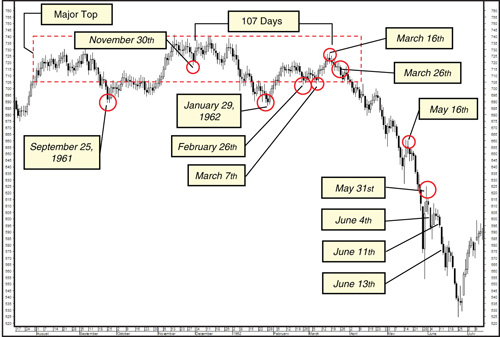
We begin by finding Key Ranges and the key dates within those Key Ranges. The most obvious key date of the Major Top formation lies in a Compact Formation/Double Top and falls on November 30, 1961. It counts 107 days to Monday, March 19, 1962. The True High was printed the previous trading day, Friday, March 16th. True Highs in a 107-day Top-to-Top count are determined by intraday highs.
After identifying key dates and target dates, important lows and minor lows are determined (using closing prices). The minor low of February 26, 1962, counts nine days to the minor low of March 7th. Counting another nine days forward targets the same date as the True High, March 16th. This is not an example of counts coinciding imperfectly because it is a perfect match with the True High and only a trading day away from the targeted date. A minor count, however, is not reliable without an important count to confirm it, and the following important count is an example of counts coinciding imperfectly.
January 29, 1962, is an important low that counts 28 days to February 26th. Counting 28 days forward from February 26th targets March 26th. Lindsay called this imperfect convergence of a 107-day count, with minor and important lows, a cluster. “But a Top-to-Top count must either coincide with some important Low-Low-High count, or else form a cluster with one.” In a cluster, the lows that have been identified need not fall in a symmetrical trading range but do need to remain in the same general area. A cluster seldom lasts longer than five or six weeks. A cluster requires an expiring important count, as do all successful target ranges. Lindsay described the price action of the Dow after the expiration of the Top-to-Top count as merely “drifting off” until March 26th, when the important count expired and the first significant decline occurred. “When the last count of a cluster expires, prices begin dropping at a faster pace—if an important decline is coming at all.” Prices should drop in earnest once the final count in a cluster expires.
Additionally, in this Major Top, we see important lows on both September 25, 1961, and January 29, 1962. They should be expected to form an important count and are 126 days apart. Counting forward another 126 days arrives at June 4, 1962. This targeted date is within 2 trading days of the Sinking Key Range’s intraday high on May 31st. June 4, 1962, saw a vicious break in price but no follow-through was seen until June 11th. Why was that? “Prices never break shortly before a Top-to-Top count is due to expire.” Counting 107 days from the key date of February 26, 1962, pinpoints June 13th, putting June 11th within its ±5-day window. “Prices always rise just before a Top-to-Top count ends.” When several counts combine, this characteristic could cause the range to become a nonsymmetrical cluster.
LLH Counts Only
“There are cases, however, when several Low-Low-High counts coincide. They may then be used without confirmation by any other kind of count.... A big decline within a short time normally occurs only after a Top-to-Top count expires.”
Lindsay was quite definite about his rule that finding only one LLH count was worthless and that it must be combined with a Top-to-Top count. The chart Lindsay used is not included here as the concept is quite simple but bears repeating: “A big decline within a short time normally occurs only after a Top-to-Top count expires.” His earlier statement asserts that a confluence of LLH counts without a Top-to-Top count may be used, but both his example and his statement make it clear that any expected decline will be abbreviated.
Trading Ranges
“When several important counts fail to coincide, but expire within a few weeks of one another, the result is usually a trading range. Whenever this is true, the presumption is that the average will fall under the lowest level of the trading range as soon as the last important bearish count expires—even though the exact day of the break may be determined by a minor count.”
Lindsay made note of this idiosyncrasy at other times too—the tendency of price to hold up until the last minor count has expired. This characteristic applies to all categories.
Another universal characteristic that he felt was worthy of mention: “When a key date occurs in a period of decisive price fluctuations [1/29/62], we can have more confidence that the resulting count will produce a deep decline.” A key date in a Major Top will time the start of a bigger decline that gets underway from a lower level. The count from the second key date in a Major Top is not used to identify a new high. This particular “high” should be expected to be a short-lived bounce and a point from which to expect a renewed decline. In Figure 10.2, counting 107 days forward from January 29, 1962 (the second key date in a Major Top), targets May 16th—1 day after the intraday high of the short consolidation found there. Lindsay also wrote that counts from the first key date in a Major Top are usually of no significance, but the count must be taken anyway because this is not always the case.
Conclusion
“Is it possible to determine in advance which one of the many Top-to-Top counts will result in a major bull market high? This problem has not yet been solved, but there are various ways of arriving at a partial solution, one of which will now be described.”
Lindsay’s “partial solution” was to explain the Cumulative Advance-Decline Line and then show examples of his Timing Model giving signals during divergences between the A-D Line and the Dow Jones Industrial index. “According to our theory, the greatest probability of a major decline will come when there is a divergence between the Advance-Decline Line and the Dow Jones Industrials; and, at the same time, there is a clearcut, easily recognizable Top-to-Top Count.” Lindsay didn’t mean to imply that this was the only method for determining a bull market top, just that it was a method, using a traditional technical indicator, that had worked well for him.
“Every technician dreams of one simple method which will always be an infallible key to the trend of the market. No single cure-all has yet been found. It is possible, however, to achieve a high degree of accuracy by combining several methods.”
Endnotes
1 Unless otherwise indicated, all quotes in this chapter are taken from George Lindsay’s self-published newsletter, George Lindsay’s Opinion, during the years 1959–72.
2 Lindsay listed five categories, not four, but his fifth category, “The Top-to-Top Count in Bull Markets,” was simply a review of what he had already written, with more examples.