
Chapter 6. The Tri-Day Method
“It is called the Tri-Day Method because you need to know the price of the stock average on just three days in order to compute the level of the final bottom. The calculation can be made shortly after the bull market high.”1 —George Lindsay
Lindsay explained his Tri-Day Method (see Figure 6.1) in a series of five supplements to his newsletter from May to September 1959. In them he described a new method of calculating the level of bear market lows using the Three Peaks and a Domed House formation.
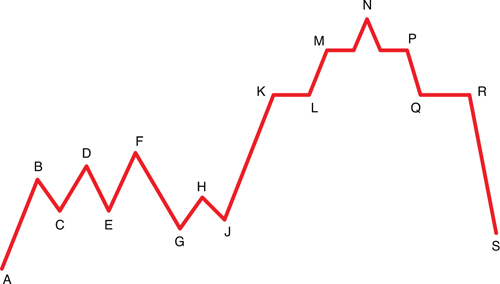
The name “Tri-Day Method” comes from the fact that to forecast the price level of a bottom, what is needed is the level of the average at just three points:
• Point F (the top of Peak Three)
• Point G (the bottom of the Separating Decline)
• Point N (the top of the Domed House)
From these three points, two values are needed to get started:
• (F–G): The extent of the loss from Peak Three to the bottom of the Separating Decline.
• (N–G): The extent of the gain from the bottom of the Separating Decline to the top of the Domed House.
Swingover Ratio
The ratio (N–G)/(F–G) is calculated and referred to as the “Swingover ratio” (S.O.). This Swingover ratio is used as a multiplier. When the Swingover is less than 2, the exact Swingover becomes the multiplier. When the Swingover is 2 or greater, the multiplier is simply 2. The multiplier cannot exceed 2 except in one circumstance: If the highest point in the whole Three Peaks formation (it does not matter which peak is highest) is ten months or longer from the top of the Domed House (point N), then 2.2 becomes the upper limit on the multiplier instead of the customary 2.
Calculation Steps
The target price of the final bottom is calculated using simple math. The steps presented here illustrate the process of determining the targeted bottom:
1. Determine the length of the Separating Decline (F–G).
2. Determine the length of the rally from the bottom of the Separating Decline to the top of the Domed House (N–G).
3. Determine the ratio between steps one and two (the Swingover, S.O.).
A. If it is less than 2, the ratio is the multiplier.
B. If it is equal to or greater than 2, then 2 is the multiplier.
C. If the time between the highest peak and the top of the Domed House is 10 months or longer, 2.2 becomes the upper limit of the multiplier.
4. [(N–G) × S.O.] – (F–G) = the number of points that can be expected to be lost following the top of the market at Point N.
Lindsay wrote that either intraday or closing prices can be used for these calculations.
The 3PDh of 1915–16 provides an excellent, clear example of the Tri-Day Method (see Figure 6.2). Peak Three, or Point F, in the Dow was at 96.08 on March 16, 1916. The Separating Decline took it down to 84.96 at Point G on April 22nd for a loss of 11.12 points (F–G).
Figure 6.2. Tri-Day Method. Chart created by MetaStock®.

During the rise from Point G to Point N at 110.15, the Dow gained 25.19 points. Dividing 25.19 by 11.12 results in a Swingover of 2.26. Given that the highest point in the Three Peaks formation (Peak One on December 27, 1915) was more than 10 months from Point N, the upper limit on the multiplier becomes 2.2. The Swingover of 2.26 is limited to 2.2.
Multiply 25.19 (N–G) by 2.2. The product is 55.42. Subtract 11.12 (F–G) from 55.42 and the difference is 44.30. This is the number of points the Dow will be expected to lose between points N and S.
Subtract 44.30 from 110.15 (N) and the remainder is 65.85. This is the price target of the Tri-Day Method and should be a low of major importance. The actual bear market low on December 19, 1917, was 65.95.
Model 3
Lindsay allowed for three variations, or models, of the 3PDh formation. In Model 1, the three peaks are a series of ascending highs, with Peak Three as the highest. This is the Three Peaks example in Figure 6.1. In Model 2, Peak Three is the lowest peak. In Model 3, the decline from Point D (Peak Two) to Point E is a three-wave affair with an upward reaction, or wave 2, separating two declining waves. The low at Point E lies below the first low at Point C, fulfilling the 3PDh requirement of a reaction to a low below a previous reaction low. From there, prices advance to Point F, which is the highest point of the entire formation. The reaction to Point G holds above the level of E. This is the only model in which the reaction from Point F does not undercut one of the previous two reactions. When the First Floor Wall is retraced almost all the way back to the bottom of the Separating Decline, a Model 3 can be assumed. In Model 3, the downtrend that ordinarily runs from H to J becomes the Separating Decline. In the case of a Model 3 Three Peaks formation, we count from this higher bottom to the top of the Domed House to determine the Swingover (as opposed to counting from the reaction low, which undercut a previous low).
The 3PDh formation of 1951–52 (see Figure 6.3) provides an example of Model 3 when the average dropped from 280.29 at F in August 1952 to 263.06 at G in October, a loss of 17.23 points.
Figure 6.3. Tri-Day Method—Model 3. Chart created by MetaStock®.

The Dow then rose to 293.79 at N on January 5th, a gain of 30.73 points. Divide 30.73 by 17.23. The dividend is 1.78. That’s the Swingover. Since it is less than the upper limit of 2 on the multiplier, the exact Swingover becomes the multiplier.
Multiply 30.73, the gain from G to N, by 1.78. The product is 54.70. From that amount, subtract 17.23, the loss from F to G. The remainder is 37.47. This is the number of points the Dow should lose between N and S.
Deduct 37.47 from 293.79, the price at N. The remainder of 256.32 is the calculated Tri-Day price at S. The actual low of September 13, 1953, was 255.49.
Note that the intraday low at E exceeded the low at C by 0.30 points. Also note that the count was not from this low but from a higher low at G.
Complex Arrangement
Unlike the previous examples, there are times when a more complicated method must be used. A Complex Arrangement occurs when an additional 3PDh is found contained in the First Floor Roof. This situation is often preceded by prices rising gradually in the early stages of an advance. From 1926 to the middle of 1928, from December 1917 to February 1919, and from 1943 to mid-1945, the pattern was the same. The Dow crept up steadily, but the rate of gain was much less than is normal in bull markets. Similar to the Model 3 scenario, the reaction to Point G holds above the level of E. Toward the end of an advance that has proceeded for a year or longer with a subnormal rate of gain, the convention that one of the declines must dip under the low of a previous sell-off is not required.
Whenever a Domed House is complex, the Swingover multiplier must be computed with reference to the Three Peaks contained within the First Floor Roof, the formation nearest to the final top.
The entire movement between the low in June 1928 and the high of 1929 is a Complex Domed House, an initial Three Peaks formation followed by a second 3PDh formation contained within the First Floor Roof (see Figure 6.4). The Dow made a high of 327.08 on May 4, 1929. It dropped to 293.42 on May 27th. This was the Separating Decline of the formation in the First Floor Roof. The loss was 33.66 points.
Figure 6.4. Tri-Day Method, Complex Arrangement. Chart created by MetaStock®.

The Dow then rose to 381.17 on September 3rd, a gain of 87.75 points. Divide 87.75 by 33.66. The ratio is 2.61. That’s the Swingover. Less than 10 months passed between the highest point of the 3PDh formation (May 4, 1929) and Point N the following September, so the upper limit on the multiplier is 2.
In 1928, the Dow was at 220.96 at Point F on June 2nd. It dropped to 201.96 on June 18th, a loss of 19 points. This was the Separating Decline of the Three Peaks pattern that preceded the entire Domed House.
From 201.96 at G on June 18th, the Dow rose to 381.17 at Point N on September 3, 1929, a gain of 179.21 points in the Domed House. Multiply 179.21 by 2. The product is 358.42.
From 358.42 subtract 19 (the loss in the Separating Decline), and the remainder is 339.42. This is the number of points that the Dow is expected to lose between points N and S.
Deduct 339.42 from 381.17 and the remainder is 41.75. That is the projected Tri-Day price at point S. The actual bear market low on July 8, 1932, was 41.22.
Conclusion
“In any given instance, the Tri-Day Method may prove more accurate with one average than with another. It is advisable to make each calculation in two or more averages.”
Not all Three Peak patterns can be used to calculate a low. Some of them must simply be forgotten in the light of later fluctuations. “Market history shows that a formation can be discarded (1) when it is supplanted by another pattern which precedes or follows it, (2) when it is short or imperfectly formed, or (3) when it occurs at a very low level, historically, in the average.” The more flaws there are in the shape and character of the pattern, the less confidence that can be had in the forecast.
The points F, G, K, L, M, N, and so on are to be applied to actual market fluctuations only in retrospect. If someone tries to locate them at the time they occur, he will almost surely be mistaken. It must be emphasized: Projections of point S can be made only after the entire formation is complete.
As soon as it is decided that the formation is a Domed House, it is known that the price average must return to the bottom of the Three Peaks, regardless of what the calculated price is.
Endnote
1 Unless otherwise indicated, all quotes in this chapter are taken from George Lindsay’s self-published newsletter, George Lindsay’s Opinion, May–September 1959.