
Chapter 19. Following the Trend
I’ve heard the number one tenet of investing discussed in a variety of ways:
The trend is your friend.
Trade with the wind at your back.
Don’t fight the tape. (My personal favorite!)
In just about every trading book you will read, you’ll find a core principle admonishing you to always seek to go along with the general market when determining your trade selection. If the general market is trending higher, you should be looking long and willing to buy stocks. If the general market is trending lower, you should be looking to short stocks. The principal is rooted in the fact that markets tend to move in a certain direction for a sustained period of time and that most stocks will follow this trend. In the off chance they might be moving sideways, you will probably hear that you take a step back and wait for the new trend to emerge. A day trader might be concerned with the trend for that particular day only. A swing trader might be concerned with the intermediate trend only or how the market has been moving over the past several weeks. And a passive investor might be concerned only with how the market has been moving over a series of months or even years.
Early in my career, I subscribed to this generalized approach, probably because of how often (and consistently) I saw it discussed. Furthermore, I noticed that when I had a string of losses it typically came from me fighting the general trend. The problem for most investors is how to determine what the general trend is, at the time it is happening. In hindsight, it always seems so simple. You can glance quickly at any chart and see where a stock has been and where it is now to determine the direction of the general trend. When you are trading and seeing the market move on a daily basis, however, this becomes much more difficult. There is always a potential for a great trend change. If the market has been moving higher consistently, you might have a nagging feeling that at any moment the market will plunge to new depths. On the other hand, if the market has been declining, you might believe that at any moment a significant bounce will occur. The internal struggle to actually follow the trend on a consistent basis becomes a big obstacle. Lucky for us, however, there is a simple method that enables us to ensure that more often than not and regardless of time frame we are flowing with the general market. The method I prefer focuses on the 50-day simple moving average.
Moving averages are merely an aggregate of x number of previous days prices filtered into a line graph and plotted on whatever chart you may be reviewing at the time. With a simple moving average, each day’s data carries the same weight in the final tally. If we are calculating a 50-day moving average, you add up the closing prices for the preceding 50 days and then divide the sum by 50 to come up with the current plotted amount. When a day is added to the front end, the oldest data is dropped off the back. (Current charts will plot a moving average of your choosing with the click of a mouse.)
I usually review the S&P 500 daily chart to determine where the index is in relation to its 50-day simple moving average. If the index is above this line, I assume the trend is up and I look for buying opportunities. If the index is below this line, I assume the trend is down and I look for shorting opportunities. If the index and its relation to the 50-day moving average suggest a specific direction but this conflicts with my personal view, I do nothing. Since implementing this rule, I have found that I rarely fight the trend; that is, I rarely short stocks as the market is moving higher, or buy stocks as the market is moving lower. Subsequently, this approach has made a significant positive impact on my P&L.
Many traders take this a step further and develop trading strategies around moving averages. I have not found any edge with this. I prefer to just use the moving average as a basic guideline when approaching any trades I may be considering.
Even passive investors taking a longer term approach can immediately improve their results by following a similar guide and reviewing the market in relation to its moving average on a weekly basis to determine whether they should be long the market. Unlike a 50-day moving average, a 50-week moving average plots a line using the previous 50 weeks or almost one year of market movement. Because of this longer-term approach, the line does not change as quickly and can give you a great sense as to what direction the larger trend is heading. As an outside exercise, review the S&P 500 weekly chart along with the 50-week simple moving average over the past 10 years. You will quickly see how adhering to this simple guideline would have taken a passive investor out of the market before both the 2000–2002 decline and the 2008 decline. Once the S&P 500 punctured the 50-week moving average in 2000, it did not recapture this line until May of 2003. Once the S&P 500 punctured the 50-week moving average in 2007, it did not recapture this line until July 2009. Most passive investors would have loved to be out of the market during these two declines. In fact the last puncture of the 50-week moving average was January 2008 and is flirting with another thrust below this level as I am writing this book. I have plotted this on Figure 19.1 for reference.
Figure 19.1 S&P 500 in relation to its 50-week moving average.
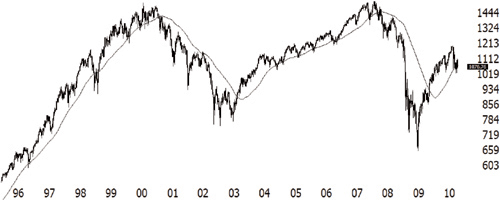
Chart courtesy of Worden–www.Worden.com.
Of course, there are times like in 1998 when the market may break this 50-week moving average only to return to this level a few months later before another strong run that goes higher. It is my view that a whipsaw like this is a small price to pay to remain disciplined and protect capital during what may become a significant bear market.
Sometimes my chart work yields trading opportunities in the opposite direction of the general market trend, as noted by the 50-day moving average. Over the years, I have learned to pass on these trades. I typically call these stocks needles in the haystack. Despite what might look like a lucrative opportunity, I have learned that it is much more profitable to trade the haystack.
As you mature as a trader, you might find other indicators to help you determine in which direction the general market is trending. The 50-day simple moving average rule is a basic first step that will ensure you are at least on the proper path. Following this rule will rarely place you on the wrong side of the general market trend.