
Chapter 11. Long-Term Cycles and Intervals
“My version of cycles is different. I call them intervals. They are counted from a low to a high or from a high to a low. I project a movement to a point in the future which exists only in theory, the same as in cycles. But when I come to calculate the movement after that, I don’t begin from the theoretical crest. I start counting from a high which the market has actually made. That’s the difference between cycles and intervals.”1 —George Lindsay
Lindsay’s counting method can best be described as a funnel approach. His analysis starts with a long-term interval that provides a wide range of time as a target. He then narrowed down that target using other, shorter intervals that provided shorter target time ranges within the larger ranges. During an appearance on Louis Rukeyser’s television program Wall Street Week on October 16, 1981, when Lindsay was asked, “When do we get out of this bear market and into that bull market?” he replied, “The end of the bear market; the earliest I can count it is about August 26, 1982.” The intraday low of the bear market occurred on August 9, 1982. The methods in Part IV, “The Counts,” are those methods he used to make that calculation.
Long-Term Cycles
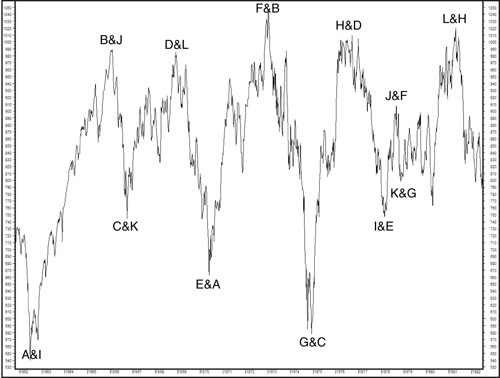
Long-term cycles were Lindsay’s attempt at classifying the market’s major lows throughout history. Figure 11.1 is Lindsay’s characterization of the recurring pattern of each of three long cycles he believed the market exhibited between 1798 and 1949. There have been variations from one cycle to another but they were minor. Lindsay held that the essential pattern was remarkably persistent for 150 years. The shape of the patterns may appear differently in a chart but the timing remains the same. It is only the shape of the chart patterns that looks different.

The period from A to E lasts roughly seven years. It is an entity in itself. It is the first section of what he called the long cycle. Note that the two advances from A to B and from C to D are separated by only a shallow decline. Next comes a big decline from D to E. The low at point E is a dividing line.
The second section of the long cycle runs from E to M. The duration of the second section is variable, but is much longer than the first. As a rule, the 3PDh formation has occurred at the end of each long cycle. It runs from K to M, which is always a low of the first importance. The low following a 3PDh pattern, point M, then becomes point A to begin the next cycle. Lindsay allowed for multiple (two, and sometimes three) long cycles to run simultaneously. At any point in time, the cycles would be at different points in their progression.
The first two advances after point A are normally strong moves, and one of the two has invariably been extremely strong. Following point A in 1962, there were two very strong advances, the first ending in 1966 and the second in 1968. According to a different, simultaneous cycle, the 1962 low was point I. Advances following point I are only moderately strong. According to this strain, the next advance from 1966 to 1968 was to be the 3PDh formation.
Notice that the first (B–C), third (F–G), and fourth (H–I) declines are mild and the second (D–E), fifth (J–K), and sixth declines (L–M) are severe. All of the bear markets between 1949 and 1966 occurred when only one of two simultaneous cycles predicted a deep decline. This was true in 1957, 1960, 1962, and 1966. In each of these cases, one cycle indicated a severe decline, while the other showed a mild decline at the same time. Not until 1969 did both of the diagrams indicate a severe decline at the same time. That’s why the 1969 bear market was the most severe since before WWII. Lindsay didn’t expect another deep decline in the markets until 1977–78 (and again in 1980–81). It is not known how he responded to the decline of 1973–74.2 Lindsay did correctly write, “But a great change will come in 1975. From then until 1981, both lines will be relatively weak most of the time. There will never be any one year as bad as 1969 [obviously incorrect], but taking the five year period as a whole, the outlook is more bearish than anything the market has seen since the 1930’s.”
Figure 11.2 labels two simultaneous cycles running from 1962 to 1982.
Figure 11.2. Long cycle. Chart created by MetaStock®.
The long-term cycle pattern has one primary purpose: to recognize long-term intervals. There are three long-term intervals to keep track of. The first lasts 8 years, and it runs from a low to a high. The 8-year interval starts at point E and ends at point J. Remember that J may be lower than H. That makes no difference. An interval is not a trend. It need not end at the highest point of the whole sequence. The 8-year interval can start at any other points from A to M but occurs most frequently from E to J, C to H, and K to D. The latter two counts occur frequently but are not as reliable as from E to J.
The second long-term interval lasts 15 years and also runs from a low to a high. The elapsed time from A to J is normally 15 years. The span from point E to point D in the next cycle is also about 15 years, but in this position, the interval can stretch to 16 years. You can also count the 15-year interval from point K to point H in the next cycle.
The third long-term interval is the only interval of the three that runs from a high to a low. It varies between 12 years, 2 months and 12 years, 8 months. There are two high points from which it normally works quite well. That is, it is easy to recognize and ends at an important low. Count the 12-year interval from point D, and it usually ends at point M (see March 1937–June 1949). The 12-year interval also runs from point J to point E in the next cycle.
Long-Term Intervals
“But the intervals have been examined all the way back to the eighteenth century. The first one uncovered ran from 1798 to 1813.”
An “interval” is simply the elapsed time from an important low to an important high or from a high to a low. It is called an interval because we ignore the fluctuations in between. It doesn’t matter what its overall trend was while the interval was in progress, or how many times it changed, or whether it ends higher or lower than the level at which it began.
The two most important long-term intervals have always consisted of 15 years (from a bottom to a top) and 12 years (from a top to a bottom). The spans are not exact. The 12-year interval has usually varied between 12 years, 2 months and 12 years, 8 months. The latitude of the 15-year interval has been somewhat wider: anywhere from 15 years to 15 years, 11 months. All things being equal, 15 years, 2 months to 15 years, 4 months may be considered the norm. This does not mean that the trend of prices was up during a 15-year interval or down during a 12-year interval. An interval is considered down if it runs from a high to a low and vice versa. The relative level of prices at the turning points has no bearing on this matter. For example, a 12-year interval starts at a high and ends at a low, but the 12 years may have evolved over a long bull market and the ensuing low could be higher than the original high.
15-Year Interval
“The most important long-term interval lasts about 15 years, or somewhat longer. It is counted from every bear market low, and occasionally from an intermediate low which stands out on the chart of the average with more than the usual prominence. The 15-year interval always ends at a high of some sort.”
We start counting 15-year time spans from any important low. There should be a high at the end of the count. The long-term intervals do not help much in fixing the exact time reversals. Their value lies in estimating the importance of the next move. An important high occurred on July 12, 1957. We know it was important because it appeared 15 years, 2½ months after the epochal low on April 28, 1942. These long intervals do not try to pick the exact “address” of a high or a low. Rather, they attempt to identify the correct “zip code.” Sixteen years, 3 months was the longest 15-year interval on record, and 14 years, 9 months was the shortest.
“There is a latitude of 11 months or more between the shortest 15 year interval and the longest. One may ask “what good is a measurement so inexact that it may be off by as much as 11 months?” The answer is that the 15 year interval is used to gain perspective and not to determine exact timing. To narrow down the time span in which the high must fall, we compare the 15 year interval with the shorter-term counts.”
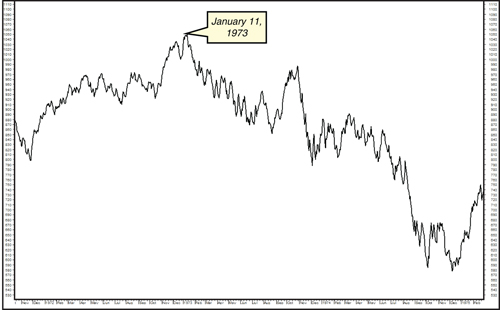
As part of his Annual Forecast for 1972 (published in the Stock Traders Almanac), Lindsay wrote, “One long-term measurement calls for a major top 15 years, or a little more, after the bear market low of October 22, 1957. It is a way of counting which has usually proved reliable, but it is not exact. Since this is being written in July 1971, sixteen months before Election Day, the more detailed timing methods are not yet available for use. But one of them can already be applied and it places an important high about November 10, 1972, thus coinciding with the 15-year interval and the election.” It is apparent, from Figure 11.3, that the high of the bull market came just shy of 15 years, 3 months after the 1957 low and only 2 months later than Lindsay’s forecast based on a 15-year interval. Examples of the 15-year interval can be found in Table 11.1.
Figure 11.3. The 15-year interval. Chart created by MetaStock®.
12-Year Interval
The corresponding interval from an important high to a low is 12 years plus a few months. A low usually lies somewhere between 12 years, 2 months and 12 years, 8 months.
Examine the long-term interval from high to low that began on December 13, 1961. According to precedent, it should have ended not later than 12 years and 8 months afterward. That would place it in August 1974. There have been only two occasions in the past 100 years when it exceeded that duration materially. One was in 1970 and another in 1974. In both cases, the time elapsed was 12 years, 10 months. So, the low of 1974 came 2 months later than it should have. An overrun of 2 months is not excessive when we are referring to a span of 12 years or so.
Important: At a minimum, a 12-year interval is followed by a rally lasting seven months or a little more.
Figure 11.4 is a partial re-creation of a chart that Lindsay presented in one of his newsletters. It illustrates both the Principle of Continuity (when an upward interval of 15 years ends, a downward interval of 12 years must begin, and vice versa) and how multiple intervals are simultaneously functioning and overlapping.3 See Table 11.1 for a sampling of 12-year intervals.
Figure 11.4. Long-term intervals. Chart created by MetaStock®.
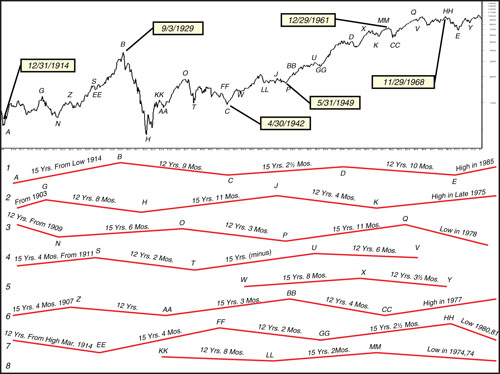
Table 11.1. Long-Term Intervals

Table 11.1 is not meant to be a complete record of all long-term intervals during this period. This table is a collection of time spans found throughout Lindsay’s writing. Some time spans appear to have been altered slightly by Lindsay as time passed.
8-Year Interval
“If we count, not just from an ordinary bear market low, but from a really epochal bottom, there has always been a sharp break eight years later—a break so deep and rapid we can say that both an important high and an important low came within two or three months of each other. The crash of 1929 came eight years after the 1921 low. Eight years after the all-time low of 1932, the market really plummeted in May-June 1940, when Germany invaded France. The low of 1942 marked the end of a five year bear market, and stocks plunged in June-July 1950, when the Korean War broke out. The break of 1957 came eight years after the major low of 1949. When we count eight years from the low of 1962, we come to the spring of 1970, and again the market took a nose dive. The distinguishing feature of all these declines was not simply their depth, but the fact that an important high and important low appeared only two or three months apart.”
The 8-year interval doesn’t try to pinpoint bull market highs necessarily; rather, it attempts to find points at which a sizable drop should be expected. The targeted drop may be at the top of a bull market (1929) or it may be the last drop of a bear market (1970) or anywhere any in between (see Figure 11.5). There has always been a sharp break that lasts only 2 to 3 months, and then a quick recovery that continued for some time, usually at least 5 months. All of Lindsay’s examples were contained within a period of 7 years, 9 months to 8 years, 2 months. A rule of thumb says to count 8 years to 8 years, 2 months. Although it is natural to use this particular long-term interval to help find market sell-offs, one should not overlook a point that Lindsay took care to emphasize: “In every case, an important high and an important low appeared in the span of only two or three months.”
Figure 11.5. The 8-year interval. Chart created by MetaStock®.
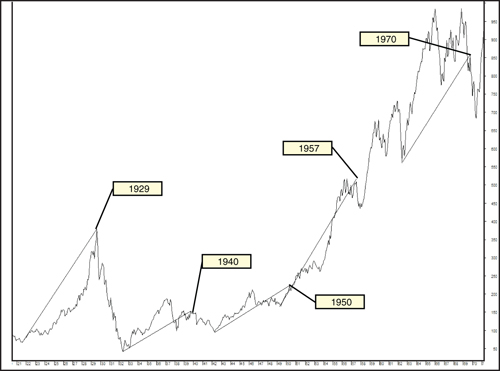
Some lows have the characteristics of both a point A and a point E in the long-term cycle. Eight years after one pair of these simultaneous lows, both a market top and bottom in rapid succession are found, and both of them are reversals of some importance. For example, 1929 came eight years after 1921, and the 1921 low had some of the characteristics of both a point E and a point A. There was a drastic break from September 3 to November 13, 1929. A strong advance began immediately and continued for five months. Thus, an important high (September) and an important low (November) both appeared just about eight years after the 1921 low. There are many examples of this. The spring of 1970 came eight years after the low of June 1962, which had some of the features of a point A and also a point I. Basically, any low in the long-term cycle, other than a low during a 3PDh formation, is usually followed by a high eight years later—provided that the low is decisively formed on a chart.
The 12- and 15-year intervals are merely a way of roughly calculating the long-term probabilities of the market. They are not exact. There are two other ways of estimating future turning points on the basis of time alone. One is Counts from the Middle Section, which is covered in Chapter 13. The other is called the Basic Movements and is composed of the Standard Time Spans. They are called “standard” simply because approximately the same number of days has kept cropping up, time after time, throughout market history. The Standard Time Spans are not as accurate as the counts from the Middle Section (when they occur) but much more so than long-term intervals. The Basic Movements are covered next in Chapter 12.
Conclusion
The following is a quick summary of this chapter and can serve as a quick reference guide in the future for the reader.
Long-Term Intervals
It doesn’t matter what the overall trend was while the interval was in progress, or how many times it changed, or whether it ends higher or lower than the level at which it began.
15-Year Interval
Runs from a low to a high.
The 15-year interval varies from 15 years to 15 years, 11 months.
12-Year Interval
The 12-year interval has usually varied between 12 years, 2 months and 12 years, 8 months.
At a minimum, a 12-year interval is followed by a rally lasting seven months or a little more.
8-Year Interval
Runs from a low to a high and attempts to find points at which a sizable drop should be expected.
An important high and an important low appear in the span of only two or three months apart.
The 8-year interval has varied between 7 years, 9 months to 8 years, 2 months.
The sell-off is followed by a quick recovery that continues for some time, usually at least five months.
Endnotes
1 Unless otherwise indicated, all quotes in this chapter are taken from George Lindsay’s self-published newsletter, George Lindsay’s Opinion, during the years 1959–72.
2 Lindsay wrote the paper from which this information derives in 1970. He had expected points F&B to arrive in 1972, G&C in 1973, H&D in 1975, I&E in 1976, J&F in 1977, K&G in 1978, L&M in 1980, and M/A&I in 1981. The author has realigned the dates using Lindsay’s Three Peaks and a Domed House method.
3 Lindsay mistakenly labeled point S, February 11, 1926, as 15 years, 4 months after the 1911 low when it was actually 14 years, 4 months. Unfortunately, we have no way of knowing whether recognizing this mistake might have affected his analysis. He also labeled point MM as 15 years, 2 months after the late 1946 low when it was only 15 years, and point CC as 12 years, 4 months after the 1950 high even though it was 12 years exactly.