
Chapter 13. Counts from the Middle Section
“The first original idea I ever had on the stock market remains the best. In 1950, I published a copyrighted pamphlet ‘An Aid to Timing’ which introduced the concept of the ‘Middle Section.’ The pamphlet sold well and I received so many letters that I was encouraged to start a market letter of my own the following year on a capital of $600. Since I have never been a big advertiser, it is remarkable that I have lasted in the business for 23 years. I could never have done it without this method. In all the years since then, I have mentioned the principle [of the Middle Section] only once in my advisory letter. Counts from the Middle Section are my prize way of calculating time in the market.”1 —George Lindsay
Nearly every major advance in the stock market has a “Middle Section.” This method has been traced back to 1861. The majority of Middle Sections (Ascending and Declining) have continued for 20 weeks or even more. But there have been short Middle Sections in the past, too, especially when they are used to project a low.
A Middle Section is defined by two reactions that interrupt the uptrend. In Figures 13.1 and 13.2 (Lindsay referred to these as “typical schemes”), these two declines are marked as point B to D and from point G to H. In between the two reactions are several smaller rallies. There must be at least two of them, and there may be more.
Figure 13.1. Ascending Middle Section.

Figure 13.2. Descending Middle Section.
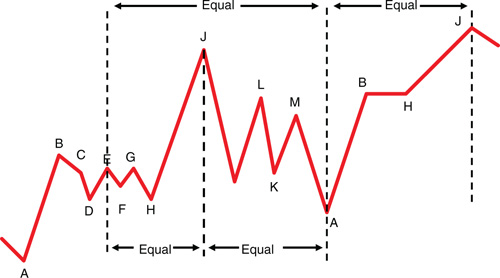
One prime requirement of a Middle Section is that the overall pace—the rate of gain during the advance—must slow during the course of these small rallies. The slope of the trendline must decrease during a Middle Section as compared to what it was before and after. During a Middle Section the market must gain less ground than it did between points A and B and between points H and J. The whole movement from A to J is a “basic advance.”
Point B is the top of an important advance. The average usually spends several days making a minor top formation. Point C is the “first really weak day after a top.” On this day, the average usually falls cleanly under the low of the minor top formation to form a bottom at point D. During the following advance, the three rallies (E, F, and G) need to be clearly demarcated from one another. Point G is the last rally, point F is the next-to-the-last rally, and point E is the second-to-the-last rally. The decline from point G to point H (in an Ascending Middle Section) is typically longer than the reaction following point F. It can become a Descending Middle Section in its own right, provided that it contains two rallies at about the same price level on the way down. Point H is the end of the Middle Section. Point J may or may not be the top of a complete bull market. Lindsay never indicated if the remaining points in his “typical schemes” held any significance.
When the small rallies within a Middle Section exceed the high at point B, it is called an “Ascending Middle Section,” as shown in Figure 13.1. When the small rallies fall short of the level at point B, it is called a “Descending Middle Section,” as shown in Figure 13.2.
Note that in a Descending Middle Section, point F becomes a bottom rather than a top as in the Ascending Middle Section. This makes point E the next-to-the-last rally in a Descending Middle Section, rather than the second-to-last rally as in an Ascending Middle Section.
The same basic advance may contain two separate Middle Sections that are entirely disconnected from each other. It doesn’t matter whether one is ascending and the other is descending, or whether both are of the same variety. The Middle Section cannot be used to compute the high of the bull market in which it occurs. It must be used to calculate the time of the next bear market low or the high of the bull market after that. These counts are used to target lows and highs far into the future. These counts don’t always work but, when they do work, they do so with amazing accuracy.
All counts from Middle Sections are equal distances in time. If the time span originates at a low, the result will be a high. If it originates from a high, the result will be a low. When counting from a Middle Section, counting from either point C or point E is correct, but never both in the same instance. The correct count has originated at point E in the great majority of cases so it always pays to start there. When counting, Lindsay normally used closing prices but he noted that closing, or intraday prices, tend to work equally well. A count from points C or E in a Middle Section must conclude on the absolute high or low of a basic advance or decline; there is no use of secondary lows.
Combining Standard Time Spans with Counts from the Middle Section
“Whenever an equidistance from a Middle Section has coincided with one of the time spans listed [in Tables 12.1 and 12.2] I have automatically considered that point as the end of the Basic Advance (or Basic Decline).”
The Standard Time Spans can be used alone, but it is much more accurate to combine them with the counts from the Middle Section and with the long-term intervals. The Standard Time Spans are more reliable than counts from the Middle Section, but the latter, if computed accurately, are much more exact. Both should be used in combination.
The target derived from a count or “equidistance” from point C or E in a Middle Section is valid only if the result falls within the targeted range of one of the Basic Movements. Sometimes, neither the count from point C nor the count from point E in the same Middle Section works at all. In that case, we simply have to rely on the less exact basic advances and basic declines. The Standard Time Spans are often useful, even essential, in deciding whether to count from point C or E in a Middle Section.
Ascending Middle Sections
The break from point B to point D is almost always deeper than the break that terminates at point A. When that is not clear, look for a clearly defined point C. When one rally is much smaller than the others in an Ascending Middle Section, it is almost invariably the first rally of the three (rally E). The break from point G to point H should lose more points than the break following point F. If the advance from point E to point F is an extremely long one, then a decline from point G to point H, which is longer than the break following point F, is very likely to become a Descending Middle Section itself when considered in isolation.
Figure 13.3 shows a daily chart from 1951 and a Middle Section in detail. It is an Ascending Middle Section because point G exceeded the level at point B, the top of the previous sustained advance. In every Middle Section, there are always two possible points from which we count time. One such point is point E. In an Ascending Middle Section, point E is always the second-to-the-last rally. That day was April 6, 1951.
Figure 13.3. Middle Section, 1951. Chart created by MetaStock®.
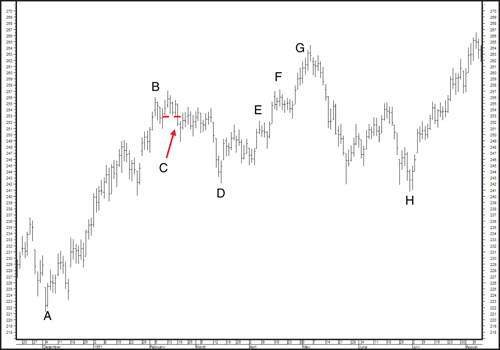
Counting from E to the next important low, September 14, 1953, is 892 days. Referring to the table of basic advances (see Table 12.1), it can be seen that no market advance has ever lasted anything like 892 days. One group of advances has continued from 765 to 830 days, while another has lasted from 929 to 968 days—but nothing in between.
In this case, point C is the other possible measuring point in the Middle Section of 1951. Point B is the top of an important advance. The average usually spends several days making a top formation. In Figure 13.3, point B was February 13, 1951. The Dow held a narrow range for the next four days, creating a minor top formation. The average had a relatively large loss on February 19th and fell cleanly under the low of the minor top formation. This was a perfect example of point C, the first really weak day after a top.
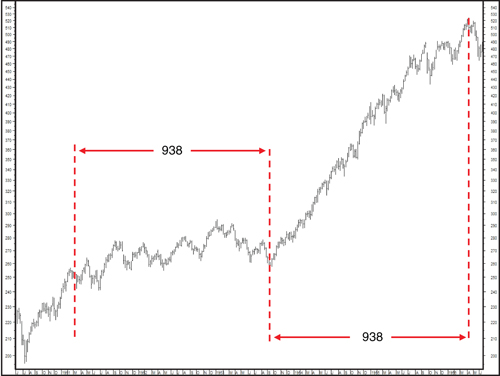
Point C was 938 days before the bear market low in September 1953. Counting forward another 938 days targets Monday, April 9, 1956, as a top for the bull market. The Dow made its intraday bull market high that Monday and its closing high the previous Friday (see Figure 13.4).
Figure 13.4. Middle Section, 1956 market top. Chart created by MetaStock®.
Descending Middle Sections
A Descending Middle Section is essentially a downtrend in a long bull market. The downtrend must be interrupted by two small rallies at about the same level and must then continue still lower. When there are three rallies, one of them (usually the last, but it was the first in 1937) is either brief or inconsequential.
After falling until June 10, 1965, the Dow rose one day, fell one day, and then rose for three days to culminate on June 17th. Two distinct rallies in the same price range, and the average subsequently fell lower (see Figure 13.5). This fulfills the essential requirements of a Descending Middle Section. As a rule, the rallies in a Middle Section last longer but the essential requirement is a sharp break between the two rallies of a Descending Middle Section.
Figure 13.5. Descending Middle Section, 1965. Chart created by MetaStock®.

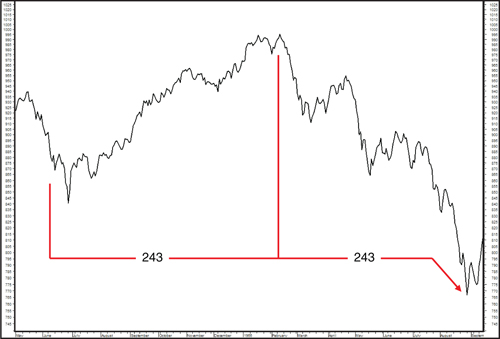
Counting from point E of the Descending Middle Section to the top of the market advance on February 9, 1966, is 243 days. Counting forward another 243 days targets a low on Monday, October 10, 1966 (see Figure 13.6). That Monday was the exact date of the intraday low and the previous Friday was the closing low of the 1966 bear market.
Figure 13.6. Descending Middle Section, 1966 market bottom. Chart created by MetaStock®.
Conclusion
The following is a quick summary of this chapter and can serve as a quick reference guide in the future for the reader:
The overall pace—or the rate of gain during the advance—must slow down during the course of the Middle Section.
Point E is the second-to-the-last rally in an Ascending Middle Section and the next-to-the-last rally in a Descending Middle Section.
The correct count has originated at point E in the great majority of cases, so it always pays to start there.
Normally, the count from either point C or point E works—but not both of them.
A Descending Middle Section contains two rallies at about the same level prior to the bottom.
In an Ascending Middle Section...
...when one rally is much smaller than the others in an Ascending Middle Section, it is almost invariably E.
...the break from point B to point D is almost always deeper than the break that terminates at point A.
...the break from point G to point H should lose more points than the break following point F.
Endnote
1 Unless otherwise indicated, all quotes in this chapter are taken from George Lindsay’s self-published newsletter, George Lindsay’s Opinion, during the years 1959–72.