
4. How Major Market Bottoms Form: Part I, Panic and Capitulation
Chapters 2 and 3 focused on the life cycle of a major market uptrend and the subsequent formation of a major market top. Major market tops are characterized by distribution, that is, well informed investors liquidating shares of stocks in anticipation of lower prices in the coming months. Distribution is then followed by the markdown phase, which is the bulk of the bear market itself, or the process of stock prices trending lower. The markdown process can vary greatly in length. For example, the decline from the 1929 high lasted three long years, while the bear market of 1998 was a mere three months. As the markdown phase nears its end, signs of the final phase of the bear market—the all-important panic stage—emerge. Identifying the panic phase is critical, as it is quickly followed by the accumulation stage of the bear market bottom, during which investors begin the process of snapping up what they now perceive to be bargain-priced stocks. Recognizing the accumulation phase is particularly important because it is during this time when stocks should be purchased so that investors may reap the benefits of the developing bull market.
The Life Cycle of a Market Downtrend (a.k.a., A Bear Market)
By the end of a bull market and start of a new bear market, Demand has been exhausted, and Supply is the dominant force driving price action. As anyone who has taken a basic course in macroeconomics knows, when Supply is greater than Demand, prices fall. In the case of the stock market, the dominance of Supply results in a prolonged period of price deterioration. The psychological aspects of a stock market decline are described in Paul Desmond’s Dow Award winning paper “Identifying Bear Market Bottoms and New Bull Markets”:
Important market declines are, for the most part, a study in the extremes of human emotion. The intensity of their emotions can be statistically measured through their purchases and sales. To clarify, as prices initially begin to weaken, investor psychology slowly shifts from complacency to concern, resulting in increased selling and an acceleration of the decline. As prices drop more quickly, and the news becomes more negative, the psychology shifts from concern to fear. Sooner or later, the fear turns to panic, driving prices sharply lower, as investors strive to get out of the market any price. It is this panic stage that drives prices down to extreme discounts—often well below book values—that is needed to set the stage for the next bull market.1
Just as bull market tops tend to follow similar patterns of distribution, major market bottoms tend to follow similar patterns of accumulation, reflecting the process of Demand overcoming Supply. While Richard Wyckoff identified these various stages of the idealized market bottom, L.M. Lowry’s methods of identifying changes in the longer term trends of Supply and Demand provide a means for quantifying the stages identified by Wyckoff.
This chapter discusses the capitulation or panic phase of the bear market and the initial stage of accumulation, and Chapter 5, “How Major Market Bottoms Form: Part II, Accumulation and Breakout,” details the characteristics of the final stages of accumulation and the evolution of a new bull market. In the course of our discussion, we draw from both Paul Desmond’s white paper and Wyckoff’s Stock Market Correspondence Course, as offered by the Stock Market Institute. Wyckoff’s descriptive terms for the final phases of a bear market and early signs of accumulation are shown in Figure 4.1.
Figure 4.1. Wyckoff’s key points for identifying a major market bottom
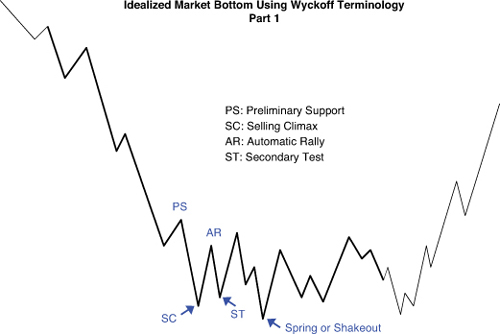
The first point of reference in the formation of a major market bottom is referred to as Preliminary Support (PS). Prior to the development of PS, negative momentum has tended to feed upon itself as the downtrend progresses. During this progression, the rate of decline can remain steady or accelerate as time goes on. The same may be said for volume during the decline, as it often remains steady or gradually increases as the downtrend progresses. Whichever the case, the bear market has plenty of fuel to keep it moving. Extremely heavy or light volume both work against the continuation of the decline by starving it in the case of light volume, or killing it in the case of very high volume. In the absence of either of these volume extremes, a rally of any consequence is hard to get. At some point, however, either through a sudden surge in volume or a lack of it to further fuel the decline, a notable rally will occur.2
This rally, termed Preliminary Support, should be notable in that it will stand out among other upside reactions during the bear market in terms of price gain and volume. While this advance may not travel far enough to break any important trend lines that defined the downtrend, it will often produce some type of break above an area of overhead Supply. The development of PS is especially likely as the market approaches the downside objective established by the point and figure count taken from the preceding major market top.3
At this point in the discussion, it is appropriate to introduce a component of the Lowry Analysis that is helpful in identifying PS as well as other stages of the formation of a major market bottoms: 90% Upside and 90% Downside Days. Paul Desmond, Lowry Research Corporation’s President, introduced 90% Days at a meeting of the Market Technicians Association in 1982. The topic of 90% Days is elaborated upon extensively in Mr. Desmond’s white paper, “Identifying Bear Market Bottoms and New Bull Markets.”
The components that make up 90% Days are among the metrics Lowry Research compiles at the end of each trading day on the NYSE in order to create the Buying Power and Selling Pressure Indexes:
• Total point gains for stocks closing higher on the day
• Total volume for all stocks closing higher on the day
• Total point losses for all stocks closing lower on the day
• Total volume for all stocks closing lower on the day
A 90% Down Day occurs when Downside Volume equals 90% or more of total Upside Volume plus Downside Volume, and Points Lost equals 90% or more of the total of Points Gained plus Points Lost. 90% Downside Days are indicative of panic selling. Table 4.1 shows an example.
Table 4.1. NYSE Closing Points and Volume
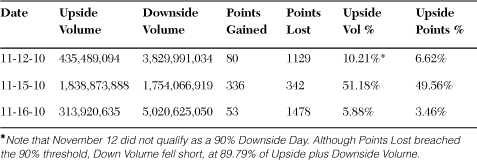
On November 16, Downside Volume equaled 94.12% of the sum of Upside plus Downside Volume:
5,020,625,050 / (313,920,635 + 5,020,625,050) × 100 = 94.12%
and, Points Lost equaled 96.54% of the sum of Points Gained plus Points Lost:
1478 / (53 + 1478) × 100 = 96.54%
A 90% Upside Day is the opposite of a 90% Downside Day, in that Upside Volume equals 90% or more of total Upside Volume plus Downside Volume, and Points Gained equals 90% or more of the total of Points Gained plus Points Lost.
Lowry’s research into the development of major market bottoms found that, more often that not, in addition to occurring on a sharp rise in volume, Preliminary Support will also occur in the form of a 90% Upside Day. The development of this phenomenon allows for easier identification of a change in character for the market that had previously been in the midst of a persistent and major move lower.
The development of PS is not a call for action on the part of the investor, despite what appears to be a sudden burst of investor buying interest. Rather, it is more of a warning that the bear market may be nearing an end. Evidence that a valid point of PS has indeed been established occurs with the next step in the bottoming process: the Selling Climax (SC).
The Selling Climax occurs when investors realize the rally representing Preliminary Support was not the start of a major move higher. Instead, the market sells off to new bear market lows and as a result,
...a large number of shareholders who have resisted the urge to sell during the decline to that point come to the realization, at approximately the same time, of just how bad things are. This is followed by fear over just how much worse they may get, and this leads to wholesale dumping of stocks to avoid the expectation of what lies ahead. What actually happens is that the sudden and sustained increase in Supply precipitates the worst. The Selling Climax is accomplished when the Supply of shares to be sold is exhausted. At this point, the downward push is eliminated, and a rally develops.4
While the SC is the action that actually stops the decline, it may, at times, not represent the actual nadir of the bear market.
The mindset of investors at the SC stage of the bear market, characterized by fear and panic, drives holders of stocks to get out of the market at any price. “It is this panic that drives prices down to extreme discounts—often well below book values—that is needed to set the stage for the next bull market.”5 As a result, having a quantifiable method for identifying panic selling is critical in identifying the early stages of a major market bottom. This is where 90% Downside Days come into play, as subsequent examples of major market bottoms soon illustrate.
However, 90% Downside Days are not limited to the SC phase of a major bottoming formation. In fact, “historical record shows that 90% Down Days do not usually occur as a single incident on the bottom day of an important market decline, but typically occur on a number of occasions throughout a major decline, often spread apart by as much as thirty trading days.”6
However, the final dumping of shares, or the SC, is often characterized by the development of more than one 90% Down Days in close proximity as the ultimate watershed selling takes place. In addition to the development of one or more 90% Down Days, heavy volume and wide daily price ranges also often occur during the SC.
While exhausted selling represents an important component in the formation of a major market low, a sustainable bottom cannot develop without evidence of enthusiastic investor Demand. This is where the next phase of the bottoming process, the Automatic Rally (AR), comes in. With Supply at least temporarily exhausted, a wave of buying enters in the market. This strong buying is often supplemented by added upside pressure from short covering, as those positioned for a further decline scramble to buy back shorted stocks when evidence of a meaningful rebound rally emerges. The AR often occurs in the form of one or more 90% Upside Days. Although the bottoming process is not yet complete, the combination of one or more 90% Downside Days followed by one or more 90% Upside Days (or, on rare occasions, two back-to-back 80% Upside Days) provides compelling evidence that a major trend reversal has begun.
The development of an AR in the form of a 90% Upside Day is important. As Paul Desmond states in his white paper,
...days of panic selling, by themselves, cannot produce a market reversal any more than simply lowering the sale price on a house will produce an enthusiastic buyer. As the Law of Supply and Demand would emphasize, it takes strong Demand, not just a reduction in Supply, to cause prices to rise substantially. It does not matter how much prices are discounted; if investors are not attracted to buy, even at deeply depressed levels, sellers will eventually be forced to discount prices further still, until Demand is eventually rejuvenated. Lowry’s extensive history shows that declines containing two or more 90% Down Days usually persist, on a trend basis, until investors eventually come rushing back in to snap up what they perceive to be the bargains of the decade and, in the process, produce a 90% Upside Day.7
The Automatic Rally typically lasts for roughly a week. Its duration tends to be limited as it is built on a still rather shaky foundation, despite the potent combination of 90% Down Days and 90% Upside Days. As the Automatic Reaction progresses, those investors still looking to unload shares will use the rally to sell, not wanting to get caught up again in a painful downward spiral of prices. This renewed Supply will result in another wave of downward pressure on the market. As stated in the Wyckoff Course, “In addition, those who had the courage to buy at or near the climax know that there is no firm reason as yet to expect an important up move, so they tend to be content with a relatively small, quick gain.”8 The selling by those looking to sell old long positions and to take quick profits from well-timed purchases made during the Selling Climax work to stifle the life of the AR. Typically, the high of the AR represents the upper boundary of the trading range that represents the major market bottom.
The demise of the Automatic Rally is an important part of the bottoming process, as it leads into the next critical stage of the formation of a major market bottom, the Secondary Test (ST). As stated in the Wyckoff Course,
No matter how classic the pattern appears to be as the low (of the Selling Climax) is hit and followed by an Automatic Rally, the Selling Climax becomes a reality only after it is confirmed. This is accomplished by the Secondary Test, which immediately follows the Automatic Rally. In order to successfully confirm the end of the decline, a Secondary Test must bring out a much smaller amount of volume than at the Selling Climax. In addition, the price should meet support at a somewhat higher level than at the Selling Climax. This point is not as essential as is the lower volume. A successful Secondary Test may be accomplished at the level of the Selling Climax or even somewhat below it”9 (as examples provided will illustrate).
Cases in which the Secondary Test penetrates the low of the Selling Climax carry a higher degree of risk than those where the ST holds above the low of the SC. As a result, price action subsequent to the ST becomes particularly important. If there is a lack of stabilization following a modest breach of the low of the SC, then the validity of the bottoming pattern would be called into question. Heavy volume on the Secondary Test as well as widening daily ranges on the decline would also suggest more work needs to be done on the downside before a valid bottoming formation gets underway.
After a successful ST is in place, the trading range defining the major market bottom can be identified. The nadir of the SC or ST defines the lower edge of the bottom formation, while the high of the Automatic Rally defines its upper edge. The initial ST may be followed by one or more subsequent STs, as the balance of Supply and Demand is determined and accumulation takes place.
In fact, these subsequent Secondary Tests often take on the form of one of two additional elements in the bottoming process: Springs and Shakeouts. As described in the Wyckoff Course,
A Spring is designed to prove the stock’s (market’s) inability to decline. A Spring involves the penetration of a well defined trading range support level on low or moderate volume. The ideal case is when the penetration of the support is very small and the volume is very low. If a stock (market) is going to begin an important decline, it must break the bottom out of the trading range and do so on substantial volume. The Spring action shows that the stock (market) is trying to break down and failing badly. It is an important sign of strength usually followed by an aggressive rally.10
Another potential occurrence during the bottoming process is termed a Shakeout. Again, from Wyckoff,
A Shakeout action is a sharp drop in price on heavy volume, which usually comes without warning and after an otherwise positive set of developments. It may bring a significant penetration of a prior support, although this is not a necessary feature, and there is almost always a speedy recovery.11
Although it may seem counterintuitive to call a Spring or a Shakeout a sign of strength, they demonstrate what the market is unable to do—sustain a break of support. That both a valid Spring and valid Shakeout are followed by what tends to be a significant rally underscores the fact that both developments serve to take stocks out of weak hands and redistribute those shares into strong hands, or those large operators who are positioning themselves for the impending bull market. It is those times when a significant rally fails to develop following a Spring or Shakeout that should cause the investor to beware, particularly if the apparent Spring or Shakeout occurs with a 90% Downside Day. Such a heavy wave of selling that is not followed by an equally dynamic recovery to back within what had appeared to be a developing trading range would imply the bottoming process has failed and the former bear market likely has further to run.
If a valid bottom is indeed in place, the end stages of the accumulation phase begin to emerge along with signs that sellers have exhausted their Supply and buyers have become the dominate players in the market. Subsequent phases of the bottoming process as well as the start of a new bull market are discussed in the following chapter. At present, however, we turn to a discussion regarding how Lowry’s measures of the intermediate term trends of Supply and Demand, the Selling Pressure and Buying Power Indexes, add a quantifiable element to the identification of the end of a bear market and the initial stages of a major market bottom.
Lowry Indicators
Buying Power and Selling Pressure play important roles in the identification of major market tops and new bear markets, as discussed in Chapters 2 and 3. These indicators are also particularly useful in identifying major market bottoms and new bull markets, as they tend to provide signals that are more easily identifiable than the often subjective interpretation of price and volume behavior.
Put simply, during the formation of a major market low, Selling Pressure will peak in the early stages of the formation of a major market bottom, either at the same level as the Selling Climax or, at times, even earlier in the bottoming process. The peak in Selling Pressure and its subsequent decline implies a reduction in Supply, a key element in the formation of a major market low. While beyond the scope of this book, one of Lowry’s Intermediate Term Buy Signals requires a particular point drop in the Selling Pressure Index, and this buy signal is often recorded within close proximity to major market lows.
The second element in the bottoming process is the emergence of enthusiastic and sustained investor Demand. This Demand is eventually evident in rising Buying Power throughout the formation of the range that defines the major market bottom. The combination of falling Selling Pressure and rising Buying Power, along with the development of 90% Upside and 90% Downside Days, help the investor recognize the various stages of the bottoming process which, in turn, allow for optimal entry of long positions early in what is likely to evolve into a new bull market. The following five examples of major market bottoms illustrate how the Wyckoff and Lowry methodologies mesh in determining when best to abandon the market on the short side and, instead, prepare for the eventual start of a new bull trend.
The Bottom of the 1968–1970 Bear Market
The formation of a major market top began in October 1968 and extended into May 1969. From the Last Point of Supply (LPSY) formed in May 1969, a bear market began that extended throughout the next year and shaved nearly 35% off the DJIA. While the ultimate low of that bear market occurred in May 1970, the bottoming process got underway in late March, which is illustrated in Figure 4.2.
Figure 4.2. The initial phase of the 1970 major market bottom
Charts created with Metastock, a Thomson Reuters product.

The market experienced a brief, albeit powerful rally on March 25, 1970. This represented the first 90% Upside Day since the start of the bear market. In addition to representing a 90% Up Day, total volume surged (Point A). Thus, a change of character in the market was readily apparent, suggesting a potential point of Preliminary Support had been established. The PS was justified by the action of Selling Pressure, which had peaked about two months earlier in February (Point B) and had been trending lower since, implying a reduction in Supply. Over the same two-month period, Buying Power was trending higher, evidence of growing Demand.
However, the pain of the bear market was not over, as the point of PS gave way to another wave of Selling. This decline was accompanied by another turn lower in Buying Power and a commensurate move to the upside in Selling Pressure. It did not take long for the panic stage of the decline to develop, as roughly a month after the 90% Up Day/Preliminary Support, a series of five 90% Downside Days occurred. This intense selling, or capitulation, took place amid heavy volume and wide daily ranges, key characteristics of the Selling Climax stage in the formation of a major market bottom.
While Selling Pressure was on the rise during the decline into the May 1970 bear market low, it is important to note that the level of Selling Pressure at this point was roughly the same as it had been back in early February 1970, prior to its decline during the rally into Preliminary Support. The lack of a meaningful expansion in Supply (Selling Pressure) during the decline into the Selling Climax supported the notion that a major market bottom was indeed under construction. If the bear market had additional legs on the downside, Selling Pressure should have experienced a notable expansion, breaking well above its February peak, suggesting Supply was not yet exhausted.
Further evidence that a major bottom was at hand occurred in the form of the May 27, 1970, 90% Upside Day, which occurred just two sessions after the final 90% Down Day of the Selling Climax. This series of 90% Down Days followed quickly by a 90% Up Day is classic evidence that prices had been discounted enough to draw in enthusiastic buyers. The 90% Up Day also provided clear evidence of the development of the next stage in the bottoming process: the Automatic Rally. The AR was the typical length of roughly one week and established the upper boundary of the bottoming formation (also referred to as the Creek, as discussed in Chapter 5).
Volume remained on the heavy side during the Automatic Reaction (Point C) but then dried up (Point D) as the market turned lower into what qualified as a Secondary Test of the Selling Climax. The diminished volume was a key element in determining the validity of the ST, as Selling Pressure had yet to noticeably contract from its recent highs while Buying Power was only marginally above its late May 1970 low. However, at this point in the bottom structure, long commitments are not yet warranted. Therefore, if the bottoming formation fails, investors’ capital would not have been compromised.
While the market does not appear to be gearing up for a new bull market at this stage of the bottoming process, investors should be mindful of the developments that transpire in the days and weeks ahead, as the final stages of the bottoming process were to come.
The Bottom of the 1973–1974 Bear Market
Following the establishment of the January 1973 market top, the equity market rolled over into a bear market that persisted until an initial low was established in October 1974. This 21-month bear market resulted in a 44% decline in the DJIA. Although the bear market was interrupted by a roughly a two-month advance in August–October 1973 that resulted in a gain of nearly 16%, there was a lack of evidence indicating that the preceding bear market had run its course. Indeed, following that run higher, the market reversed in late October and by mid-November 1974 was sitting at new bear market lows.
Evidence that a sustainable low was close at hand, however, did appear nearly ten months later, in August 1974 (Figure 4.3). This evidence was in the form of a brief three-day advance that should have caught the eye of the astute investor, given the strong Demand exhibited on August 7, 1974. Although this session did not qualify as a 90% Upside Day, it came very close, with Up Volume representing 89.3% of total Up/Down Volume and Points Gained representing 89.4% of Points Gained plus Points Lost. This was the strongest Demand exhibited by the market since the second trading day of 1974. And though mediocre volume on the advance (Point A) and its failure to qualify as a bona fide 90% Upside Day were reasons for caution, evidence of a possible point of Preliminary Support was in place. Therefore, investors should have remained alert for the appearance of additional signs of the bottoming process.
Figure 4.3. The initial phase of the 1974-1975 major market bottom
Charts created with Metastock, a Thomson Reuters product.

Additional signs did appear, as the subsequent move to new bear market lows eventually gave way to panic selling, as two 90% Down Days developed within the span of seven trading sessions. Although volume did increase during the move lower (Point B), there was none of the typical heavy turnover seen during the Selling Climax phase. However, Selling Pressure did experience a rather steep increase during the SC phase (Point C), while Buying Power was in an equally steep decline (Point D), implying stocks were being dumped at all cost, while buyers remained on the sidelines, unwilling rush in and grab up the bargains.
The mood quickly changed, however, as Demand resurfaced September 16, 1974, with the market forming an upside reversal day (the market makes a lower-low but reverses to end the day higher, Point E). The subsequent advance persisted for the next three sessions, culminating with a 90% Upside Day on September 19. Strong volume on the upside reversal day combined with the subsequent 90% Upside Day provided persuasive evidence that the next phase of the bottoming process, the Automatic Rally, had indeed taken place.
In Figure 4.3, the Automatic Rally was followed by a turn lower that resulted in a break below the low of the SC. This sell-off occurred on relatively moderate volume. Therefore, it met the definition of a potential Spring, as volume would had to have been heavier to qualify as a Shakeout. The validity of the Spring was then confirmed with the subsequent rally, which qualified as a second Automatic Rally on heavy volume.
Note how the actions of Buying Power and Selling Pressure supported the notion that the drop below the low of the Selling Climax represented a stage in the bottoming process and not the start of another leg lower in the preceding bear market. Specifically, as the market tumbled during the Spring action, Selling Pressure was trending lower (Point F) while Buying Power was moving higher (Point G). Had the market been embarking on another leg lower in the primary downtrend, Selling Pressure should have moved above the peak established during the Selling Climax, while Buying Power resumed its contraction.
The second Automatic Reaction was then followed by another turn lower on declining volume (Point H). The light volume and stabilization of the market in the same vicinity as the low of the SC implied a valid Secondary Test had been established. Further confirmation was provided by Buying Power and Selling Pressure, as the former continued to trend higher while the latter extended its decline, implying Supply was continuing to dry up while Demand was gradually gaining the upper hand. Although the bottoming formation had further to progress, enough solid evidence was in place, by late October 1974, to indicate a valid major bottom was indeed forming.
The Bottom of the 1981–1982 Bear Market
The 1980–1981 bull market topped in April 1981, and the subsequent bear market did not reach its final low until nearly 16 months later in August 1982, after the DJIA had declined 24%. Although the ultimate low of the bear market was not established until August, the bottoming process actually started taking shape in late January 1982.
During this time, the market embarked on its first 90% Upside Day of the ongoing bear market, implying a level of Preliminary Support had potentially been established. In addition to the strong wave of buying, volume also notably increased on the 90% Up Day, which is evident in Figure 4.4 (Point A). Finally, Selling Pressure had peaked months prior, back in late September 1981 (Point B), and was in the midst of a steady move lower, indicating diminishing Supply. This contraction in Supply was accompanied by steadily increasing intermediate term Demand, as indicated by the rise in Buying Power that had been underway also since late September 1981 (Point C).
Figure 4.4. The initial phase of the 1982 major market bottom
Charts created with Metastock, a Thomson Reuters product.

When the potential point of Preliminary Support was in place, the market turned lower, falling to new bear market lows. This renewed leg to the downside was accompanied by the development of one 90% Downside Day as well as a steady increase in volume (Point D), sufficient evidence of the development of a Selling Climax. The SC was followed by a dramatic upside reversal day (lower-low/higher-close, Point E) that occurred on heavy volume, qualifying as an Automatic Reaction. The Automatic Reaction proved brief, as did the subsequent pullback (Point F), which qualified as a Secondary Test given the drop in volume. Although the aforementioned developments occurred within a rather compressed span of time, the volume patterns and the ongoing downtrend in Selling Pressure as well as the uptrend in Buying Power suggested that the pieces of a valid major market bottom were falling into place. However, major bottoms do typically take longer to play out and, as is discussed in the next chapter, there was some additional base building on tap in the coming months prior to the eventual breakout that led to the start of the next bull market.
The Bottom of the 2000–2003 Bear Market
As many readers of this book will remember, the 2000–2003 bear market was a painful event that resulted in a 78% drop in the NASDAQ Comp., as high flying Internet issues imploded. Other major market indexes did not escape the turmoil but experienced less of a decline, with the DJIA dropping about 38% over a period of 33 months. After what seemed like a never-ending drop in equity prices, the market finally showed some signs of promise in early July 2002, as seen in Figure 4.5, as the first 90% Upside Day since March 2000 developed, thereby causing astute investors to take notice and suggesting a potential point of Preliminary Support had been established.
Figure 4.5. The initial phase of the 2002-2003 major market bottom
Charts created with Metastock, a Thomson Reuters product.
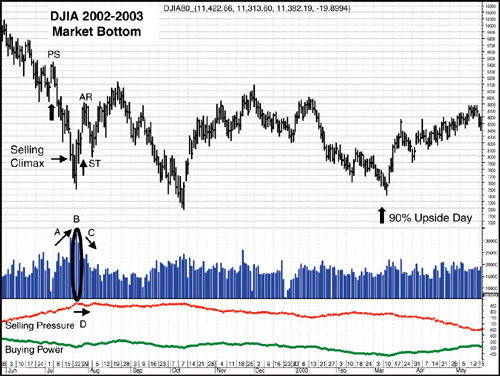
The strength exhibited in early July, however, proved short-lived, as the market turned lower, establishing new bear market lows. Volume surged during this move to new lows (Point A) while the daily ranges expanded, evidence a Selling Climax was indeed underway. Prices apparently dropped low enough to elicit enthusiastic investor Demand, as the market experienced a strong about-face, accompanied by volume that was even stronger (Point B) than that which accompanied the Selling Climax. This apparent Automatic Rally culminated with the development of another 90% Upside Day which, in this case, apparently was enough to at least temporarily exhaust Demand, as the market soon turned lower.
This pullback occurred on diminished volume (Point C), suggesting a Secondary Test of the Selling Climax was underway. Just as in the preceding example of the bottom of the 1981–1982 bear market, these initial stages of the development of a major market bottom played out over a relatively short period of time, implying that, although the pieces of a bear market low appeared to be falling into place, there was likely still work to be done in the months ahead, and new buying at this point in the bottoming process was not yet warranted. This final point is especially important given that Selling Pressure had not yet established a sustained downtrend, having just recently peaked during the establishment of the SC and subsequent ST (Point D).
The Bottom of the 2007–2009 Bear Market
The final major market bottom to be reviewed in this chapter is the most recent one established prior to the publication of this book, the bottom of the 2007–2009 bear market. Many factors led to this bear market, the worst since 1929. A housing market bubble, credit crisis, and misuse of leverage were just some of the contributing factors leading to a bear market that pushed the DJIA down nearly 54% over a span of 17 months.
Evidence of the potential beginning of the end of the bear market occurred in September 2008 with the development of a 90% Upside Day, as can be seen in Figure 4.6. This had been the first 90% Upside Day since April 2008. The 90% Upside Day that occurred in April 2008 was quickly proven an invalid point of Preliminary Support, given the absence of the development of a subsequent Selling Climax and a lack of heavy volume.
Figure 4.6. The initial phase of the 2008-2009 major market bottom
Charts created with Metastock, a Thomson Reuters product.

On the September 2008 90% Upside Day, however, volume noticeably increased (Point A), suggesting a potential change of character for the market. Selling then quickly resumed, and volume steadily increased (Point B) as the market produced four 90% Down Days in the span of nine trading sessions and fell to new bear market lows. This breakdown suggested that in addition to forming a valid level of Preliminary Support in September, the market had also experienced a Selling Climax during the decline into early October.
The bottoming process was by no means near an end, however, as the trends of Buying Power (Point C) and Selling Pressure (Point D) implied Supply remained a dominant force driving the market. Nonetheless, the bottoming process outlined by the Wyckoff methodology appeared to be in place, given the subsequent Automatic Rally in mid-October 2008. That Automatic Rally was followed by back-to-back Secondary Tests that occurred on diminishing volume (Point E), implying a successful bottoming formation was indeed underway.
However, as with the preceding example of the 2000–2003 bear market bottom, Selling Pressure had yet to establish a readily identifiable peak, warning that although the bottoming process appeared to be underway, more work likely needed to be done in the coming months, and if a valid bottom was indeed in place, Selling Pressure’s movements would eventually indicate a weakening of the intermediate term trend of Supply.
Endnotes
1. “Identifying Bear Market Bottoms and New Bull Markets,” Paul F. Desmond, 2002.
2. Wyckoff Stock Market Course; Volume One, The Stock Market Institute, Phoenix, AZ, 33.
3. Wyckoff Stock Market Course; Volume One, The Stock Market Institute, Phoenix, AZ, 33.
4. Wyckoff Stock Market Course; Volume One, The Stock Market Institute, Phoenix, AZ, 34.
5. “Identifying Bear Market Bottoms and New Bull Markets,” Paul F. Desmond, 2002.
6. “Identifying Bear Market Bottoms and New Bull Markets,” Paul F. Desmond, 2002.
7. “Identifying Bear Market Bottoms and New Bull Markets,” Paul F. Desmond, 2002.
8. Wyckoff Stock Market Course; Volume One, The Stock Market Institute, Phoenix, AZ, 34.
9. Wyckoff Stock Market Course; Volume One, The Stock Market Institute, Phoenix, AZ, 34.
10. Wyckoff Stock Market Course; Volume One, The Stock Market Institute, Phoenix, AZ, 37.
11. Wyckoff Stock Market Course; Volume One, The Stock Market Institute, Phoenix, AZ, 38.