
5. How Major Market Bottoms Form: Part II, Accumulation and Breakout
The initial phase of the development of a major market bottom involves the latter stages of the bear market and the very early stages of the accumulation process. At this point in the process, however, selling has not yet been fully exhausted, as few investors believe with conviction that a bottom is actually in place. In fact, it is near the end stages of a bear market when the financial press is typically filled with articles projecting a deepened and protracted decline for equities in the weeks, if not months, ahead. This feeling of continued despair on the part of equity investors is often bolstered by economic data which, at this point in the bottoming process, still indicates an economy nowhere close to embarking on a sustainable recovery. Various investor surveys often confirm widespread despair. In fact, a survey conducted by the American Association of Individual Investors as of March 5, 2009, indicated that 70% of investors considered themselves “bears.” This reading of overwhelming bearishness occurred within a week of the final low of the 2007–2009 bear market. As L.M. Lowry used to say, “It begins to get light from the very darkest hour of night.”
The second phase of the bottoming process includes the completion of the distribution process, an acceleration of the accumulation process, and the ascent into a new bull market. As was the case with the initial phase of a major market bottom, a combination of the Wyckoff and Lowry methodologies can greatly aid in identifying the end stages of the bottoming process which, in turn, should allow an investor to reap the benefits of the “meat” of the subsequent bull market.
Idealized Major Market Bottoming Pattern (Part II)
In Chapter 4, “How Major Market Bottoms Form: Part I, Panic and Capitulation,” the bottoming process included a discussion of the point of Preliminary Support (PS) and the subsequent Selling Climax (SC), Automatic Reaction and Secondary Test (ST). The ST may not represent an isolated event, as can be seen in Figure 5.1. Numerous STs and/or Springs and Shakeouts, also discussed in Chapter 4, may occur as stocks are moving from weak into strong hands.
Figure 5.1. Wyckoff’s key points for identifying a major market bottom

Rallies that follow Springs, Shakeouts and tests of these events tend to be particularly important. After having failed in an attempt to move to new bear market lows, the market should be, as stated in the Wyckoff Course:
...in a position to make a significant rally usually over a relatively short period of time and accompanied by a substantial increase in the level of volume. A rally of this nature coming at this point represents a Sign of Strength (SOS), as shown in Figure 5.1. Such a move is important here because it adds further confirmation to what the Spring (or Shakeout) action suggests. At the Spring (or Shakeout or test of either) a stock (market) is saying it cannot go down. When the Sign of Strength is added, it is as though the stock (market) is saying “I told you so,” and indicating what it can do instead.”1
Sign of Strength Rallies often, but not always, result in a breakout from the sideways trading range that represents the major bottom formation. The upper edge of this range is referred to as the Creek. According to Wyckoff, “A Creek is an imaginary line that winds its way across the top action of the trading range.”2
The breakout above the Creek is termed the Jump Across the Creek:
A Jump Across the Creek is a sharp quick rise in price generally accomplished in one or several days that propels the stock (market) up and out of the trading range. To be effective, the surge in price must be accompanied by a surge in volume as well. There is no set amount by which the top of the trading range must be broken for the action to qualify as a Jump Across the Creek. To provide the optimal trading opportunity, however, the penetration should be several points.3
Typically, the ill-informed investor chooses to initiate purchases on a Sign of Strength rally, whether it is confined to the boundaries of the trading range or results in a breakout from the range and effectively represents the Jump Across the Creek. However, this action is not optimal, because it entails buying on an advance, which carries with it a heightened degree of risk. Again from Wyckoff, “Although the urge to buy on the aggressive showing of a Sign of Strength rally is strong, it must be controlled in favor of the next reaction, which is known as the Last Point of Support (LPS).”4
Just as the bottoming process can contain several Automatic Reactions, Springs, Shakeouts and Secondary Tests, several Last Points of Support may also develop. However, the LPS an investor should be most concerned with is that which occurs following a Jump Across the Creek. This particular Last Point of Support is known by its own distinctive moniker in Wyckoff terminology, the Back Up to the Edge of the Creek. Although traditional Wyckoff analysis notes several areas during the bottoming formation that can be used to initiate long positions, for simplicity’s sake (and to offer a relatively low risk entry point), the ideal buy point is considered the pullback representing the Back Up to the Edge of the Creek. As the following examples illustrate, this final LPS might not result in an actual retest of the Creek. In fact, the Wyckoff Course states,
...relative strength is implied if a reaction meets support at or above the halfway point of the previous rally. If the volume is greatly reduced from that of the previous rally and if support is being met at or above the half way point of the rally, it is reasonable to conclude that a Last Point of Support (also qualified as a Back Up to the Edge of the Creek) is being experienced. Therefore, it is justifiable to take a long position.5
Whatever the amount of the preceding rally is retraced, the Back Up to the Edge of the Creek should be readily identifiable, given the substantial decrease in volume that occurs along with it.
Lowry Indicators
In the final phase of the bottoming process, 90% Upside Days play an important role. Often advances that represent Sign of Strength rallies or the rebound following a Last Point of Support will come in the form of one or more 90% Up Days or back-to-back 80% Upside Days (which act as a proxy for a 90% Up Day, according to the Lowry Analysis). While the development of 90% Upside Days aid greatly in the identification of key areas in the bottoming process, the action of Selling Pressure is also particularly important. Although the following examples illustrate that Buying Power does not always develop a sustained uptrend until late in the bottoming process, it is a requirement that Selling Pressure fails to expand or, in some cases, steadily declines throughout the majority of the life of the bottom formation. It is the lack of expansion in Selling Pressure that is key to the bottoming process. Lowry’s history shows that bull markets rarely begin until well after the Selling Pressure Index has started to contract from its bear market high, providing strong evidence that the desire to sell has been exhausted.
What follows is a discussion of the second phase of the bear market bottom process for each of the five major bottoms discussed in Chapter 4. The culmination of distribution, the acceleration of accumulation, and the beginning of the actual bull trend are illustrated in each example.
The Bottom of the 1968–1970 Bear Market
We ended the previous chapter’s discussion of the bottom of the 1968–1970 bear market with mention of the development of a low volume Secondary Test of the May 1970 Selling Climax. This ST, as shown in Figure 5.2, was followed by a rebound rally that tested the high of the preceding Automatic Rally (Point A). This advance was accompanied by volume that was much lower (Point B) than that on the initial Automatic Rally, thereby disqualifying the advance as a Sign of Strength rally.
Figure 5.2. The final phase of the 1970 major market bottom
Charts created with Metastock, a Thomson Reuters product.

The market then once again turned lower, dropping marginally below the low of the initial ST on continued light volume. At the low of the subsequent ST, Selling Pressure was essentially at the same level as at the low of the Selling Climax (Point C). Although the Index had yet to contract, the lack of expansion in Selling Pressure relative to its May 1970 level implied a potentially valid bottom formation was at hand.
Following the early July 1970 Secondary Test, another rally ensued. Although volume experienced only a modest expansion during the latter stage of this advance, Selling Pressure experienced a notable contraction (Point D) while Buying Power (Point E) experienced a commensurate expansion—thus evidence a Sign of Strength rally was at hand. A loosely drawn line from the top of the Automatic Rally (AR) and subsequent mid-June rebound rally high (Point A) formed the Creek, and the Sign of Strength rally resulted in a Jump Across the Creek.
This advance was followed by a consolidation that devolved into a pullback on extremely low volume (Point F). Note that despite the decline in the market, Selling Pressure continued to trend lower while Buying Power continued to rise. These factors, combined with the light volume, implied a LPS had been formed and, given its close proximity to the Creek, also qualified as a Back Up to the Edge of the Creek. It is at this point, on the low volume Back Up to the Edge of the Creek, where the initiation of long positions is warranted, as solid evidence of the completion of a major market bottom was in place. Note on the rally following the Last Point of Support, volume exploded (Point G), further confirmation that a new bull market was underway.
The Bottom of the 1973–1975 Bear Market
In our discussion of the bottom of the 1973–1975 bear market, we left off with the development of a second Automatic Reaction followed by a low volume Secondary Test that bottomed in the same vicinity as the mid-September 1974 Selling Climax. During these developments, Selling Pressure was trending lower (Point A) while Buying Power was in the midst of an even stronger uptrend (Point B), evidence that distribution was diminishing and accumulation was taking place.
We pick up with another rebound rally that halts in the same vicinity as the prior Automatic Rallies (Point C), as shown in Figure 5.3. This rally occurs on slightly heavier volume (Point D) than that which accompanied the preceding Secondary Test, a constructive development. While the three consecutive rally highs were forming the Creek, the bottoming process was by no means complete, as the market subsequently turned lower and declined all the way back to the low of the initial Spring. Despite the troubling price action and the development of two 90% Downside Days during this decline, volume was exceptionally light during the month-long sell-off (Point E), indicating that when the market appeared to stabilize, what transpired could be labeled a valid second Spring. Supporting the notion that a bottom formation was indeed still intact were Buying Power and Selling Pressure, as Selling Pressure remained below its peak established during the Selling Climax while Buying Power was holding well above its equivalent low (Point F).
Figure 5.3. The final phase of the 1974-1975 major market bottom
Charts created with Metastock, a Thomson Reuters product.

The market then, once again, turned to the upside and exhibited a clear Sign of Strength rally in the form of back-to-back 80% Upside Days, which according to Lowry Research, act as a proxy for a 90% Upside Day. This burst of strength also occurred on expanding volume (Point G) and resulted in a Jump Across the Creek. When that rally culminated in early January 1975, a low volume pullback (Point H) ensued that stabilized above the loosely drawn Creek. The pullback on light volume implied the development of a Last Point of Support (LPS) that also qualified as a Back Up Against the Creek, thereby offering a buying opportunity into a bull market which extended into 1976. Note that as the rally got underway, volume expanded dramatically, and a 90% Upside Day developed, adding further confirmation to the notion that a new bull market was in place.
The Bottom of the 1981–1982 Bear Market
The first phase of the bottom of the 1981–1982 bear market occurred over a compressed period of time, with the Selling Climax, Automatic Reaction and Secondary Test all occurring within a span of less than two weeks, as noted by Point A in Figure 5.4. Despite the compressed time frame, the volume patterns as well as the ongoing downtrend in Selling Pressure (Point B) and uptrend in Buying Power (Point C) suggested that the pieces of a valid major market bottom were falling into place. However, because major bottoms typically take longer than a couple of weeks to play out, the well-informed investor should have been anticipating additional base building in the months ahead.
Figure 5.4. The final phase of the 1982 major market bottom
Charts created with Metastock, a Thomson Reuters product.
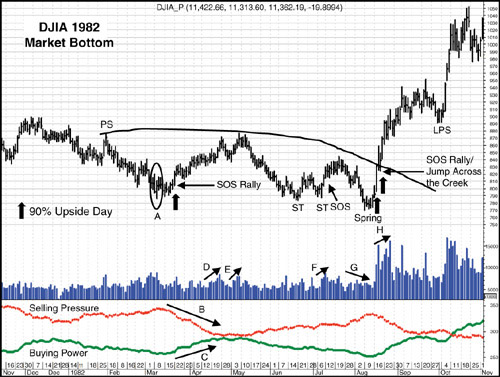
And additional base building did indeed occur, but not before a Sign of Strength rally developed that may have left some believing the bottoming process was complete. This Sign of Strength rally occurred on modest expansion in volume over that on the Secondary Test and included a 90% Upside Day on March 22, 1982.
This rally persisted for more than a month and was accompanied by a sharp contraction in Selling Pressure as well as a steep rise in Buying Power. However, despite these constructive developments and the expansion in volume (Point D) that occurred at the latter stage of the advance, the market failed to overcome the high of the point of Preliminary Support (PS). Then after a brief pullback, another rally occurred, again with expanding volume (Point E), yet once again the advance failed at precisely the same level. The dual failed rallies suggested Supply remained a factor and, as a result, the bottoming process was not yet complete.
Indeed, the market turned lower and sold off over the next month and a half, falling back to test the low of the Selling Climax formed more than three months earlier in March 1982. While Selling Pressure climbed higher during this time period, its longer term downtrend dating back to September 1981 remained in place, implying that, despite the pullback, the market appeared unlikely to roll over into a renewed bear trend.
Following this establishment of another ST, a brief rebound ensued but was quickly followed by another pullback that established a third ST of the bear market bottom. The market then appeared to finally be rejuvenated, as a rally developed on a clear expansion in volume (Point F), implying the development of a Sign of Strength rally. However, the bottoming process was still playing out, as the Sign of Strength rally topped in mid-July 1982 and the market dropped to new bear market lows in August.
This apparent breakdown might have led some to believe a new leg to the downside had begun, but there was evidence to the contrary. First, volume declined during the breakdown (Point G), suggesting new Supply was not coming on the market. In addition, although Selling Pressure rose sharply during the late July/early August sell-off, Selling Pressure’s longer term downtrend remained intact as it formed a lower high than that established during the Selling Climax. Given the diminished volume and the modest break below the low of the SC, a potential Spring was in place.
This Spring, as well as the culmination of the bottoming process, was confirmed with the subsequent Sign of Strength rally that occurred on a surge in volume ( Point H) and included the development of two 90% Upside Days. At the same time, Selling Pressure dove while Buying Power experienced a commensurate expansion. The Sign of Strength rally also served as a Jump Across the Creek, and the subsequent advance extended into late September.
A modest pullback amid diminished volume did eventually develop, indicating a Last Point of Support (LPS) was forming. This LPS retraced less than half the preceding Sign of Strength rally. As previously noted, if support is met at or above the half way point of the Sign of Strength rally, it is reasonable to conclude that an LPS (also qualifying as a Back Up to the Edge of the Creek) was underway. Therefore, initiating long positions was warranted. And any new long positions, although entered a good distance above the ultimate bear market low, would have reaped the spectacular gains of the 1982–2000 secular bull market.
The Bottom of the 2000–2003 Bear Market
As was the case for the bottom of the 1981–1982 bear market, the initial stages of the 2002–2003 major market bottom played out over a relatively short period of time, as outlined in the preceding chapter. But although the pieces of a bear market low appeared to be falling into place, there was likely still more work to be done in the bottoming process over the months ahead. This was particularly true given that Selling Pressure did not establish a sustained downtrend during the initial phase of the bottoming process.
We pick up the 2002–2003 bottom with the Secondary Test of the Selling Climax, as shown in Figure 5.5. The ST was followed by another move to the upside that surpassed the high of the Automatic Rally but was not accompanied by any noticeable expansion in volume (Point A). Given the lackluster volume, chances the market was in the midst of a sustained move higher appeared rather slim.
Figure 5.5. The final phase of the 2002-2003 major market bottom
Charts created with Metastock, a Thomson Reuters product.
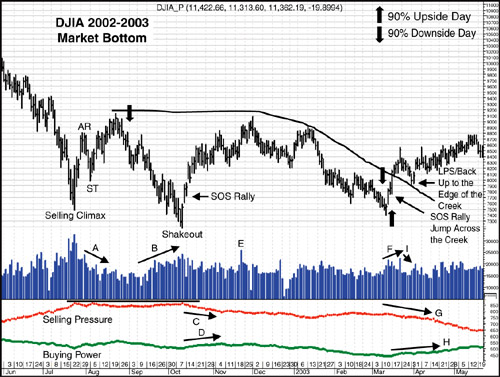
Indeed, the market turned lower, and though the decline quickly produced a 90% Downside Day in early September, this brief surge of selling served to exhaust Supply only temporarily, as the market quickly resumed its decline and eventually broke below the low of the Selling Climax. Given the break of the low of the SC and the steady increase in volume (Point B) that occurred during the decline, the market appeared to be either in the process of resuming the bear market or completing a Shakeout. A Shakeout, as discussed in the previous chapter, is one of the potential developments that occurs in the bottoming process as stocks are moving from weak to strong hands.
Price action and volume alone would have made it difficult to decipher which path the market would ultimately take. However, the action of Selling Pressure lends an important element to the analysis, in that it did not surpass its July peak during the Shakeout. This lower high, relative to that established on the SC, implied that despite the market’s break to new lows, the amount of Supply coming on the market had diminished, an important development indicating the market was indeed still in the bottoming process. Had the bear market resumed, Selling Pressure should have confirmed the increase in Supply with a move to new highs in its former uptrend.
During the subsequent rebound, which confirmed the establishment of a valid Shakeout, volume remained strong, signaling a Sign of Strength (SOS) rally. During this time, Selling Pressure (Point C) also began notably to contract while Buying Power (Point D) expanded, further evidence that the bottoming process remained underway. The Sign of Strength rally extended into the latter part of November 2002 and, while volume had tapered off from its levels during the beginning of the Sign of Strength rally, it surged as the market rallied toward the high of the August 2002 advance. The surge in volume (Point E) and failure to break above resistance is an example of one of Wyckoff’s Rules: Effort vs. Result. In this case, the heavy volume (Effort) failed to elicit an equally strong price move (Result). The fact resistance was able to remain intact suggested the bottoming process was not yet complete.
Indeed, the subsequent turn lower persisted for more than three months and brought the market down to test a support zone now defined by the Selling Climax and the Shakeout. The lack of a notable expansion in volume during the decline and the continued downtrend in Selling Pressure as the pullback progressed supported the theory that the market was in the process of forming a Spring. Just ahead of the final low of the Spring, the market formed a 90% Downside Day, signaling a strong surge in selling. Apparently, this surge in selling was enough to rejuvenate Demand, as the subsequent rebound rally contained a 90% Upside Day, evidence of enthusiastic buying. The 90% Upside Day, along with a rise in volume (Point F), accelerated decline in Selling Pressure (Point G) and increase in Buying Power (Point H), all implied a valid Sign of Strength rally was underway and the bottoming process was near completion.
The Sign of Strength rally resulted in a Jump Across the Creek, with the Creek loosely drawn across the highs established during the bottom formation. After the Sign of Strength rally peaked in mid-March, the market turned lower on diminished volume, suggesting the development of a Last Point of Support. This pullback also qualified as a Back Up to the Edge of the Creek, thereby offering a rather low risk opportunity to buy into the early stages of what evolved into a new bull market that would persist over the next four years.
The Bottom of the 2007–2009 Bear Market
The bottom of the 2007–2009 bear market represented a particularly volatile time in stock market history, as the proliferation of 90% Days in Figure 5.6 illustrates. The increase in 90% Days during the bear market as well as during the bottoming process appears largely due to the abolition of the Uptick Rule in July 2007. The Uptick Rule required that a security be shorted on an uptick in price. According to the U.S. Securities and Exchange Commission, a listed security may be sold short (A) at a price above the price at which the immediately preceding sale was effected (plus tick), or (B) at the last sale price if it is higher than the last different price (zero-plus tick). This rule was overturned in July 2007, resulting in more frequent 90% Days. While their increased frequency has, in some cases, diminished their utility, 90% Days did play a critical role in the formation of the 2009 market bottom, as the following example illustrates.
Figure 5.6. The final phase of the 2008-2009 major market bottom
Charts created with Metastock, a Thomson Reuters product.

We pick up with the market in 2008 after back-to-back Secondary Tests that occurred on diminished volume relative to that on the Automatic Rally, implying a successful bottoming formation was indeed underway. The advance following the second ST contained a 90% Upside Day. This implied strong Demand was coming into the market, but the lack of evidence of a top in Selling Pressure (Point A) and the continued downtrend in Buying Power (Point B) suggested the bottoming process was not yet in the end stages.
This rebound proved temporary, as the market rolled over and broke below the low of the Selling Climax. Given the spike in volume (Point C) and support break, this price action was labeled a Shakeout. Note that during the decline into the Shakeout, Selling Pressure moved to a new rally peak (Point D), which was further evidence that while a bottom appeared to be forming, more work was still to come.
The market stabilized relatively quickly following the Shakeout and the subsequent advance, on diminished volume (Point E), stopping short of the preceding rally highs. The market then embarked on another move to the downside, and this pullback occurred on steadily increasing volume (Point F). The urgency of the selling during this pullback was evident, given the development of seven 90% Downside Days over a relatively short period of time. Despite the panic selling and the decisive break below the 2008 lows, the uptrend in Selling Pressure did not reassert itself. Specifically, Selling Pressure’s peak in March 2009 was 20 points below its peak in November 2008. Thus, a potential second Shakeout, not a new leg lower in the bear market, appeared at hand.
This Shakeout was then confirmed by the subsequent rally in which volume remained heavy (Point G) and five 90% Upside Days in close succession developed. This strong burst of Demand clearly represented a Sign of Strength rally that also qualified as a Jump Across the Creek, with the Creek being drawn roughly across the highs established during the bottoming formation. Clearly, the positioning of the Creek is up to one’s own interpretation. The key elements to recognize are the development of the Sign of Strength rally and the subsequent Last Point of Support.
In the case of the 2008–2009 bottom, the LPS was a brief event that occurred during the latter part of March 2009 amid diminished volume (Point H) relative to that on the preceding rally. It also represented a Back Up to the Edge of the Creek that completed only a modest retracement of the preceding advance, indicating positive relative strength. While Selling Pressure had yet to noticeably contract, its longer term downtrend dating from November 2008 was never violated during the bottoming process or in the subsequent advance. As a result, new buying at the establishment of the LPS would have been warranted and, given the extent of the subsequent bull market, which remains intact as of this writing, rewards reaped from these purchases should have proven substantial.
The final chapter of this book delves deeper into the developments that occurred in the primary uptrend, as well as in Buying Power and Selling Pressure, during the months following the establishment of the March 2009 low. There were several interesting developments as the trend progressed, some of which undoubtedly caused some nail biting. However, given the trends in Buying Power and Selling Pressure, as well as positive trends in other important ancillary indicators, the current bull market still appears alive and well.
Endnotes
1. Wyckoff Stock Market Course; Volume One, The Stock Market Institute, Phoenix, AZ, 37.
2. Wyckoff Stock Market Course; Volume One, The Stock Market Institute, Phoenix, AZ, 39.
3. Wyckoff Stock Market Course; Volume One, The Stock Market Institute, Phoenix, AZ, 39-40.
4. Wyckoff Stock Market Course; Volume One, The Stock Market Institute, Phoenix, AZ, 37.
5. Wyckoff Stock Market Course; Volume One, The Stock Market Institute, Phoenix, AZ, 40.