
3. How Major Market Tops Form: Part II, The End Game
Major market tops generally form in two phases. The first phase, as discussed in the previous chapter, marks the end of an uptrend and the start of a process of distribution. During the first phase, however, buyers remain active, buoyed by hope the bull market is merely resting. This hope is reinforced by most economic data, which remains upbeat and pointing toward continued growth. Earnings for individual companies remain strong with analyst estimates indicating continued growth for the quarters ahead. But the stock market is a discounting mechanism, with prices based on expectations, not current conditions. Consequently, market tops are not made amid gloomy predictions of a slowing economy or recession, but when conditions for future growth may appear brightest. Likewise, major market bottoms occur when the outlook seems darkest—a primary reason why so many investors sell at or close to a bear market low and then are reluctant to re-enter when a new bull market begins.
In the second phase of a major top, signs of buyer fatigue become more evident, while selling becomes more aggressive. Typically, buyers become increasingly discouraged, as fewer and fewer stocks keep pace with gains in the market indexes. But with the proper tools, an alert investor can recognize this second and final phase of a major market top and prepare for the arrival of a new bear trend. As was the case with the initial phase of a major top, a combination of the Wyckoff and Lowry analyses can help an investor successfully recognize signs the topping process is concluding and a sustained market decline has begun.
Idealized Major Market Topping Pattern (Part II)
As described in the previous chapter, the first phase of a major market top marks the end of the bull market and start of the process of distributing stock from strong to weak hands. This phase begins with Preliminary Supply (PSY)—the first sign of major weakness in the market uptrend. This sign of weakness, as shown in Figure 3.1, is followed by a renewed rally, which typically ends with panic buying as investors, worried about missing the next big up move, pile into the market. This is the Buying Climax (BC). But buying at this point is of poor quality (that is, early buyers are selling to the latecomers to the bull market). Thus the climactic buying is short-lived as new Supply quickly swamps Demand. This rise in Supply results in a pullback termed the Automatic Reaction (AR).
Figure 3.1. Wyckoff’s key points for identifying a major market top
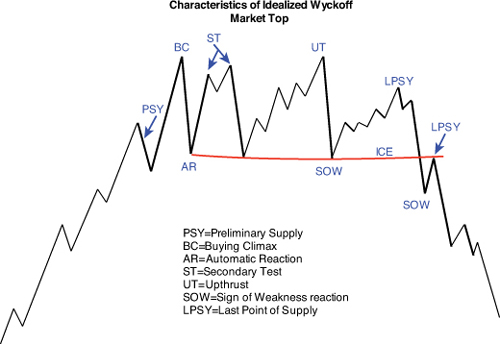
However, because there seems to be no evidence suggesting an imminent end to the bull market—that is, economic news and earnings are still good—late buyers see the pullback as an opportunity to scoop up stocks at lower prices. This buying produces a rebound rally termed the Secondary Test (ST). Depending on the length of the distribution process, there may be one or several Secondary Test rebound rallies before the market falls into a new bear trend. In this chapter, we examine the elements of the Wyckoff and Lowry analyses indicating the distribution process has ended and a new bear market begun. These elements are illustrated in Figure 3.1, beginning with the Upthrust after Distribution (UT).
Although not present in every major market top, the Upthrust (UT) or Upthrust after Distribution, is usually a clear indication the process of distribution is close to an end. The Upthrust may take prices to a new high or may test the highs formed during the earlier Secondary Tests. Typically the Upthrust occurs on moderate to heavy volume, as buyers hope to catch a new upleg in the bull market. However, the Upthrust typically proves short-lived, as prices quickly fall back. The Upthrust will also often signal the last gasp for strong Demand.
The pullback following the Upthrust generally occurs on moderate to heavy volume. This is because much of the stock bought on the Upthrust is in weak hands, that is, buyers who face almost immediate losses on any market pullback. A decline on light volume, though, will often lead to a rebound rally that serves as a test of the Upthrust. Light volume is key to this rebound rally, as a heavy volume rally would suggest enough renewed Demand to send prices to new highs, possibly voiding the topping process. While most Upthrusts are tested, there are some instances when they are not tested. In these cases, the investor should examine the price/volume action preceding the Upthrust. If volume tends to decrease on the rallies and increase on the reactions, representing distribution, the probabilities are that any move through the top of the trading range will be an Upthrust. Evidence of heavier volume on the rallies and lighter volume on the reactions that represent accumulation, however, would suggest the move to a new high is the start of a new upleg in the bull market.
There is also a variation of the Upthrust termed a Terminal Upthrust. In this case, the move above the trading range is more pronounced and occurs on heavy volume. Like an ordinary Upthrust, the Terminal Upthrust might or might not be tested. However, while ordinary Upthrusts can occur at any point during the formation of a major top, Terminal Upthrusts typically occur toward the end of the topping process. In reality, the Upthrust is considered a sign of weakness, largely for what it fails to do: result in a sustained breakout from the trading range.
A second indication the topping process is concluding is the Sign of Weakness (SOW) reaction. This SOW can follow an Upthrust or simply after a test of the top of the trading range. The key element to a SOW is the combination of a sharp decline in price and significant rise in volume. This combination indicates Supply is now moving into the dominant position. Unless this combination of heavy volume and sharp decline is obvious, though, the probabilities are the pullback is not a SOW, but simply a normal pullback within an ongoing trading range.
Despite the fact that selling is heavy on the SOW reaction, the pullback is often seen as another buying opportunity by those who remain focused on forecasts for continued economic gains and earnings growth. This very late-in-the-game buying produces a rebound rally resulting in a move to the Last Point of Supply (LPSY). This rebound rally will typically retrace half or less of the SOW sell-off and occur on light or diminishing volume. The low volume is key to the rebound, as a heavy volume rebound, especially one retracing more than half the SOW pullback, would suggest more strength than is usually associated with a rally to a LPSY. Such a rally would suggest the topping formation, rather than being near an end, still has further to run.
After a LPSY has been recorded, all that is left in the topping process is the final breakdown from the trading range. In Wyckoff parlance, this breakdown is termed Falling through the Ice. Unlike the straight line drawn across lows at about equal levels at the bottom of a trading range, the Ice is frequently a meandering, curved line, connecting lows at different levels as the formation of the trading range progressed. Its counterpart at a major market bottom is the Creek, which represents the key resistance level in a major bottoming pattern. Ideally, the Fall through the Ice should occur on heavy or expanding volume, suggesting a level of intense selling and expanding Supply associated with a sustainable decline. Usually, the Fall through the Ice is followed by a rebound rally to test the breakdown. This rebound should occur on significantly less volume than on the breakdown, as a light volume rebound would suggest the drop in prices has generated very little new buying interest. A rebound on heavy volume, however, would indicate strong Demand inconsistent with a sustainable breakdown. Such a heavy volume rally back above the Ice would suggest a more extensive rebound is in place. A rebound of this extent would, therefore, call for a reset of the sequence of signs of weakness leading to a breakdown. That is, new evidence of a SOW reaction, LPSY rebound, and subsequent Fall through the Ice.
A light volume rebound after a Fall through the Ice, however, would likely serve as a final LPSY. This LPSY below the level of the Ice constitutes the sell signal for the purpose of avoiding the bear market. And with a failure to break back through the Ice, the topping process is likely complete, with prices now poised to fall into a new bear market.
Using Lowry’s Measures of Supply and Demand to Supplement the Wyckoff Analysis
As was the case with the initial signs of a market top—Preliminary Supply, Buying Climax, Automatic Reaction, Secondary Test—Lowry indicators can prove helpful in identifying those Wyckoff points occurring toward the end of a major topping pattern. Oftentimes, patterns can be less than clear cut in terms of showing rising or falling, light or heavy volume. In these cases, rising or falling Demand, as measured by the Buying Power Index and changes in Supply, as indicated by the Selling Pressure Index, can help clarify conflicting or indefinite volume patterns.
For instance, the key to identifying a Sign of Weakness (SOW) reaction is heavy volume. Yet volume itself may be inconsistent during the pullback, varying between heavy, moderate or even light on a day to day basis. In this case, steadily rising Selling Pressure and falling Buying Power would suggest the increasing Supply associated with a valid SOW reaction. Similarly, a rally to a Last Point of Supply (LPSY) accompanied by increased Selling Pressure and decreased Buying Power would be a good indication of a lack of Demand behind the advance and of continued active selling into the rally.
Let’s turn now to see how all these Wyckoff and Lowry indications work out in real life by examining the final stages of the market tops discussed in Chapter 2, “How Major Market Tops Form: Part I, The Preliminaries.”
Final Stages of the 1968–1969 Market Top
We left the 1968–69 market top as prices had topped at the mid February Secondary Test and were dropping to the late February reaction low. Volume steadily contracted on this decline, while Selling Pressure showed only a nominal rise—both indications prices were not yet ready to tip over into a new bear market. However, things were about to change.
As shown in Figure 3.2, from the February low, the DJIA began an irregular advance to mid-April (Point A). Volume failed to show any significant rise during this rally and, with the exception of a couple brief spikes higher, was generally less than on the decline to the February low. Clearly, the lower prices reached in late February failed to attract any significant buying interest. The lack of Demand behind the rally was also reflected in the Buying Power Index, which initially continued to fall into mid March and then turned flat through the April 1969 rally high. At the same time, Selling Pressure increased into mid March and then turned lower. The lack of expanding Demand, though, was probably the best warning the rally did not represent the start of a major move higher. However, the next rebound in prices, in late April, which began from a level well above the February and March lows, appeared to reignite buying interest, as the DJIA quickly spiked higher, accompanied by a huge increase in volume on April 30 (Point B). The quick spike higher on very heavy volume is characteristic of an Upthrust, even if it did not carry above the November rally highs. The characterization of this spike higher as an Upthrust is reinforced by the subsequent struggle to extend the rally.
Figure 3.2. The final phase of the 1968-69 major market top
Charts created with Metastock, a Thomson Reuters product.

While the DJIA gained 25 points (925–950) in just two sessions—April 29–30, 1969—the Average spent the next ten sessions rising just 18 points (950–968). As volume remained heavy over this period, it is evident sellers were using the advance to unload their remaining positions. This was likely particularly true of those who had bought around the market top in early November and were then trapped by the subsequent quick decline. Also note that, despite the rally to this mid-May high, there was very little expansion in Buying Power and only a modest contraction in Selling Pressure, further evidence of exhausted Demand but continued active selling. The struggle to follow through on the late April spike in prices, lack of Demand and active Selling all helped define the May high as a Last Point of Supply (LPSY Point C).
Volume was moderate to light during the first two weeks of decline from the mid May LPSY but began to show a significant rise by early June. This rise in volume was reinforced by a simultaneous jump in Selling Pressure. The increase in both volume and Selling Pressure indicated the decline was, in fact, a Sign of Weakness (SOW). In this case, the rise in Supply coincided with a Fall through the Ice (Point D), marked by the line connecting the December, February, March, and April lows. This early-June breakdown through the Ice was subsequently followed by a test in early July (Point E). Buying was half-hearted, though, as indicated by the very light volume on the rally and the further drop in Buying Power. At the same time, there was a minimal drop in Selling Pressure, which was now in a clear-cut uptrend. All this suggested the rally in early July constituted a Last Point of Supply below the Ice and, as such, the sell signal for investors. And, in fact, this modest rally proved to be the last gasp for the bulls, as the DJIA fell from here into a bear market that lasted until late May, 1970, and took the Average to a low at 631, for a loss of 354 points (36%).
The End of the 1972–1973 Market Top
Unlike the top of the 1966–69 bull market, things unraveled quickly after the Secondary Test (Point D) at the top of the 1970–73 bull market (Figure 3.3). As noted in the previous chapter, the rally to the Secondary Test was accompanied by a substantial decrease in volume, only a nominal increase in Buying Power and slight increase in Selling Pressure. However, no period of distribution followed the Secondary Test, as the DJIA quickly fell into a SOW reaction. Although volume was irregular on the decline (Point E), the sharp rise in Selling Pressure offered graphic evidence of the heavy and increasing selling into the decline. Further evidence of rising Supply was provided by the move in Selling Pressure to the dominant position above Buying Power, suggesting sellers were then in control. This move in Selling Pressure to the dominant position also constitutes a sell signal according to the Lowry analysis. At the same time, buyers showed little stomach for bargain hunting, as the Buying Power Index went into a steep decline, demonstrating a sharp contraction in Demand. In this case, the SOW reaction also encompassed a Break through the Ice (Point F) in late January.
Figure 3.3. The final phase of the 1972-73 major market top
Charts created with Metastock, a Thomson Reuters product.

The decline following the break below the Ice was temporarily interrupted by an attempted rebound after a test of the DJIA 200-day moving average (Point G). This rebound apparently motivated some bargain hunting and possibly some premature short-covering, as prices quickly spiked higher. The rally ended just as quickly, though, with a very heavy volume attempt to break back through the Ice on February 13, 1973 (Point H). This heavy volume spike evidently served to exhaust whatever Demand still existed, as prices immediately turned lower, helping identify the spike as a likely LPSY and the sell signal for investors. The status of the February 13 spike as a LPSY was then confirmed by the pickup in volume and rapid rise in Selling Pressure as the DJIA fell below the early February reaction low.
This relatively brief, seven-week topping pattern suggests a long period of distribution is not necessarily needed prior to a major market decline, considering the 1972–74 bear market was the worst modern day bear after the 1929–32 bear market—that is, until it was surpassed by the 2007–2009 market debacle.
The Drawn-Out Conclusion to the 1976 Market Top
In contrast to the relatively compact major top at the end of the 1970–72 bull market, the demise of the 1975–76 bull market was a more drawn-out affair through much of 1976 (Figure 3.4). The initial phase of the market top played out over a relatively brief time span, with Preliminary Supply (PSY), the Buying Climax (BC), Automatic Reaction (AR) and Secondary Test (ST) all occurring within a six-week span. This initial phase of the top ended in late March 1976, as Buying Power fell into a steep decline and Selling Pressure continued to climb.
Figure 3.4. The final phase of the 1976 major market top
Charts created with Metastock, a Thomson Reuters product.
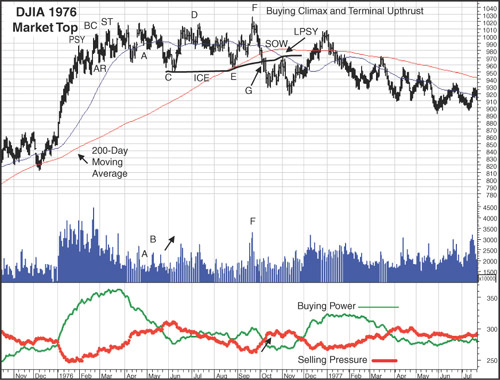
Volume remained relatively light on the pullback from the mid-April 1976 high (Point A), suggesting sellers were at least temporarily stepping to the sidelines. The modest rise in Selling Pressure on the drop to the early May low also suggested a reduced Supply of stock for sale. If sellers were waiting for higher prices, their patience was rewarded with a rebound from the early May low, as the DJIA tested its mid April high on heavy volume (Point B).
This rally’s failure to push to a new high, despite the spike in volume, suggested the continued presence of heavy Supply at the level of the April high. Sellers marked this failure as another opportunity to unload stocks, resulting in the drop to the early June low (Point C). Although Selling Pressure continued to rise, there was no significant increase in volume, suggesting the decline was not the SOW that typically accompanies the end phase of the topping process. And in fact, prices stabilized just below the February-April lows, as buyers at those prior lows once again stepped back into the market. Volume showed a steady increase on the rally from the June 1976 low. The increase in Demand and decrease in Supply on the rally was further supported by a new rise in Buying Power and drop in Selling Pressure. All this provided evidence the topping process still had further to run.
Any hope that this period of churning, from February through May 1976, had been just an interruption in a continuing bull market were dashed, though, when the advance ran out of steam back at the rally highs from March, April and May (Point D). This failure to push to new rally highs, despite what was now a pattern of expanding Demand and contracting Supply (rising Buying Power, falling Selling Pressure), was another piece of evidence the bull market was in serious jeopardy. Sellers, though, seemed content to sit on their stock, as the July high was followed by two months of sideways churning and falling Selling Pressure. This churning ended with a renewed decline that tested support at the June low and the DJIA’s 200-day moving average (Point E). The rebound from the 200-day moving average suggests that once again sellers had failed to send the DJIA to a new reaction low. This failure evidently resurrected hopes by the late-to-the-party crowd of another leg up in the bull market and an opportunity for the profits they had missed during the 1975 market rally. The result was the sharp rally on expanding volume to a marginal new high in mid-September 1976 (Point F).
An examination of trading over the prior seven months, however, should have created second thoughts for those buyers who ventured into the rally up to the September high. If the seven-month sideways pattern were leading to a new up leg in the bull market, measures of Supply and Demand should have indicated a process of accumulation. Instead, at the September market peak, Buying Power was far below its level in late March and Selling Pressure was clearly above its January-February lows. So instead of showing a pattern of expanding Demand and contracting Supply consistent with accumulation, Buying Power and Selling Pressure indicated a process of distribution—that is, rising Supply and falling Demand.
Thus, an alert investor would have suspected that the spike by the DJIA to a new high on very heavy volume on September 22 (Point F), was more likely a buying climax than the start of a new up leg in the bull market. And in fact, the climactic action represented the final exhaustion in Demand in a clear illustration of a Wyckoff-defined Terminal Upthrust.
From this point, the final topping process unfolded quickly. Although volume failed to show a significant increase on the decline from the September high, Selling Pressure told a different story, as the Index showed the sharpest rise of the whole topping process. The SOW reaction also served as a breakdown through the Ice (at Point G), formed by a line connecting the June and August reaction lows in the DJIA. The significance of the Break through the Ice was emphasized by a move in Selling Pressure above Buying Power, registering a Lowry sell signal. The SOW also carried to a new reaction low, suggesting that whatever Demand had existed at the June and August lows, was now gone. While prices finally stabilized at a lower level, the resulting rally was on light volume and contracting Buying Power. This suggested the rebound was probably more the result of short-covering than longer-term buying, typical of a rally to the Last Point of Supply. This LPSY, in turn, served as the sell signal for investors.
There was one last gasp for the bull market though, as the DJIA, after recording a slightly lower low in early November, began to rally. This rally could probably be best described as a secondary topping pattern. Without question, the rally began strongly enough to call into question whether the whole process over the past nine months did, in fact, represent a topping pattern. Volume in the early stages of the rally from the November low was heavy, while there was a sharp rise in Buying Power and equal drop in Selling Pressure. Certainly, the bull market appeared to be once again firing on all cylinders. However, as the DJIA approached the levels of the rally highs from March, April, May, and July 1976, volume began to fade, and Supply began to expand, as indicated by the rise in Selling Pressure (Point H). As the DJIA tipped over into a renewed decline in early January 1977, volume remained heavy, suggesting sellers were once again aggressively unloading their stock—action inconsistent with only a temporary setback for the market. And, in fact, the late December high represented the final recovery peak after which the DJIA descended into a bear market that would last until 1980.
The Less Drawn-Out 1980–1981 Market Top
At about eight months from start to finish, the top of the 1980–81 bull market (Figure 3.5) was not as compact as the three-month top in 1973 but not as lengthy as the thirteen-month top in 1976. Nonetheless, the top in 1980–81 marked a watershed for the stock market, as it proved to be the final top in the 16 year secular bear market that began in 1966.
Figure 3.5. The final phase of the 1980-81 major market top
Charts created with Metastock, a Thomson Reuters product.
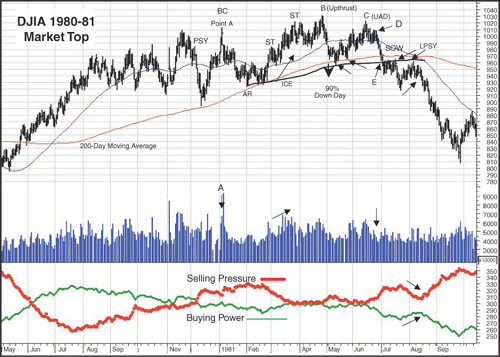
The preceding chapter left the initial phase of the 1980–81 top at the late March 1981 Secondary Test (ST) of the January Buying Climax (Point A). The late March assault on the level reached at the Buying Climax occurred on rising volume, suggesting buyers were, as yet, unconvinced the bull market from the 1980 market bottom was finished. However, this enthusiasm evidently had its limits, as the rally faltered just above the level of the January high. After a brief bout of profit-taking, a second assault and Secondary Test was mounted in early April. But this move came on much lighter volume, suggesting much of the remaining Demand for stocks had been exhausted in the rally a week or so earlier. Most telling, however, was the failure of Buying Power to expand or Selling Pressure to contract on the rally to the April high. This suggested the move to the March high had significantly diminished available Demand while there was little reduction in selling.
There was one last effort to rejuvenate the bull market, as a renewed burst of buying managed to lift the DJIA to a new recovery high in late April (Point B). Although volume was relatively heavy on the rally, the gains were short-lived as prices immediately fell into a sharp decline. This quick reversal of the move to a new rally high is a classic example of an Upthrust. Prices dropped sharply over the next week, but on relatively light volume, suggesting a test of the Upthrust was likely to occur. As had occurred on the declines from Preliminary Supply and at the lows on the Automatic Reaction, prices found support at the rising 200-day moving average for the DJIA. And a 90% Down Day on May 4 suggested Supply may have been at least temporarily exhausted, given that day’s heavy selling.
However, having been burned in the rally to the Upthrust in April (Point B) and subsequent quick reversal, buyers were evidently reluctant to aggressively pursue stocks, as the rally from the 200-day moving average began on light volume. After a brief bounce, a pullback in late May also found support at the 200-day moving average. This second test of support evidently emboldened buyers who concluded a significant new move higher had begun, as volume showed a sharp rise. Instead, the rally proved to be nothing more than the anticipated test of the Upthrust, as the rally peaked in mid-June (Point C), just below the high set in late April. This test could also be considered a final Upthrust, or Upthrust After Distribution (UAD). After a brief pullback, buyers mounted a weak effort to recoup the losses (Point D). However, volume on the effort was very light, and the rebound failed after retracing about half the decline from the June high—clear indications that whatever enthusiasm there had been for a renewed rally was now gone.
This weak rebound effort was evidently the signal sellers had been waiting for, as prices plunged over the next few sessions, quickly slicing through what had been key support at the DJIA 200-day moving average. Something clearly had changed, as the buying support previously found at the moving average had disappeared. The seriousness of this late June/early July decline was highlighted by the action of the Buying Power and Selling Pressure Indexes. Both had remained relatively flat on the rally to the mid-June test of the Upthrust, but now Selling Pressure spiked higher while Buying Power showed a sharp decline. The combination of the sharp drop in prices and jump in Supply suggested the decline represented a Sign of Weakness (SOW) reaction. The drop below support at the 200-day moving average also resulted in a Break below the Ice (Point E), signaling the approaching end of the topping process.
Prices lingered just below the 200-day moving average in the process forming a LPSY and a clear sell signal for investors. Volume remained light on a series of attempts to break back up through the Ice, indicating that, despite the violation of key support, prices had not dropped low enough to generate any strong buying interest. However, the bull market was not quite ready to expire. The early July sideways trading was apparently concluded by the sharp decline in mid-July 1981. But the decline proved short-lived, however, as buyers re-emerged at about the level of the January Automatic Reaction low. After all, that low had resulted in a nearly three-month rally that carried prices to new highs. Maybe a repeat performance was on tap.
The rally over the next couple of weeks, though, appeared primarily due to short-covering (premature covering, as it turned out) and some desultory bargain hunting. Most significantly, volume remained light on the rebound, while gains in Buying Power were substantially less than the losses in Selling Pressure. This pattern suggested the rally was due more to a withdrawal of Supply than strong Demand—a combination typical of a Last Point of Supply. The final element of the topping process fell into place when the late July/early August rebound rally failed to move above the highs set by the early July sideways trading, thereby constituting a failure to break back up through the Ice and confirming its role as a Last Point of Supply, which, in this case constituted a terminal event and a second sell signal for any investors who failed to heed the first in mid-July. A weak effort to hold the July lows was short-lived and followed by a swift decline. This decline was accompanied by a sharp rise in Selling Pressure and drop in Buying Power, suggesting there would be no late-day rescue attempt, as occurred in the November/December rally of 1976. Instead, the DJIA continued to plunge in what was now a full-fledged bear market that would persist to the August 1982 low.
It is also worth noting that Supply moved to the dominant position above Demand early in the topping process when the Selling Pressure Index crossed above the Buying Power Index in early December 1980. Over the course of the rest of the next few months, as the market traded sideways, and despite several moves to new rally highs, Buying Power was never able to move back to a dominant position, further reinforcing the appearance of a market in the process of forming a major top rather than preparing for a significant move higher.
The Preamble to the Worst Bear Market Since 1929–1932—the Final Stages of the 2007 Market Top
The initial phase of the 2007 market top was completed with the rally to the Secondary Test (Point A, Figure 3.6) in late October. Despite the heavy volume on this rally, it failed well below the level of the early October market high, suggesting the advance was being met by increased selling. From this point, signs of weakness continued to grow until the final breakdown in early 2008.
Figure 3.6. The final phase of the 2007 major market top
Charts created with Metastock, a Thomson Reuters product.

When the rally to the ST high failed, selling began to snowball rather than shrink, and volume continued to expand on the pullback, indicating sellers were now rushing to exit the market. The intensity of selling was reinforced by two 90% Down Days. Further evidence of new weakness was the drop by the DJIA below its 200-day moving average, a level that had provided support in the drop to the mid-August and early September lows.
This drop below the 200-day moving average was confirmed by the failure of a weak and very brief rebound rally to make a sustained break back above the moving average. Heavy volume and intense selling are characteristics of a SOW decline—itself an indication the topping process was entering its terminal stage. However, the bull was not quite ready to expire, as the subsequent drop close to the August reaction low evidently inspired new hope among buyers the worst was over. This optimistic outlook was indicated by two 90% Up Days occurring at and just after the mid-November 2007 low. These indications of strong Demand clearly suggested the market was not yet ready to fall into a bear trend.
With sellers temporarily stepping to the sidelines, prices began another ascent, buoyed by the apparently successful test of the August low and the two 90% Up Days. However, an observant investor would likely notice volume failed to show any significant expansion on this rally. The failure of volume to expand suggests buying of very poor quality, comprised largely of short-covering and short-term bargain hunting. The clearest indication the rally produced no meaningful changes in the overall pattern of contracting Demand and expanding Supply was provided by the Buying Power and Selling Pressure Indexes. Rather than accompanying the rally with a sharp rise, Buying Power managed only a marginal gain that did nothing to change the downtrend in force since mid-July 2007. At the same time, Selling Pressure was essentially flat, indicating selling remained steady. Weak Demand, light volume, and steady selling were all signs of an advance to a Last Point of Supply. The failure of the rally to move above the level of the late October Secondary Test only served to confirm its nature as a LPSY. The market was now on the hinge for a final plunge into a full-fledged bear trend. However, because this LPSY was still above the level of a breakdown (through the Ice), it did not yet constitute a clear sell signal.
Indications that prices were headed lower came rapidly after the LPSY peak, with a quick 90% Down Day, suggesting sellers were now rushing for the exit. A weak rebound then failed to retrace no more than half the initial decline from the LPSY, despite continued heavy volume, suggesting the buying was again being met by heavy selling. The failure of this rebound rally resulted in a steeper decline that quickly took the DJIA below the lows set in mid-August and late November 2007. This drop to a new reaction low provided clear evidence that, whatever Demand had existed at those prior lows, it was now gone. And that’s a formula for even lower prices.
In terms of the Wyckoff topping pattern, this decline represented a Fall Below the Ice (Point C), a breakdown emphasized by yet another 90% Day. Another weak rebound effort quickly failed, representing an unsuccessful attempt to move back above the Ice. This failure then precipitated an avalanche of selling, as volume spiked sharply higher and selling intensified with two more 90% Down Days. This selling quickly reached climactic proportions, as evident by the big move lower on January 18 followed by a sharp rebound on January 23, 2008, characteristic of a selling climax (Point D).
If a selling climax represents a major bottom, it should be followed by strong buying interest, as buyers enthusiastically snap up bargain-priced stocks. In this case, though, volume on the rally following the selling climax decreased from its level on the decline. Most telling was the very small drop in Selling Pressure. Another characteristic of an important selling climax is that it serves to exhaust Supply. Given the failure of Selling Pressure to show a sharp contraction on the rebound rally, it is clear Supply remained abundant as sellers once again used the rally as an opportunity to unload additional shares on unwitting buyers. The weakness of this rebound rally then became apparent as it failed around the same level as the short-lived early January test of the Ice. This latest rally, then, proved to be another failed test of the Ice, a failure that rapidly became evident to the sellers as it was followed immediately by another 90% Down Day. As such, this failed test could be considered a second Last Point of Supply. This second failure to break through the Ice, was the veritable horn-blowing, flag waving sign the top was in and prices were now headed into a major bear decline. This second LPSY was also a clear signal for investors to exit the market.
There were, though, another couple of opportunities to get out for those investors still clinging to the hope of a continuing bull market. The first occurred in the late February 2008 rally. While volume on the rally was generally light, the most telling evidence this was a short-lived rebound rally was provided by the Selling Pressure and Buying Power Indexes. Although prices rallied, Buying Power remained flat while Selling Pressure dropped, indicating gains were based more on a lack of Supply than expanding Demand. Thus, it was probably no surprise the rally failed at the same levels as the early December and late January rebounds. Clearly, the Supply that stopped those rallies was still there.
The decline following this third effort to break back above the Ice ended in a minor selling climax in mid-March (Point E). The subsequent rally finally managed to rise to new recovery highs, above those December, January and February peaks. Maybe things weren’t so bad after all! However, there were two problems with the rally an observant investor might have noticed. First, once again, volume failed to rise on the rally, suggesting buyers were reluctant to follow prices higher. Second, Selling Pressure showed only a modest decline and maintained its longer term uptrend, suggesting sellers remained active in the rally. Third, and most telling, Buying Power also declined, suggesting a distinct lack of Demand behind the gains. This was a repeat of the same pattern of the rally to the late February recovery high, that is, an advance based more on contracting Supply than expanding Demand. That February rally ended badly, and so did this one, as the DJIA proceeded to lose 2000 points over the next couple months.
Each of the market tops described in these chapters is different, but each share common characteristics. Our purpose in presenting the histories of these market tops is to provide a guide to the key features of a major market topping formation so an investor may recognize them as they develop at future market peaks. And while the Wyckoff analysis provides a guide to identifying the key phases and turning points of a major top, the Lowry analysis helps to quantify the shift from dominant buyers to dominant sellers. With these tools, an investor should be well prepared to recognize major market tops as they develop and to take the necessary defensive moves to avoid the potentially catastrophic portfolio losses than can occur in a full-fledged bear market.