
Electrochemical synthesis of magnetic nanowires with controlled geometry and magnetic anisotropy
V.M. Prida1; J. García1; B. Hernando1; C. Bran2; L.G. Vivas2,3; M. Vázquez2 1 Universidad de Oviedo, Oviedo, Asturias, Spain
2 Instituto de Ciencia de Materiales de Madrid (ICMM-CSIC), Madrid, Spain
3 Universidad de Zaragoza, Zaragoza, Spain
Abstract
This chapter reports on the different electrochemical deposition methods for growing metallic and magnetic nanostructured materials by using highly hexagonally self-ordered nanoporous anodic alumina membranes as template substrates. The synthesis and study of the physicochemical properties of metallic and magnetic single or alloyed, as well as multisegmented and multilayered, transition metal-based nanowire arrays obtained by electroplating on nanoporous alumina membranes, as patterned templates, are discussed in detail. Particular attention is paid to their peculiar magnetic properties and tailoring of the magnetic anisotropy by carefully controlling their chemical compositions, spatial arrangement and nanowire dimensions, for tuning improved magnetic features with specific technological applications.
2.1 Introduction
Nanostructured materials, which are defined as those with at least one dimension falling in the nanometer scale, including nanoparticles, dots, nanorods, nanotubes, nanowires, and thin films, among other nanoscale structures, can exhibit peculiar physical properties different from those of the bulk counterpart. Materials in the nanometer size range usually present some remarkable properties, such as low melting points caused by high surface-to-volume ratio effects and the dominant role that surface energy plays in thermal stability (Cao, 2004); lower temperature ranges of crystalline structure stability of the nanometer-sized materials; or the loss of ferromagnetic and ferroelectric behavior when the material shrinks to the nanometer scale (O’Handley, 1999).
There are many technical approaches for fabricating nanomaterials and nanostructures, which can be grouped in two main ways according to the methods of growth synthesis: top-down and bottom-up approaches. Lithographic-based techniques are standard examples of top-down fabrication techniques, whereas patterned, template-assisted electrodeposition methods are typical bottom-up strategies.
Bottom-up approaches specifically refer to building a material from the bottom through atom-by-atom, molecule-by-molecule, or cluster-by-cluster self-assembly and self-organization processes. This approach plays a relevant role in the fabrication and processing of nanostructures and nanomaterials, offering a better chance to fabricate nanostructures with fewer defects than those created using top-down strategies, more homogeneous chemical compositions, and displaying also better short and large ranges of ordering degree, both together at the same time. This is mainly because bottom-up approaches are driven by the reduction of Gibbs free energy; therefore the nanostructures and nanomaterials so produced are in a state closer to thermodynamic equilibrium. Top-down approaches, however, most likely introduce internal stresses in addition to surface effects, defects, and contamination.
Template-based synthesis of nanostructures and nanomaterials becomes in general a combined method used for the fabrication of nanorods, nanowires, nanotubes, and dots made of a wide variety of materials, such as polymers, metals, semiconductors, and oxides. The most commonly explored template growth method for the synthesis of nanowires and nanotubes is based on anodic alumina membranes with nanosized channels aligned in parallel (Furneaux, 1989; Masuda and Fukuda, 1995), among other patterns such as radiation track-etched polymer membranes or mica, porous silicon by chemical etching of silicon wafers or wafer bonding, and carbon nanotubes (Fleisher et al., 1975; Possin, 1970; Fan et al., 1999; Guerret-Piecourt et al., 1994; Ajayan et al., 1995).
Filling templates by electrodepositing a diluted precursor inside the channels of a nanoporous alumina membrane (NAM) is the most straightforward, versatile, and commercially available method for the synthesis of metallic and magnetic nanowires, nanorods, and nanotubes with desired dimensions and compositions. In addition to the geometrically tunable lattice parameters (pore diameter, interpore distance, and pore length) of the NAMs used as patterned templates, the template must also fulfill additional requirements for the confined growth of the metallic nanomaterial inside the nanosized channels of the template through electrochemical deposition of the precursor electrolyte. The main concerns are an appropriate wettability of the pore wall of the membrane to allow the penetration of the liquid precursor or electrolyte and complete filling. In addition, depending on the electrodeposition conditions, the template materials should be chemically inert, and in some cases, modifying either the hydrophilic or hydrophobic features of surface pore walls by depositing a monolayer of organic molecules or by silicon dioxide (SiO2) atomic layer deposition (ALD) could also be required (Romero et al., 2013). Finally, controlled shrinkage during solidification of the material for nanostructure growth is also desired because, depending on whether the adhesion between the pore walls and material filled is weak or strong, the solidification process can start well in the center of the pore, from one end, uniformly, or at the interfaces proceeding inward; therefore it may form nanorods, nanowires, or hollow nanotubes, respectively.
Electrochemical deposition, usually known as electrodeposition, has been widely exploited for the fabrication of electrically conductive materials only, such as metals, alloys, semiconductors, and electrically conductive polymers, because after the initial stage of deposition, the electrode is separated from the depositing solution by the deposit, and the electrical current must flow through the deposit to allow the deposition process to continue. Electrochemical deposition is also widely used for making metallic coatings, a process known as electroplating (Mohler and Sedusky, 1951). When the deposition is confined inside the nanopores of template membranes, nanocomposites formed by nanowires of several materials such as metals, semiconductors, and conductive polymers can be produced. By removing the template membrane, free-standing nanorods or nanowires can be obtained. However, if the deposition takes place without using porous templates, the growth of electrically conductive materials forming nanowires is carried out by a self-propagating process (Nabarro and Jackson, 1958). The growth of specimens through this process is rarely used for the synthesis of metallic nanowires because in practice it results in nanowire growth that is very difficult to control using electric field guidance. Therefore, template-assisted electrodeposition methods using membranes with desired geometric dimensions of channels are commonly used for the growth of nanowires (Whitney et al., 1993). By applying an electric field between the cathode, where the nanoporous membrane is attached and brought into contact with the electrolytic deposition solution of the precursor material, and the anode, which is placed inside the electrolyte and parallel to the cathode, cations of conductive material diffuse toward the cathode and are reduced therein, resulting in the growth of nanowires inside the channels of the self-ordered porous alumina template (Paunovic and Schlesinger, 1998; Metzger et al., 2000; Nielsch et al., 2000).
This chapter reports the different electrochemical deposition methods for growing metallic and magnetic nanostructured materials using highly hexagonally self-ordered nanoporous anodic alumina membranes as template substrates. The chapter discusses the synthesis and characterization of the main physicochemical properties exhibited by metallic and magnetic single or alloyed, as well as multisegmented and multilayered, transition metal-based nanowire arrays fabricated by electroplating on NAMs used as patterned templates (Pirota et al., 2004; Sharma et al., 2007, Prida et al., 2013). Particular attention is paid to their peculiar magnetic properties and the tailoring of its magnetic anisotropy by carefully controlling the chemical composition, spatial arrangement, and nanowire dimensions for tuning improved magnetic features with specific technological applications.
2.2 Magnetic nanowires with controlled geometry and magnetic anisotropy by electrochemical deposition in anodic alumina templates
2.2.1 Three-dimensional transition metals and their alloys
2.2.1.1 Single-element transition metal magnetic nanowires
The magnetic behavior of single-element magnetic nanowire arrays is determined by the intrinsic magnetic character of the individual nanowires together with the magnetostatic interactions among them, which are related to the diameter and length of the nanowires and to the porosity of the templates where they are arranged, in addition to the saturation magnetization value of each nanowire’s composition (Prida et al., 2007; Vega et al., 2011). While the strong shape anisotropy of the nanowires favors an effective magnetic anisotropy with easy axis parallel to the nanowires, interwire magnetostatic interactions result in a reduction of the effective longitudinal anisotropy (Escrig et al., 2007). The latter translates into a decrease in the longitudinal coercive field and remanence. In the case of nickel (Ni) and iron (Fe) nanowire arrays, typically a few microns in length and tens of nanometers in diameter, the magnetic behavior is mostly determined by the shape anisotropy that overcomes the magnetocrystalline energy because of the high symmetry of their face-centered cubic (FCC) and body-centered cubic (BCC) crystalline structures, respectively (Figure 2.1). However, special care must be taken when considering the magnetostriction term in Ni nanowires (Schlörb et al., 2010). On the other hand, the magnetocrystalline anisotropy also plays an important role in the magnetic properties of cobalt (Co) nanowires, since the uniaxial hexagonal close-packed (HCP) structure might provoke a competition among magnetic anisotropies (Vázquez and Vivas, 2011; Vivas et al., 2012a,b,c, 2013).

Fe nanowires
Fe is one of the most common elements on Earth because of its massive production by star nuclei as a consequence of fusion reactions. The abundance of this element has resulted in its extensive use in many applications since ancient times. In principle, Fe has been used in metallurgy; though pure Fe can be softer and more ductile than aluminum, the presence of different impurities can increase the hardness of metallic Fe by a factor of 1000, as in the case of carbon added to produce steel. However, the main disadvantage of Fe lies in its oxidation in the presence of oxygen or water, forming a flaky oxide layer that is easily peeled off to expose the Fe to the environment. Then Fe and Fe alloys are seriously damaged by corrosion if their surfaces are not passivated or coated with a protective layer. The role of Fe in biological processes where the Fe complexes with oxygen to form metalloproteins such as hemoglobin and myoglobin or redox reactions in plants and animals is also worth mentioning. Finally, from a magnetic point of view, Fe is widely used in magnetic devices because of its high saturation magnetization and magnetic susceptibility. One of the main magnetic applications of Fe over the years has been the production of electromagnet cores.
Industrial production of Fe starts with the extraction of Fe ores generally based on iron oxides. Such ores are processed in a blast furnace to obtain pig iron, which contains an elevated concentration of several impurities such as carbon, sulfur, and silicon. Then, this metal is submitted to several thermal treatments to produce different kind of Fe, steels, and compounds. The evolution of new technologies and the interest in small-dimension nanomaterials, however, have promoted the fabrication of Fe materials by means of physical vapor deposition, chemical vapor deposition, or electrochemical methods, among others. The possibility of electroplating Fe together with template-assisted methods has attracted attention for the fabrication of one-dimensional, Fe-based nanowires. However, the electrochemical conditions strongly affect the morphologic, structural, and magnetic properties of electroplated Fe (Izaki, 2010).
The most extended baths used in Fe electrodeposition are based on Fe chlorides, sulfates, or a mixture of two salts (Table 2.1). Although in those baths Fe(II) (ferrous) and Fe(III) (ferric) states are present, the latter causes a reduction of the cathode efficiency, which results in stressed and pitted deposits. In general, Fe(III) formation or precipitation can be controlled by the addition of different organic acids such as citric, tartaric, or ascorbic acid, or by adjusting the pH of the bath. The electrodeposition from sulfate-based baths results in smooth and homogeneous deposits but at slow deposition rates. In addition, such electrodeposition can be done at room temperature, maintaining the good properties of the deposit. By contrast, chloride-based electrolytes produce, in general, highly stressed and rough deposits that are reduced as the temperature of the electrodeposition process is increased.
Table 2.1
Most common electrolytes used in iron plating and the typical operating conditions for each case
| Type of Solution | Composition | Operating conditions |
| Sulfate | FeSO4·(NH4)2SO4·6H2O: 250–300 g L− 1 | Low pH 2.8–3.4 or high pH 4.0–5.5, 2 A dm− 2, 25°C |
| FeSO4·7H2O: 250 g L− 1 | pH 2.1–2.4, 4–10 A dm− 2, 60 °C | |
| (NH4)2SO4: 120 g L− 1 | ||
| For production of strip | FeSO4·7H2O: 600 g L− 1 | pH 1.4, 6.7 A dm− 2, 47 °C |
| Chloride (Fischer–Langbein) | FeCl2·4H2O: 300 g L− 1 | pH 0.8–1.5, 6.5 A dm− 2, 90 °C |
| CaCl2: 335 g L− 1 | pH 0.2–1.8, 2–9 A dm− 2, 88–99 °C | |
| FeCl2·4H2O: 300–450 g L− 1 | ||
| CaCl2: 150–190 g L− 1 | ||
| For electrotype | FeCl2·4H2O: 240 g L− 1 | pH 5–5.5, 2–5 A dm− 2, 25–40 °C |
| KCl: 180 g L− 1 | ||
| For production of strip | Ferrous chloride: | pH 0.5–4.7, 33–40 A dm− 2, 98–106 °C |
| 120–150 g L− 1 as Fe2 + | ||
| Sulfate-chloride, for electrotype | FeSO4·7H2O: 250 g L− 1 | pH 3.5–5.5, 5–10 A dm− 2, 40–43 °C |
| FeCl2·4H2O: 42 g L− 1 | ||
| NH4Cl: 20 g L− 1 | ||
| For production of strip | FeSO4·7H2O: 500 g L− 1 | pH 2.5, 3–27.5 A dm− 2, 80 °C |
| NaCl: 50 g L− 1 | ||
| Sulfamate | Iron(II) sulfamate: 250 g L− 1 | pH 3.2–15 A dm− 2, 50–70 °C |
| Ammonium sulfamate: 30 g L− 1 | ||
| Fluoborate | Fe(BF4)2: 226 g L− 1 | pH 2–3, 2–10 A dm− 2, 55–60 °C |
| NaCl: 10 g L− 1 |

From Izaki (2010).
A critical parameter that has to be controlled is the stability of the electrolyte, especially with large concentrations of Fe(III) that tend to form Fe(III) hydroxides precipitating at pH values around 3.5. Because changes in pH have a strong impact on the electrolyte, buffer salts such as boric acid (H3BO3) are commonly used to maintain a stable pH. Moreover, Fe oxidation can be avoided by bubbling inert gases such as nitrogen or argon to push away the oxygen ions present in the electrolyte.
From the crystalline point of view, the most stable phase at room temperature is the BCC, which is able to transit from a BCC to an FCC at high temperatures (> 900 °C). Such crystallization in a cubic crystal has a strong impact on the magnetic properties since it entails a reduction in the magnetocrystalline anisotropy of the material. This fact indicates that the magnetic properties of the material would be dominated by the shape anisotropy, which also increases as the saturation magnetization increases. In the case of nanomaterial science, one of the aims of reducing sizes is the achievement of high aspect ratios and, particularly in nanomagnetism, high and uniaxial-shaped magnetic anisotropies, which, in the case of Fe, are also enhanced by their high saturation magnetization.
Several studies of the magnetic properties of Fe nanowire arrays in porous anodic alumina templates have been performed over the past three decades (Yang et al., 2000; Zhang et al., 2003; Borissov et al., 2009). Because the shape anisotropy is supposed to be dominant, those studies focused on the effects of the geometric properties of nanowires (e.g., diameter, length) and nanowire arrays (e.g., porosity, homogeneity) over the magnetic properties (Peng et al., 2000; Sorop et al., 2004; Ou et al., 2009). These works cover nanowire diameters from 5 to 70 nm with a controlled nanowire length, ensuring in all cases a high aspect ratio. High uniaxial magnetic anisotropy with pore diameters smaller than 35 nm has been found, with the easy axis lying along the parallel direction with respect to the nanowire axis, as is predicted by shape anisotropy. Moreover, such nanowire arrays display a coercive field between 2 and 2.6 kOe, as can be seen in Figure 2.2, where the data of several nanowire arrays is collected (Sellmyer et al., 2001 and references therein).

Qin et al. (2012) reported a reduction in the coercive field and an apparent reduction in the uniaxial character of the magnetic anisotropy as the nanowire diameter is increased above 30 nm. Although the easy magnetization axis still lies parallel to the nanowires, the magnetostatic interactions strongly affect the shape of the hysteresis loops (HLs) made on nanowire arrays with 50- and 70-nm nanowire diameters (Figure 2.3). Since such interaction strongly depends on the distance between nanowires and on their saturation magnetization, the effect of the magnetostatic interaction among them has to be taken into account, especially with the high saturation magnetization value of Fe. Moreover, this interaction is negative because of the tendency to align the nanowire’s magnetization in an antiparallel configuration, which is able to reduce the coercivity and reduced remanence if it is strong enough.

Finally, although the BCC crystalline structure typical of Fe has a low magnetocrystalline anisotropy, the magnetic properties of Fe nanowires can be tuned by controlling the textured growth of nanowires (Hu et al., 2005). By means of dynamically changing the pH of the solution during electrodeposition, the preferred orientation [110] along the nanowire can be substituted by a [200] orientation, which enhances the easy magnetization axis parallel to the nanowires.
Cobalt nanowires
For regular Co at ambient pressure, the HCP crystal phase is the more stable one at temperatures below 422 °C, whereas the FCC crystal phase is the main stable phase at temperatures above 422 °C (Yoo et al., 2000). In electroplated films and nanowires, the FCC phase can be obtained from electroplating at ambient temperature and pressure using an electrolyte with a low pH (< 2.5). The low pH of the electrolyte enhances the evolution of hydrogen gas and the Co ion mobility during the electroplating process. The enhanced atomic mobility may be equivalent to a high temperature condition so that the FCC phase can be obtained (Cohen-Hyams et al., 2002). Nevertheless, the coexistence of both Co crystal phases has been reported in different works (Ye et al., 2009; Sánchez-Barriga et al., 2009). Also, one can expect a transition from an HCP to an FCC phase for nanowires with diameters ≥ 30 nm (Kitakami et al., 1997). Other investigations of Co nanoparticles show that the presence of an HCP phase or an FCC phase can be related to the particle diameter (Sánchez-Barriga et al., 2009). In this case, the transition from HCP to FCC was ascribed to a size effect caused by the lower surface energy of the FCC phase. However, electrodeposited Co (under standard conditions) usually presents the HCP crystallographic structure, although the FCC crystal structure can also be obtained by using particular deposition parameters, such as low pH and/or high temperature or deposition rate, as we have been discussing. Let us come back to the effect of the pH in the fabrication process through the discussion of the selected results in this section.
The nanowires described in this section were synthesized via direct current (DC) electroplating into pore channels of self-standing oxalic acid NAMs prepared by the two-step anodization process (Vivas et al., 2012b). Electrodeposition was carried out using an aqueous electrolyte containing 250 g L− 1 cobalt(II) sulfate (CoSO4) and 40 g L− 1 H3BO3 at room temperature, under constant stirring, at a bias voltage of − 1 V (vs. Ag/AgCl). The prepared solution has a typical pH value of 3.5, which was gradually increased to 6.7 by the addition of diluted sodium hydroxide. The wires grew in the usual bottom-up fashion, starting from the gold electrode at the pore bottoms, and the average wire length (L) was controlled by monitoring the total charge that passed during deposition. Scanning electron microscopy (SEM; Figure 2.4a) allowed us to determine the pore diameter (50 nm), the interpore distance (105 nm), and the length of the wires (3 μm). Also, X-ray diffraction (XRD) patterns in Figure 2.4b reveal the HCP phase in all the cases, showing strong textures along the [100], [101], and [002] directions, depending on the pH value (3.5, 5.0, and 6.7, respectively; Vivas et al., 2012b). These textured structures at 2θ = 41.5°, 47.5°, and 44.5° are ascribed to hexagonal crystalline anisotropy with the c-axis nearly perpendicular, at ~ 45°, and parallel to the wires axis, respectively (Maaz et al., 2010).

 ) and perpendicular (⊥) to the nanowires. Arb, arbitrary. Adapted from Vivas et al. (2012b).
Magnetic HLs for the three cases are shown in Figure 2.4c. A complex anisotropy distribution is suggested for the [100] texture (pH 3.5; Figure 2.4b), where there is a strong competition between magnetostatic (shape) and magnetocrystalline anisotropies to make the effective magnetic anisotropy to become parallel and/or perpendicular to the nanowires main axis. On the other hand, parallel magnetic anisotropy is deduced for the samples textured in the [101] direction (pH 5.0; Figure 2.4b), that is, the easy magnetic axis may be identified as the one parallel to the wires, in spite of the nonzero values of the coercivity (Hc) and reduced remanence (mr = Mr/Msat, where Mr is the remanence and Msat is the saturation magnetization) when the magnetic field was applied perpendicular to the nanowires axis. Finally, the nanowires textured in the [002] crystallographic direction (pH 6.7; Figure 2.4b) are determined by a strong uniaxial magnetic anisotropy. These results clearly illustrate that the synthesis process can be used to tailor the crystalline structure to manipulate the magnetism of the Co nanowire arrays. In particular, by modifying the acidity of the electrolytic bath during the electrodeposition of Co nanowires, it is possible to induce different Co HCP phase textures, which result in different magnetic behaviors.
The measured coercivity and remanence values decrease with an increase in the nanowire aspect ratio in Co nanowires electrodeposited from a Co electrolithic bath with a typical pH of 4. Vivas et al. (2012c) provide more details of the fabrication process of these samples. This behavior contrasts with the magnetism expected from the shape anisotropy contribution. The experimental evolution of coercivity with nanowire length is interpreted considering micromagnetic simulations in the next section, taking into account the change in their crystalline structure.
Based on SEM characterization, the geometry of the nanowire arrays was determined as pore diameter Dp of 35 nm; L ranges from 120 to 1000 nm, and an interpore distance Dint of 105 nm in the hexagonal arrangement. XRD patterns for the samples with L = 120 and 1000 nm are presented in Figure 2.5a. The intense peak at 2θ = 44.7° arises from the [200] FCC phase of the underlying aluminum foil, which has a strong signal in the samples from which it is not removed, such as the ones under discussion. For shorter nanowires, only a broadening on the left side of the aluminum peak is visible. This suggests the presence of the diffraction peak from the [111] FCC crystallographic phase at 2θ = 44.2°. Nevertheless, this phase could overlap with the [002] HCP at 2θ = 44.5°. This overlapping complex diffraction pattern is observed up to L = 350 nm, which indicates that the electrodeposited Co nanowires could be composed of either single FCC or both FCC and HCP crystalline phases. In particular, this fact agrees with the observation reported by Pirota et al. (2011), who detected by structural and magnetic characterization an FCC phase at the bottom of Co electrodeposited nanowires up to a length of 270 nm. Whether there is any crystal texture presents in the samples, it can be estimated by using a standard analytical calculation; therefore, for longer wires, as in the present samples, there is a texture in the [100] direction of the HCP phase, which increases with the nanowires length.
 ,⊥, and reduced remanence, mr,⊥, as a function of nanowire length. Parallel and perpendicular directions refer to the applied field direction with respect to the nanowires axis. a.u., arbitrary units. Figure adapted from Vázquez and Vivas (2011) and Vivas et al. (2011).
Figure 2.5b and c shows the trends followed by the coercivity and the remanence at room temperature. In contrast to what is expected from the simple effect of modifying the shape anisotropy, one can see a decrease in these two magnetic properties as a function of the length, which can be attributed to the change in the magnetocrystalline anisotropy rather than the shape anisotropy (see the increase of the [100] HCP phase with L in Figure 2.5a; Vivas et al., 2011).
To confirm using different approaches the important role that the crystalline structure plays in the magnetic properties of these kinds of systems, and looking for the actual magnetization reversal process, micromagnetic simulations are presented in this section. Because of the simulation time, this study is restricted to nanowires with lengths that range from 120 to 1000 nm, with typical wire diameters ranging from 35 to 75 nm. When the calculations are for nanowire arrays, the interwire distance was set to 105 nm, which is the typical distance for oxalic membranes (Schlörb et al., 2010; Vázquez and Vivas, 2011; Vivas et al., 2012b). The micromagnetic simulations presented here were performed using the MAGPAR package with finite element discretization (Scholz et al., 2003). The external magnetic field was applied in the direction of the nanowire axis. For the simulations, the typical magnetic parameters of bulk Co were considered (Ferré et al., 1997; Jamet et al., 2000).
Figure 2.6 shows part of the results from the demagnetization process simulated for seven individual nanowires with varying aspect ratios ordered in a hexagonal array. The simulations were for nanowires with either a single FCC or HCP phase. In the latter case, the c-axis was oriented perpendicular to the nanowire axis, considering that the Co samples obtained from the experiments exhibit an increase in the [100] HCP phase with increasing L. At the remanent state, the magnetic structure for co-FCC nanowires is a single domain with magnetization parallel to the applied field direction in the middle and two open vortex structures at both ends of the wires. Then, magnetization reversal occurs through vortex domain wall propagation (Figure 2.6a). In the case of nanowires with an HCP phase, the nucleation process also starts with the creation of vortices at the two ends with the same or opposite chiralities. The remanence is characterized by the nucleus magnetized along the nanowire length and a circularly magnetized shell. The corresponding remanence is, therefore, smaller than that of FCC nanowires. The coercivity is determined by the propagation of complex domain walls (Figure 2.6b). Thus, the modeling also shows the remanence decrease with the nanowire length (inset in Figure 2.6c) in qualitative agreement with the experimental results in Figure 2.5b and c. Finally, Figure 2.6d presents the coercivity values obtained from the experiments and the simulations. Both the FCC and HCP curves for the individual nanowires modeled follow a similar trend, but the second one has reduced values, as is expected from the strong perpendicular anisotropy effect. When magnetostatic interactions among nanowires are considered, the coercivity decreases considerably. However, the experimental behavior of Hc and mr with L is just the opposite, namely, a reduction of both parameters is observed. The combined crystallinity/geometry effect can be understood by considering that short nanowires are predominantly FCC, where the shape anisotropy dominates the total effective anisotropy. On the other hand, for longer Co HCP nanowires, the transverse magnetocrystalline anisotropic easy axis competes with the longitudinal shape anisotropy. Furthermore, from both the experimental results and the calculations, the FCC phase may be the only one present up to approximately 350 nm. The mix curve in Figure 2.6d represents the results obtained from a model, where a percentage of randomly distributed HCP grains increases monotonically with the increase in L of the nanowires. This model provides coercive field values more in accordance with experimental ones. An additional remaining discrepancy between the experimental and modeled values may be attributed to other contributions such as the possible presence of an HCP [002] peak, which favors the partial parallel alignment of the c-axis with the nanowires and thus the reinforcement of the uniaxial anisotropy; to the presence of defects and fluctuations of wire diameters and lengths; and to additional dipolar interactions coming from an infinite array.

Another geometric parameter, which can be modified to investigate the evolution of the crystal structure, is the diameter of the nanowires. In a different study, where the magnetic properties of arrays of Co nanopillars with the same length (L = 120 nm) but different diameters (from 35 to 75 nm), both experiments and modelling showed crucial changes in HLs when D was increased (Vivas et al., 2013). Although this magnetic behavior could be related to changes in the shape anisotropy, the primary role of the magnetocrystalline anisotropy, as well as the importance of the magnetostatic interactions among nanopillars, was demonstrated. Vivas et al. also showed the change in the reversal mode with the increased diameter from vortex propagation to curling, when the field is applied parallel to the nanopillar axis, and from coherent rotation to curling, when it is applied perpendicular to this axis.
Even though this discussion has been focused in nanowires arrays, important results have been obtained for individual Co nanowires. Ivanov et al. (2013) reported the magnetic and structural properties of an individual 40-nm diameter Co nanowire prepared by electrodeposition onto anodic alumina templates. Using HR-TEM and XRD, the monocrystalline HCP structure along the whole 10-μm nanowire length with the c-axis almost perpendicular to the nanowire axis was revealed. This observation enabled the understanding of the magnetic properties of the nanowire. The magnetic state observed by magnetic force microscopy and modelled by micromagnetic simulations was interpreted as consisting of tilted vortices with alternating chiralities.
Through all these studies, it can be established that the magnetic properties of electrodeposited Co nanowire are strongly dependent on the crystalline structure present. Furthermore, through manipulation of the synthesis parameters and the geometry of the wires, the magnetocristalline anisotropy can be tailored, which could create desired characteristics for a huge range of applications.
Nickel nanowires
Ni is a transition metal with good resistance against corrosion, which makes it interesting for the production of Ni steels and coatings that offer protection against oxidation. Furthermore, it is an element that shows ferromagnetism at room temperature and has been used, in combination with other elements such as Alnico alloy, to create permanent magnets. Moreover, the abundance of Ni in the form of metal and soluble salts has increased the importance of this element in the electroplating industry. In particular, the low magnetocrystalline anisotropy exhibited by the FCC crystalline structure of Ni offers the possibility to control the magnetic properties of the material by tuning its shape. In the case of magnetic nanowire array growth by electrodeposition into the channels of porous templates, it is easy to modify the characteristics of the magnetization reversal process by changing either the diameter or length of the nanowires. Since these arrangements are closely packed, the magnetostatic interactions among nanowires become an important fact to take into account because they greatly affects the collective reversal magnetization process. The low saturation magnetization of Ni, in comparison with Co and Fe, reduces the strength of such interactions, which favors the application of such close-packed magnetic systems in magnetic storage media. Finally, Ni shows extensive and negative magnetostriction, which is of special interest in nanoactuator and sensor technologies.
Nowadays the most common bath used in the electrodeposition of Ni is called the Watts-type electrolyte, although there exist plenty of approaches, depending on the type of deposit required (Di Bari, 2010; Table 2.2). In general, this type of electrolyte gives rise to electrodepositions with high current density and good-quality homogeneous deposits. Although the crystalline structure of Ni is always FCC, single or polycrystalline Ni nanowires can be produced by controlling the electrochemical conditions (Pan et al., 2005). Moreover, single-crystal Ni nanowires are produced by high electrodeposition potentials and low temperatures, whereas polycrystalline structures are obtained in other ways. Single-crystal Ni nanowires have a larger coercive field and are more square and thus have a higher uniaxial anisotropy.
Table 2.2
Electrolyte composition, operating conditions, and mechanical properties of the deposit for different electrochemical baths
| Electrolyte compositiona (g L− 1) | |||
| Watts nickel | Nickel sulfamate | Basic semibright bathb | |
| Nickel sulfate, NiSO4·6H2O | 225–400 | 300 | |
| Nickel sulfamate, Ni(SO3NH2)2 | 30–45 | ||
| Nickel chloride, NiCl2·6H2O | 30–60 | 300–450 | 35 |
| Boric acid, H3BO3 | 30–45 | 0–30 | 45 |
| Operating conditions | |||
| Temperature (°C) | 44–66 | 32–60 | 54 |
| Agitation | Air or mechanical | Air or mechanical | Air or mechanical |
| Cathode current density (A dm− 2) | 3–11 | 0.5–30 | 3–10 |
| Anodes | Nickel | Nickel | Nickel |
| pH | 2–4.5 | 3.5–5.0 | 3.5–4.5 |
| Mechanical properties | |||
| Tensile strength (MPa) | 345–435 | 415–610 | — |
| Elongation (%) | 10–30 | 5–30 | 8–20 |
| Vickers hardness (100 g load) | 130–200 | 170–230 | 300–400 |
| Internal stress (MPa) | 125–185 (tensile) | 0–55 (tensile) | 35–150 (tensile) |

Data from Di Bari (2010).
Note: Some typical properties of fully bright nickel deposits are as follows: Elongation percentage, 2–5; Vickers hardness, 100 g load, 600–800; internal stress (MPa), 12–25 compressive.
a Antipitting agents formulated for nickel plating are added to control pitting.
b Organic additives available from plating supply houses are required for semibright nickel plating.
In general, the coercive field and reduced remanence of Ni nanowires are determined by its shape, which means that the easy magnetization axis commonly lies parallel to the nanowire. However, the spatial arrangement of nanowires affects the global magnetic behavior of all nanowires since they tend to be aligned in an antiparallel configuration because of the magnetostatic interactions among them. Such interactions increase when the diameter of the nanowires, and thus the saturation magnetization, increases despite the reduction of the distance between them. Avoiding any contribution from magnetocrystalline anisotropy, ensuring that each nanowire can be a single magnetic domain, makes this system of special interest when studying the magnetic interactions in nanowire arrays for their application in high-density magnetic storage technologies (Nielsch et al., 2001, 2002; Vázquez et al., 2004a,b, 2005; Samardak et al., 2012).
2.2.1.2 Nanowires based on three-dimensional metals alloys
Co–Ni nanowires
Co–Ni alloys can exhibit both either a soft or a hard magnetic behavior, depending on the amount of Co in the alloy (Talapatra et al., 2009; Vivas et al., 2012c). The room temperature uniaxial magnetocrystalline anisotropy constant of bulk Co–Ni alloys (K1) varies from negative values (− 5 × 10⁴ erg cm− 3) for pure Ni to positive ones (2 × 10⁴ erg cm− 3) with the addition of a moderate amount of Co (8–22 at% of Co), whereas higher Co content leads to larger negative values (− 2 × 10⁵ erg cm− 3; Kadowaki and Takahashi, 1975; Fan and Piron, 1996), thus allowing for the design of a material with tunable magnetic properties. This fact, together with the high solubility of Co atoms in the crystalline lattice of Ni (and vice versa) for a wide range of relative concentrations (Cheng and Huang, 2008), have drawn renewed interest in the fabrication and magnetic characterization of Co–Ni alloy nanowire arrays (Rheem et al., 2007; Cojocaru et al., 2010; Vivas et al., 2012b,c; Vega et al., 2012a,b,c; Ali and Maqbool, 2013; Wen et al., 2013a,b). In these nanostructured systems, the competition between shape and magnetocrystalline anisotropies, together with the magnetostatic dipolar interactions among nanowires, determine the effective magnetic anisotropy energy, which can favor a preferred magnetization direction (easy magnetization axis) of the system either along the longitudinal or perpendicular directions with respect to the nanowire axis (Vila et al., 2009; Pirota et al., 2011).
Co–Ni nanowire arrays with a diameter of 130 nm, a distance of 305 nm between adjacent nanowires, and a length of 15–30 μm, covering a wide range of compositions from pure Ni to Co95Ni5, were reported by Vega et al. (2012a,b,c). The Co–Ni nanowire arrays were electrodeposited into hard anodized alumina templates, which were previously functionalized with an SiO2 shell by ALD. The electrodepositions were performed in Watts-type baths with changing amounts of Co and Ni ions in the electrolytes, which allowed the amount of Co in the alloy to be tuned by varying either the electrolyte composition or the electrodeposition potential, as indicated by the energy-dispersive X-ray (EDX) analysis of SEM cross-sectional images (Figure 2.7a). The crystalline structure, analyzed by XRD, reveals a change from an FCC to an HCP structure as the Co content of the alloyed nanowires is increased, as depicted in Figure 2.7b. At intermediate compositions, for example, Co71Ni29, the coexistence of both FCC and HCP crystalline phases was detected. Figure 2.8 (left column) displays room temperature HLs measured for Co–Ni nanowire arrays with different compositions along both the longitudinal (![]() ) and radial (⊥) directions with respect to the nanowires axis, while the column on the right shows longitudinal HLs of single nanowires, measured by magneto-optic Kerr effect magnetometry. These results indicate that both Ni-rich single nanowires and nanowire arrays display a magnetic behavior dominated by a well-defined longitudinal shape anisotropy, showing typical bistable HLs for single nanowires that are tilted in the case of arrays of nanowires by magnetostatic interactions among adjacent wires (Zighem et al., 2011), thus decreasing the reduced remanence value. This tilting effect is more noticeable as the Co content of the alloy is increased. The increase of the saturation magnetization value of Co–Ni alloys with the addition of Co atoms, as shown in the Slater-Pauling curve (Bozorth, 2003) also causes an increase in the demagnetizing field due to magnetostatic interactions, which is responsible for diminishing the squareness value from almost 100% in single nanowires to around 60% for Ni nanowire arrays and down to 10% for Co51Ni49 nanowire arrays. However, Co-richer nanowires and nanowire arrays display HLs characterized by a progressive change in magnetization as the magnetic field is reversed, indicating a delocalized magnetization reversal associated with the polycrystalline structure of the nanowires and the high anisotropy constant of the HCP phase (Khcp = 4.1 × 10⁶ erg cm− 3), which competes with shape anisotropy (KSh ~ 6 × 10⁶ erg cm− 3; Sánchez-Barriga et al., 2009). This competition between shape and magnetocrystalline anisotropies is also evident from the broad anisotropy field distribution obtained for Co71Ni29 nanowire arrays.
) and radial (⊥) directions with respect to the nanowires axis, while the column on the right shows longitudinal HLs of single nanowires, measured by magneto-optic Kerr effect magnetometry. These results indicate that both Ni-rich single nanowires and nanowire arrays display a magnetic behavior dominated by a well-defined longitudinal shape anisotropy, showing typical bistable HLs for single nanowires that are tilted in the case of arrays of nanowires by magnetostatic interactions among adjacent wires (Zighem et al., 2011), thus decreasing the reduced remanence value. This tilting effect is more noticeable as the Co content of the alloy is increased. The increase of the saturation magnetization value of Co–Ni alloys with the addition of Co atoms, as shown in the Slater-Pauling curve (Bozorth, 2003) also causes an increase in the demagnetizing field due to magnetostatic interactions, which is responsible for diminishing the squareness value from almost 100% in single nanowires to around 60% for Ni nanowire arrays and down to 10% for Co51Ni49 nanowire arrays. However, Co-richer nanowires and nanowire arrays display HLs characterized by a progressive change in magnetization as the magnetic field is reversed, indicating a delocalized magnetization reversal associated with the polycrystalline structure of the nanowires and the high anisotropy constant of the HCP phase (Khcp = 4.1 × 10⁶ erg cm− 3), which competes with shape anisotropy (KSh ~ 6 × 10⁶ erg cm− 3; Sánchez-Barriga et al., 2009). This competition between shape and magnetocrystalline anisotropies is also evident from the broad anisotropy field distribution obtained for Co71Ni29 nanowire arrays.


The dependence of the coercivity on the alloy Co content for both Co–Ni nanowire arrays and isolated nanowires, obtained from vibrating sample magnetometer and magneto-optic Kerr effect HLs, respectively, is depicted in Figure 2.9. In the composition range from pure Ni to Co51Ni49, the Hc![]() value decreases as the Co content increases for both single nanowires (from 404 to 241 Oe) and nanowire arrays (from 391 to 180 Oe); the Co51Ni49 sample is optimal for exhibiting softer magnetic properties.
value decreases as the Co content increases for both single nanowires (from 404 to 241 Oe) and nanowire arrays (from 391 to 180 Oe); the Co51Ni49 sample is optimal for exhibiting softer magnetic properties.

By directly comparing the values of Hc![]() for Co–Ni nanowire arrays with their respective counterparts for single isolated nanowires, it can be observed that the latter have larger values than the former for all the measured nanowires in the range of 0 ≤ x ≤ 62, in good agreement with previous works (Escrig et al., 2008), which, based on mcromagnetic simulations, demonstrated that the magnetostatic interactions among nanowires in the array are responsible for such a decrease in Hc
for Co–Ni nanowire arrays with their respective counterparts for single isolated nanowires, it can be observed that the latter have larger values than the former for all the measured nanowires in the range of 0 ≤ x ≤ 62, in good agreement with previous works (Escrig et al., 2008), which, based on mcromagnetic simulations, demonstrated that the magnetostatic interactions among nanowires in the array are responsible for such a decrease in Hc![]() . The perpendicular coercive field values (Hc⊥) of nanowire arrays show a small decrease from 71 to 44 Oe with increasing Co content in the same compositional range, whereas for higher Co contents it increases up to values around 200 Oe, close to those of Hc
. The perpendicular coercive field values (Hc⊥) of nanowire arrays show a small decrease from 71 to 44 Oe with increasing Co content in the same compositional range, whereas for higher Co contents it increases up to values around 200 Oe, close to those of Hc![]() , due to the competition between the shape and HCP phase magnetocrystalline anisotropies of Co-rich nanowires.
, due to the competition between the shape and HCP phase magnetocrystalline anisotropies of Co-rich nanowires.
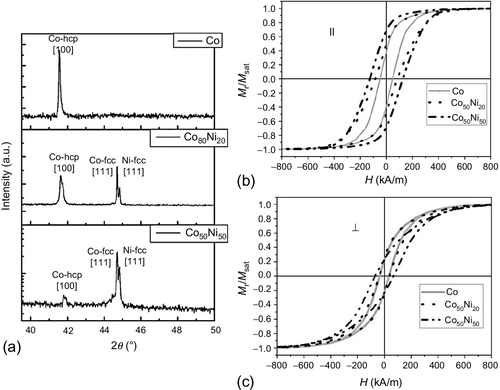
Vivas et al. (2012c) studied pure Co, Co80Ni20, and Co50Ni50 nanowires deposited into anodic alumina membranes with the following geometric parameters: interwire distance Dint ~ 105 nm, nanowire diameter Dp ~ 35 nm, and nanowire length L ~ 2.5 μm. In the XRD θ–2θ scans, displayed in Figure 2.10a, one can observe only the [100] peak from the Co HCP phase for Co nanowires, whereas the presence of mixed FCC-HCP is observed with the addition of Ni. Also, the presence of the Co HCP [100] peak decreases significantly and instead, two peaks are observed around 44.5°; these are more intense for Co50Ni50 (indicating a textured structure; Vivas et al., 2012c) than for Co80Ni20. This behavior suggests that the crystal structure of the nanowires has evolved from an HCP to an FCC phase.
 ) (b) and perpendicular (⊥) (c) to the applied magnetic field. arb, arbitrary; fcc, face-centered cubic; hcp, hexagonal close-packed (Vivas et al., 2012c).
Figure 2.10b and c shows the room temperature HLs of these samples for parallel (![]() ) and perpendicular (⊥) applied field configurations. Based on a comparative analysis, a certain effective magnetic anisotropy in the nanowires axis can be assumed for Co nanowires, since both Hc
) and perpendicular (⊥) applied field configurations. Based on a comparative analysis, a certain effective magnetic anisotropy in the nanowires axis can be assumed for Co nanowires, since both Hc![]() and mr
and mr![]() have slightly larger values than the corresponding perpendicular ones. That reflects a balance between magnetic anisotropies. While the textured [100] HCP phase of Co leads to a magnetocrystalline anisotropy with a perpendicular magnetic easy axis (Vázquez and Vivas, 2011), the strong effect of the shape anisotropy results in the preferential orientation of the magnetization parallel to the nanowires. These observations are in agreement with other results reported for polycrystalline Co nanowires (Vivas et al., 2012b,c; Rheem et al., 2007; Vázquez and Vivas, 2011). With the addition of Ni, a reinforcement of the parallel easy magnetization axis is observed, reflected in the increase of Hc
have slightly larger values than the corresponding perpendicular ones. That reflects a balance between magnetic anisotropies. While the textured [100] HCP phase of Co leads to a magnetocrystalline anisotropy with a perpendicular magnetic easy axis (Vázquez and Vivas, 2011), the strong effect of the shape anisotropy results in the preferential orientation of the magnetization parallel to the nanowires. These observations are in agreement with other results reported for polycrystalline Co nanowires (Vivas et al., 2012b,c; Rheem et al., 2007; Vázquez and Vivas, 2011). With the addition of Ni, a reinforcement of the parallel easy magnetization axis is observed, reflected in the increase of Hc![]() and mr
and mr![]() seen in Figure 2.10b. However, an overall increase in Hc⊥ is also visible. In this case, the sample’s polycrystallinity and the presence of both HCP and FCC phases may lead to local crystal inhomogeneities, causing the increased irreversibility observed in the perpendicular HL.
seen in Figure 2.10b. However, an overall increase in Hc⊥ is also visible. In this case, the sample’s polycrystallinity and the presence of both HCP and FCC phases may lead to local crystal inhomogeneities, causing the increased irreversibility observed in the perpendicular HL.
Similar crystallographic results have been observed for Co–Ni nanowire arrays deposited in anodic alumina membranes prepared in sulfuric acid-based electrolytes, with Dint = 65 nm and Dp = ~ 35 nm. However, a reduction of both magnetic parameters, Hc and mr, may occur when comparing the oxalic membrane samples (Dint = 105 nm). The ratio of Dp to Dint is higher in the sulfuric samples; hence a reduction in the effective magnetic anisotropy of the system is expected because of the reinforcement in the magnetostatic interactions among nanowires, which is in agreement with several reports from this field.
The study of the angular dependence of magnetic properties, in particular coercivity (Hc) and remanence (Mr), gives us a way to obtain information about the actual magnetization reversal mechanism. Escrig et al. (2008) calculated the angular dependence of the coercivity for three idealized modes of the magnetization reversal process: coherent rotation mode, in which all the spins rotate simultaneously; the curling wall mode, in which spins reverse progressively via propagation of a vortex-like (curling) domain wall; and the transverse wall mode, in which spins reverse progressively via propagation of a transverse domain wall. Although all three modes are possible in principle, the corresponding system will reverse its magnetization by whichever mode opens an energetically accessible route first, that is, by the mode that offers the lowest coercivity. Figure 2.11a illustrates the results obtained for a sample of Co50Ni50 nanowires. In this calculation, an anisotropy constant value of 4.89 ⋅ 103 J m− 3 was used to obtain good agreement with the experiment, reflecting an axial easy axis, as deduced from the experimental values. In this case, it was concluded that the magnetization reversal is driven by the nucleation and propagation of a transverse wall, independent of the angle between the magnetization and the applied magnetic field. Actually, the same result is obtained for the other samples in this study (data not shown), although for Co50Ni50 nanowires the curling and the transverse reversal modes showed a similar coercivity: ~ 60°. Regarding the lack of perfect fitting for angles close to 0° and 90°, it is important to remember the limitations of the model, as well as the fact that it does not consider magnetostatic interactions with surrounding wires. These interactions may be responsible for an additional antiferromagnetic or ferromagnetic contribution in fields applied at 0° and 90° to the wires axis, respectively. Figure 2.11b collects the values of the crystalline anisotropy constant used in the calculations to obtain the best agreement when fitting with experimental results. This figure shows that the easy magnetization axis evolves from perpendicular (in-plane of the membrane) in the case of Co nanowires to longitudinal (parallel to the wires axis) in the case of Ni-rich alloy samples.

The temperature dependence of mr and Hc for several arrays of Co–Ni nanowires with selected compositions (Dp ~ 35 nm, Dint ~ 65 nm) is presented in the left and right panels of Figure 2.12, respectively. The evolution of these magnetic parameters is depicted for both a ![]() and ⊥ configuration of the applied field. In the case of Co25Ni75 nanowires (Figure 2.12a), corresponding to a Ni-rich sample, an effective longitudinal easy axis in the whole range of investigated temperatures is deduced, where both reduced remanence and coercivity take higher values in the parallel applied field configuration than in the perpendicular one. Increasing the Co content to Co50Ni50 (Figure 2.12b) shows that the parallel magnetic parameters still have the highest values through the changes of temperature, except at room temperature where mr has about the same value for both
and ⊥ configuration of the applied field. In the case of Co25Ni75 nanowires (Figure 2.12a), corresponding to a Ni-rich sample, an effective longitudinal easy axis in the whole range of investigated temperatures is deduced, where both reduced remanence and coercivity take higher values in the parallel applied field configuration than in the perpendicular one. Increasing the Co content to Co50Ni50 (Figure 2.12b) shows that the parallel magnetic parameters still have the highest values through the changes of temperature, except at room temperature where mr has about the same value for both ![]() and ⊥ applied magnetic field configurations. For Co-rich Co75Ni25 nanowires (Figure 2.12c), a crossover effect from parallel to perpendicular reduced remanence is observed. Also, the perpendicular coercivity values are larger than those corresponding to the Co50Ni50 case. However, lower values are observed for Hc
and ⊥ applied magnetic field configurations. For Co-rich Co75Ni25 nanowires (Figure 2.12c), a crossover effect from parallel to perpendicular reduced remanence is observed. Also, the perpendicular coercivity values are larger than those corresponding to the Co50Ni50 case. However, lower values are observed for Hc![]() when comparing again with this previous sample. Finally, for Co nanowires (Figure 2.12d), a behavior similar to that for the mr parameter is observed, whereas a crossover effect in Hc is detected, decreasing the temperature. Below 100°K, the effective anisotropy of this last system clearly lies perpendicular to the nanowires long axis.
when comparing again with this previous sample. Finally, for Co nanowires (Figure 2.12d), a behavior similar to that for the mr parameter is observed, whereas a crossover effect in Hc is detected, decreasing the temperature. Below 100°K, the effective anisotropy of this last system clearly lies perpendicular to the nanowires long axis.
 ) and perpendicular (⊥) reduced remanence (left panel) and coercivity (right panel) of arrays of Co25Ni75 (a), Co50Ni50 (b), Co75Ni25 (c), and cobalt nanowires (d).
As a summary of the comparison between parallel and perpendicular remanence and coercivity for each composition, we deduce that (i) for high Co content, there is an evolution toward perpendicular anisotropy as temperature decreases and (ii) for high enough Ni content, the parallel anisotropy is well defined through the whole temperature range. Nevertheless, a crossing temperature is observed when there is the same ratio of Ni and Co contents.
For Co–Ni nanowires, the monotonous increase in longitudinal coercivity with Ni content is ascribed to the decrease of the HCP crystal phase, as was discussed earlier. It should be mentioned that for high Ni content, a significant contribution of magnetoelastic anisotropy may be expected because of the magnetoelastic coupling between a higher magnetostriction and the mechanical stress induced by the different thermal expansion coefficients of Ni and the NAM (for these experiments the aluminum foil had been removed; Schlörb et al., 2010). On the other hand, in the case of Co-rich nanowires, the change in the crystalline anisotropy constant with temperature is expected to be more relevant. In addition, the contribution from changes in the shape anisotropy caused by variation in saturation magnetization seems to be relatively modest since the effect is observed well below the Curie temperature.
Single Co–Ni alloy nanowires have also been studied in a broad compositional range for the characterization of their magnetothermal and magnetotransport properties, paying particular attention to the magnetothermoelectric effect and thermopower response exhibited by these kind of systems at the nanoscale, together with the correlation of these effects with the anisotropic magnetoresistance phenomenon in these alloys. Absolute and relative Seebeck coefficient values in magnetic fields applied perpendicularly to nanowire axes at room temperature are determined to be 1.5 μV K− 1 for Co0.24Ni0.76 nanowires and 8.1% for Co0.39Ni0.61 nanowires. Power factors of 3.7 mW mK− 2 have been achieved, which are competitive with common values for more typical thermoelectric materials such as semiconducting bismuth telluride nanowires. For Co–Ni nanowires containing up to 39% Co, a linear relationship between the magnetic field-dependent change in the Seebeck coefficient and the electrical conductivity has been found (Böhnert et al., 2013).
Fe–Ni nanowires
The most exploited Fe–Ni alloy corresponds with 20% Fe and 80% Ni content. This alloy is commonly known as permalloy (Py). The high magnetic permeability exhibited by this material makes it interesting for magnetic cores and magnetic shielding applications. In addition, the low coercivity, negligible magnetostriction, and large anisotropic magnetoresistance, together with the possibility of reducing its size at the nanoscale, favor a wide range of applications in electrical and electronics-based nanotechnologies (Elmen and Arnold, 1923; Jiles, 1998).
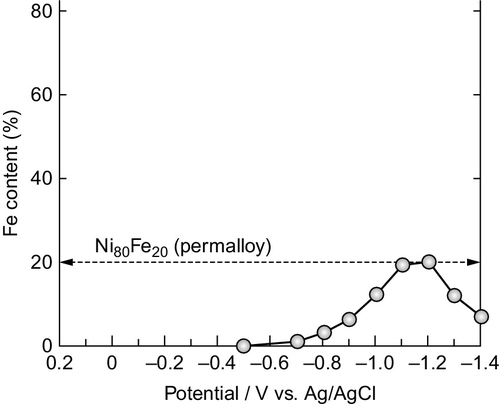
The fabrication of Py nanowire arrays by means of electrodeposition processes commonly makes use of Ni Watts-type electrolytes with the addition of FeSO4 as a source of Fe ions, among other sulfate- and chloride-based electrolytes (Cho et al., 2010). Some typical baths and operational conditions are collected in Table 2.3. Potentiosatic or galvanostatic methods provide good compositional control, as well as high homogeneity of the deposits. The electrodeposition potential usually ranges between − 1.2 and − 2 V versus a Ag/AgCl reference electrode. In Ni–Fe electrodeposition, there exists an anomalous codeposition reaction, which tends to preferentially deposit the Fe (the less noble metal); this, together with the differences in their standard electrode potentials, offers the possibility of tuning composition by controlling the electrochemical conditions. Figure 2.13 displays the Fe content in Ni–Fe nanowire arrays as a function of the deposition potential (Ohgai et al., 2005). Moreover, Salem et al. (2012) also demonstrated accurate control of Ni–Fe nanowire composition by changing the off or resting time between pulses in a pulsed potentiostatic electrodeposition process.
Table 2.3
Typical electrochemical baths and operation conditions used in the electrodeposition of nickel-iron nanowires
| Electrolyte composition | pH | Temperature | Electrochemical conditions | Reference |
| Ni(SO4)2·6H2O (0.1 M) Fe(SO4)2·7H2O (5 mmol L− 1) H3BO3 (0.2 M) NaCl (35 mmol L− 1) Saccharin (7 mmol L− 1) Sodium lauryl sulfate (0.1 g L− 1) |
2–2.6 | Room temperature | Potentiostatic | Atalay et al. (2009) |
| NiCl2 (0.6 M) FeCl2 (0.9 M) H3BO3 (0.2 M) CaCl2 (1.0 M) Ascorbic acid (0.03 M) |
As prepared | 40 °C | Galvanostatic | Cho et al. (2010) |
| NiSO4·6H2O (300 g L− 1) NiCl2·6H2O (45 g L− 1) H3BO3 (45 g L− 1) FeSO4·6H2O (6 g L− 1) |
2.8 | 25 °C | Pulsed potentiostatic | Salem et al. (2012) |

A single-phase FCC crystalline structure has been found in electrodeposited Py nanowires, which points out a reduction in the magnetocrystalline anisotropy. One effect of Fe content in Ni–Fe alloys on its crystalline structure is to change the lattice constants in such way that those increase as the Fe content increases. This is of special interest in ferromagnetic transition metals (FTMs)/copper (Cu) multilayered or multisegmented systems, where the crystalline cell size of the FTM layer should fit well to the corresponding one of the Cu layer. As a consequence of the reduced magnetocrystalline anisotropy, the effective magnetic anisotropy is determined mainly by the shape anisotropy; Py nanowires with a high aspect ratio can exhibit coercive fields as high as 1300 Oe because of the miniaturization of the material at the nanometric scale (Salem et al., 2012; Figure 2.14).
 , circles) and perpendicular (⊥, squares) to the nanowire axis (Salem et al., 2012).
As the Fe content increases, however, the average saturation magnetization value of each nanowire also increases, and the increase in the strength of the magnetostatic interactions among nanowires provokes an apparent reduction of the effective anisotropy along the nanowire axis, thus reducing both the longitudinal coercivity and reduced remanence (Pardavi-Horvath et al., 2008).
Fe–Co nanowires
Particular attention has been paid to Fe–Co alloys because of their high saturation magnetization and Curie temperature—parameters that cannot be equalized by any other alloy systems. Bulk Fe–Co alloys with Fe content in the range of 60–70 wt% have a saturation magnetization of about 2.4 T, which is much higher than Fe–Ni and Co–Ni alloys or Fe, Co, and Ni metals (Bozorth, 1993). Fe–Co alloys are used mainly as soft magnetic materials because of their low coercivity and low magnetocrystalline anisotropy (Turgut et al., 1998; Yu et al., 2000). The first-principles calculations predict that tetragonal Fe–Co alloys with a very specific structure and alloy concentration have much improved properties for future applications: a large saturation magnetic moment and a giant magnetocrystalline anisotropy (Burkert et al., 2004). Fe–Co nanowires, however, show high coercivity and squareness, properties that make them good candidates as hard magnetic materials. A number of studies have reported the evolution and correlation of magnetic properties with the microstructure for arrays of nanowires with different composition and geometric characteristics (e.g., nanowire length and diameter; Fodor et al., 2002; Qin et al., 2002, 2003; Ramazani et al., 2011, 2012). This section deals with the evolution of magnetic properties with the composition and diameter of CoxFe100–x nanowires and their correlation with the corresponding crystal symmetry.
CoxFe100–x (0 ≤ x ≤ 100) alloy nanowires were grown into the nanopores of NAMs at room temperature using DC electrodeposition in a three-electrode electrochemical cell equipped with an silver/silver chloride (Ag/AgCl) reference electrode, a platinum (Pt) mesh counter electrode, and a gold-coated membrane acting as a working electrode. The wires were grown using sulfate-based electrolytes containing CoSO4 · 7H2O (0.02–0.16 M) + FeSO4 · 7H2O (0.02–0.16 M) + H3BO3 (0.16 M) + ascorbic acid (0.06 M). Fe and Co nanowires were prepared by electrodeposition using the electrolytes FeSO4 · 7H2O (0.22 M), H3BO3 (0.16 M), and ascorbic acid (0.06 M; Fe nanowires) and CoSO4 · 7H2O (0.36 M) and H3BO3 (0.16 M; Co nanowires). The pH value was kept constant at ~ 3.0. The geometric characteristics (length and diameter) of the pores of the templates, as well as of the final nanowires, were determined by SEM. The final lengths of the nanowires were around 3 and 4 μm for the samples with a 40-and 20-nm diameter, respectively.
Over a wide composition range, Fe100–xCox alloys exist in the BCC (α) phase. The phase diagram for bulk Fe–Co is shown in Figure 2.15. In the range of 22 < x < 70, Fe–Co alloys undergo a phase transformation from a disordered BCC structure (α) to an ordered caesium chloride structure (α2) below 730 °C (Bozorth, 1993). At high temperatures (up to 983 °C), equiatomic Fe–Co alloys present an α BCC structure.

For x > 50, the BCC phase intersects with a region with mixed FCC Co (γ) and BCC Fe (α) phases. For Co concentrations less than about 17%, the Curie temperature is reached before the to α-to-γ phase transition (Nishizawa and Ishida, 1990).
The XRD patterns of NAMs filled with CoxFe100–x nanowires with a 40-nm diameter are shown in Figure 2.16a. The results show cubic symmetry in the whole range of compositions that evolve from a BCC structure for pure Fe nanowires and those with small amount of Co toward FCC as Co content increases. For high Co content, including pure Co nanowires, the only stable phase is the γ phase, FCC structure with a [110] preferred orientation. A similar compositional evolution of the crystalline structure is found for CoxFe100–x nanowires with a 20-nm diameter (Figure 2.16b): (1) BCC cubic crystals with [110] texture for lesser Co content up to pure Fe nanowires, (2) FCC crystals with [110] texture for high (around 90%) Co content, and (3) HCP hexagonal symmetrical structure with [100] texture for pure Co nanowires. A cubic symmetry is observed in the whole range of compositions that evolve from a preferential FCC structure toward a BCC structure as Fe content increases. For x < 78, we obtain a BCC structure with a [110] preferred orientation. We should note that an α-to-γ phase transition in CoxFe100–x alloy occurs at x ≥ 78, in agreement with previous reports of bulk and thin-film alloys (Kakuno et al., 1997; Hunter et al., 2011). Fe22Co78 nanowires exhibit a mixed BCC and FCC structure with a [110] BCC preferred orientation. By further increasing the Co content, the only stable phase is the γ-phase FCC structure with a [110] preferred orientation. Similar data were reported for Co nanowires with diameters between 20 and 30 nm (Cattaneo et al., 2012; Kaur et al., 2013; Yuan et al., 2014). Based on a comparison of Figure 2.16a and b, we can deduce that a small amount of Fe content seems to be enough to promote FCC cubic symmetry (Bran et al., in preparation). It should be pointed out that, according to previous reports, Co wires can also crystallize into an FCC structure.

A number of studies have focused on the structural characterization of Fe–Co nanowires (Menon et al., 2001; Qin et al., 2002, 2003; Ramazani et al., 2011, 2012). They show similar phase transitions with various alloy compositions but few differences in phase boundaries. Zhan et al. (2002) showed that for Fe–Co nanowires with a 20-nm diameter the α-to-γ phase transition occurs at higher Co concentration (82 < x < 90), whereas the γ-to-ɛ transition (HCP phase) occurs at x > 92. Fodor et al. (2003) reported the structural and magnetic characterization of Fe–Co nanowires with a diameter of 40 nm. The increase in Co concentration in the alloy promoted only a transition from the BCC to the HCP phase, starting with x = 90.
The magnetic characterization of Fe100–xCox nanowires presented by many authors (Menon et al., 2001; Zhan et al., 2002; Qin et al., 2002, 2003; Fodor et al., 2003; Ramazani et al., 2011, 2012) shows similar trends in the evolution of coercivity and remanence with an applied field with different values for coercivity, remanence, and saturation magnetization. The high aspect ratio of the nanowires results in a strong shape anisotropy, which is considerably larger than magnetocrystalline anisotropy, forcing the easy magnetization axis to lie along the nanowire axis. The magnetic characteristics of the nanowire arrays have been determined using vibrating sample magnetometry under a maximum field of ± 2 T applied parallel and perpendicular to the nanowire axis. The magnetization curves and their hysteresis parameters under a magnetic field applied parallel to nanowire axes have been determined as a function of nanowire composition and diameter. Figure 2.17 shows the evolution of coercivity (a) and squareness ratio (Mr/Ms) (b) under a magnetic field parallel to the nanowire axis for arrays of 40- and 20-nm diameter nanowires as a function of composition. By increasing the Co content, the coercivity increases, reaches a maximum at about 90% Co, and then decreases for pure Co nanowires. Values of coercivity > 0.27 T and a squareness ratio > 0.9 were obtained for the Co-rich samples with a diameter of 20 nm. As reported before, by increasing the wire diameter, the coercivity, and squareness decrease gradually because of the increased magnetostatic interactions between the nanowires as they become closer to each other (the diameter varies with a constant center-to-center distance). A maximum value for the saturation magnetization of about 2.35 T is obtained for the Co40Fe60 alloy nanowires.

A straight comparison of experimental data indicates that (1) for both coercivity and the squareness ratio, a similar trend with composition is observed for 40- and 20-nm diameter nanowires: After a nearly continuous increase in Co content, maximum values are observed for 80–90% Co. (2) Overall smaller values of coercivity and squareness ratio are observed for 20-nm diameter nanowires for small and intermediate Co content, whereas a kind of overlapping/crossing effect occurs for nanowires with high Co content and pure Co nanowires. The magnetic behavior of nanowires, such as the coercivity, remanence, and shape of the hysteresis curve, depends strongly on the magnetization reversal process.
The increase in coercivity can be explained using micromagnetic simulations, where a polycrystalline structure is considered for both Co and Co–Fe nanowires with the corresponding FCC and BCC phase. As for the magnetic parameters for FCC Co, we used a saturation magnetization Ms = 1440 emu cm− 3, exchange constant A = 13 × 10− 7 erg cm− 1, and magnetocrystalline anisotropy constant K = 2.7 × 10⁶ erg cm− 3, whereas for BCC Co–Fe, we consider Ms = 1600 emu cm− 3, A = 10.7 × 10− 7 erg cm− 1, and K = 105 erg cm− 3 (Vivas et al., 2011; Ferré et al., 1997). To account for the actual polycrystalline nature of nanowire structures, a meshed tetrahedral (mesh size is 4 nm) was randomly assigned to corresponding textured phases. The [111] direction for FCC Co and the [110] direction for BCC Fe–Co were considered parallel to the nanowires axis, whereas the in-plane easy axis components were considered random.
Figure 2.18 presents the micromagnetic simulation of magnetic loops for FCC Co and BCC Fe–Co nanowire arrays in a parallel field configuration (Bran et al., 2013a,b). Both loops are characterized by a high squareness ratio, which is reasonable considering that the shape overcomes the crystalline anisotropy term. The Co FCC phase has a significantly stronger magnetocrystalline anisotropy, with a net component along the axial direction that reinforces the shape anisotropy. As a result, FCC Co coercivity and remanence take higher values than for the arrays of BCC Co–Fe nanowires that present with a weaker cubic magnetocrystalline anisotropy. Micromagnetic simulations indicate that the magnetization reversal proceeds by vortex domain wall propagation in both cases.

Simulated loops in Figure 2.18 are for given anisotropy strength values for FCC and BCC structures and fit only to some extent the data in Figure 2.18 for a wide range of Co–Fe alloy compositions. Full interpretation of data in Figure 2.18 should involve essentially the consideration of the role played by crystalline anisotropy with relative Co/Fe content. One can deduce an overall agreement in the trend of increasing coercivity with Co content because the FCC phase plays a more dominant role. The lack of full agreement can be understood considering different arguments: (1) an increase in the crystallite size with Co content (Cooper et al., 2005); (2) the defects and inhomogeneities in the samples due to the rapid deposition of Fe2 + and Co2 + ions, which can enhance coercivity (Qin et al., 2003); (3) small fluctuations in the diameters from sample to sample; and (4) magnetostatic interactions in a large-scale array.
Many groups (Zhan et al., 2002; Su et al., 2005) interpret the magnetization reversal mechanism in Fe–Co nanowires using a model based on “chains of spheres” (Jacobs and Bean, 1955), where each nanowire is considered to be a chain of single domain spheres with uniaxial magnetic anisotropy connected with each other by a single contact point, which make them magnetically isolated. The calculated coercivity of the nanowires using the chains of spheres model is in good agreement with the experimental results presented by the authors.
FeCoNi nanowires
Ni–Fe (Py) is one of the softest materials used in the industry, as mentioned above. It has low saturation magnetization, however, which may limit its application in, for instance, magnetic recording media. Co–Fe alloys were proposed to be an appropriated substitute for the Py to enhance the saturation magnetization; however, this alloy comes together with a magnetic hardening of the material. Another step in creating a soft magnetic material with high saturation magnetization is the combination of both previous compositions in a FeCoNi ternary alloy for, among others, high-frequency magneto-impedance applications (Atalay et al., 2013). In addition, these alloys can exhibit magnetostriction, which is interesting for the development of several sensors and actuators.
Sulfate-based and chloride-based electrolytes are commonly used in the fabrication of magnetic thin films and nanowires by means of electrochemical deposition processes. Depending on the relative concentration of the different ion sources, the composition can be tuned under the same electrochemical conditions. The pH usually ranges from 2.6 to 3.6, which also influences on the morphology and structure of the deposit (Kockar et al., 2013). Sometimes calcium chloride and ascorbic acid are added to the electrolyte to increase its conductivity and avoid Fe oxidation, respectively. Potentiostatic, galvanostatic, and alternating current (AC) electrodeposition methods have proved suitable for the fabrication of FeCoNi nanowire arrays via the template-assisted method.
As Fe, Ni, and Co crystallize into BCC, FCC, and HCP structures, the crystalline structure shown by electrodeposited FeCoNi depends strongly on the composition, and in many cases a mixture of crystalline phases is observed (Myung and Nobe, 2001; Kim et al., 2003; Yoo et al., 2006; Liu et al., 2011; Rafailovic et al., 2012).
For low Co contents without considerable HCP-phase crystallization, the magnetic shape anisotropy is dominant, resulting in an easy magnetization axis along the nanowire for large enough aspect ratios. However, the increase of saturation magnetization with respect to Py nanowires results in an increase of the magnetostatic interaction between nanowires, reducing the longitudinal coercive field values of FeCoNi nanowire arrays bellow those estimated from shape anisotropy calculations (Sharma and Grimes, 2004).
2.2.2 Other transition metal-based alloys (magnetic metal-nonmagnetic metal alloys)
2.2.2.1 Co–Cu nanowires
A Co–Cu alloy shows different magnetic behaviors depending on the composition, as well as the fabrication procedure. In principle, Co–Cu forms a granular alloy because Co and Cu are poorly miscible. In this case, the formation of ferromagnetic clusters embedded in a nonmagnetic and conductive matrix makes this system interesting, especially in applications based on giant magnetoresistance (GMR; Berkowitz et al., 1992; Xiao et al., 1992). By contrast, electrodeposition is a good technique to produce Co–Cu solid solutions where Cu atoms substitute Co sites, forming a real alloy (Zaman et al., 1998; Bakkaloglu et al., 1998). The addition of Cu distorts the Co lattice parameters, strongly affecting the magnetic properties of the material and becoming an additional tool to tune the overall magnetic behavior of magnetic nanowire arrays (Karaagac et al., 2010; Kashi et al., 2011; Yang et al., 2011a,b).
The most common electrolithic bath used in the electrodeposition of Co–Cu nanowires into the pores of NAMs is based on the sulfates of Co and Cu salts and the addition of H3BO3 to stabilize the pH of the electrolyte. Another option is adding copper(II) hyposulfite to the Co Watts-type electrolyte that offers high current densities. Moreover, it has been well demonstrated that under DC potentiostatic electrodeposition, the composition of Co–Cu nanowires can be tuned because of the difference between the standard electrode potential of Co and Cu (Karaagac et al., 2010; Liu et al., 2007, 2013; Darques et al., 2006). Moreover, such difference can provide almost the whole range of compositions by varying the electrodeposition potential from typical values ranging from − 0.6 to − 1.6 V versus Ag/AgCl reference electrode, depending on the relative concentration of the different salts in the electrolyte, as well as the pH value. Furthermore, the standard electrode potential of Cu is smaller than that of Co, which makes possible the electrodeposition of pure Cu nanowires from baths containing Co ions, a fact that is interesting when creating barcode nanowires with magnetic–nonmagnetic layers, as is described in the following section. AC electrodeposition methods also have been used in several works, and the time between pulses also has a strong impact on the composition of the nanowires (Wang et al., 2006, 2008; Kashi et al., 2011; Lin et al., 2012). XRD and high-resolution transmission electron microscopy with selected area electron diffraction analysis (HR-TEM-SAD) have been extensively used in the literature to study the crystalline structure and texture of Co–Cu nanowires fabricated using different electrochemical procedures. In general, depending on the composition, the crystalline structure of the Co–Cu nanowires also changes from the HCP phase in Co-rich nanowires, increasing the amount of FCC phase when the amount of Cu is increased. However, not only the composition changes the crystalline properties of the electrodeposited nanowires; the pH does as well: the higher the pH, the larger the amount of FCC present in the alloy (Liu et al., 2007; Figure 2.19).

There is a large controversy concerning the question of whether the Co and Cu can form a real solid solution instead of a granular alloy. For Co-rich nanowires, Cu tends to form clusters but also can substitute Co sites, distorting the cobalt crystalline lattice.
The possibility of controlling the composition, morphology, and crystalline structure has a strong impact on the magnetic properties of Co–Cu nanowire arrays. Fabricating Co–Cu nanowires in such way that a high aspect ratio is ensured (a small nanowire diameter with respect to a long length), and then favoring uniaxial magnetic anisotropy with the easy magnetization axis pointing along the nanowires, the effect of Cu, in the case of DC electrodeposition, magnetically hardens the magnetization reversal process of the nanowire. Figure 2.20 displays the longitudinal HLs for three Co–Cu compositions, as well as their longitudinal coercivity. As can be seen, the addition of as little as 8 at% Cu increases the coercivity to more than 500 Oe. It is worth mentioning that by means of AC electrodeposition, the effect of Cu is exactly the opposite. As a result, the electrodeposition conditions and the dynamics of the process strongly affect the distribution of Cu along the nanowires, modifying their magnetic properties. However, paying attention to the Co92Cu8 longitudinal HL in Figure 2.20a, two different magnetic contributions are clearly evidenced. Focusing on the descendant branch of the HL, the magnetization goes down from the saturation nearly following the HL of the pure Co nanowires. As the magnetization reaches a zero value at the coercive field, its HL approaches that of Co73Cu27. That change in susceptibility can be compared with what happens in the rest of the samples in such way that the softer magnetic phase could be related to the pure Co nanowire array and the harder magnetic phase with the nanowire array with high Cu content.
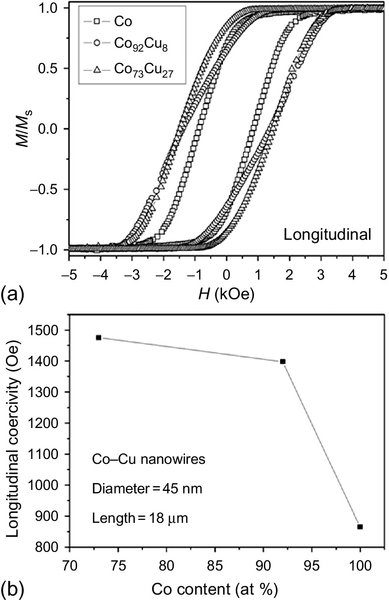
First-order reversal curves (FORCs) analysis has been extensively used for magnetic characterization in arrays of magnetic nanowires (Béron et al., 2010). It is based on the Preisach model of hysteresis, which had to be adapted for the interpretation of magnetic behavior in real magnetic systems (Preisach, 1935; Della Torre, 1999; Mayergoyz, 1986, 1991). FORC analysis based on the three kinds of nanowire arrays (Figure 2.21) along the nanowire axis gives valuable information about magnetization processes and interactions that are taking place inside the materials when they are magnetized. In the case of Co and Co73Cu27 nanowire arrays, the typical “wishbone” shape characteristic of a magnetostatic interaction among nanowires is observed (Pike et al., 2005). The main difference between them has already been displayed in the HL, that is, the harder magnetic behavior of the Co73Cu27 nanowires. The values extracted from the FORC profiles at zero value of the interacting field axis, Hu = 0 Oe, reveal coercive fields of 826 and 1513 Oe for pure Co and Co73Cu27 nanowire arrays, respectively. This is, however, the only difference between them, since the standard deviation of the switching field distributions (SFDs), as well as the strength of the interaction field at saturation (α), are the same in both cases, around 260 and 1650 Oe, respectively. Therefore it is reasonable to think that these previous parameters are mainly ascribed to the characteristics of the patterned alumina templates that match the nanowires grown inside the pores of the alumina membranes. In the first case, the standard deviation could be due to a distribution of different pore diameters produced during the anodization. The FORC diagram for the Co92Cu8 sample displays a more complex behavior. Two different distributions are clearly observed, both very close to each other. The main distribution, shifted to negative values of Hu, is centered at the same coercive field value as the sample Co73Cu27, whereas the one shifted to positive values of Hu corresponds to the coercive field of the pure Co nanowire array. The fact that both distributions are shifted along the interaction field axis suggests that both distributions are submitted and contribute to the same mean field interaction.
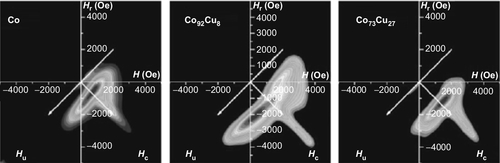
2.2.2.2 FeCoCu nanowires
FeCoCu was developed as a soft magnetic material; the addition of Cu to the Co-rich Fe–Co refines the grain size and enlarges the range in which a mixed FCC/BCC structure is obtained (Cooper et al., 2005). The magnetic properties of Fe–Co alloy nanowires, such as coercivity and remanence, are changed easily by tuning and adjusting the alloy composition or adding other elements (Ciureanu et al., 2005; Liu et al., 2006; Yang et al., 2011b) or by applying adequate thermal treatments.
NAMs were prepared by a double anodization process in different acidic baths following a well-established process (Vázquez et al., 2004a,b), obtaining templates with 20- and 40-nm pore diameters with corresponding interpore distances of 53 and 105 nm, respectively. Fe28Co67Cu5 nanowires, hereafter referred to as FeCoCu nanowires, were grown into the NAM pores by electrodeposition from a sulphate-based electrolyte containing CoSO4 · 7H2O (0.12 M) + CuSO4 · 5H2O (0.01 M) + FeSO4 · 7H2O (0.09 M) + H3BO3 (0.16 M) + ascorbic acid (0.06 M). The pH value of the electrolyte was maintained at about 3.0.
Incorporating a small amount of Cu (i.e., 5%) does not modify essentially the structure of Fe–Co nanowires. As an example of the evolution of the structure of nanowires with thermal treatment, Figure 2.22a shows the XRD pattern of as-prepared Co67Fe28Cu5 nanowires, indicating that nanowires crystallize in a BCC FeCo phase with a [110] texture. No additional XRD peak corresponding to any Fe, Co, or Cu oxides was observed in as-prepared samples.

The influence of thermal annealing in the structure is shown in Figure 2.22b and c. Annealing at moderate temperatures up to ~ 450 °C (Figure 2.22b) does not significantly modify the structure compared with the as-prepared state (Figure 2.22a), resulting only in a better texture definition with an increase of the [110] peak intensity and the disappearance of the [211] peak. After annealing at increasingly higher temperatures (475 °C in Figure 2.22c), first additional peaks (marked by arrows), which can be assigned to CoO [200] and Fe2O3 [220] oxides, are observed, together with a degradation of the [100] peak. Further deterioration is achieved after annealing at higher temperatures, where membrane and nanowires also undergo bending (Bran et al., 2014). To visualize the crystallites size and their distribution within nanowires with a 40-nm diameter, in an as-prepared sample and a sample annealed at 700 °C, bright field-dark field studies were performed (Rodríguez-González et al., 2014). The nanowires were imaged as they were embedded in the NAM templates. Figure 2.23a and b shows a pair of bright field-dark field images of the very same area of as-prepared FeCoCu nanowires, while Figure 2.23c and d corresponds to the very same area on the sample after thermal treatment at 700 °C. Based on the images we have estimated an average diameter of 40 nm for nanowires in the as-prepared sample (in agreement with the average value estimated from SEM images), and it reduces to about 37 nm for the annealed sample.
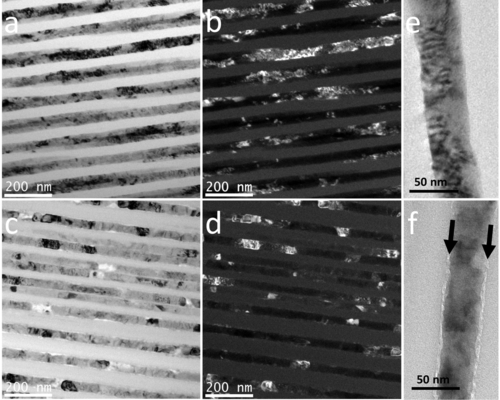
The comparative observation of the images of individual nanowires inside the template for as-prepared (Figure 2.23e) and annealed (Figure 2.23f) samples reveals the presence of an external region with different contrast in the annealed nanowire; this region can be checked in some portions of Figure 2.23c and is marked by the two arrows in Figure 2.23f. After careful analysis, we are inclined to suggest that in some places on the interface between the nanowire and the aluminum oxide, there is a gap that corresponds to ~ 3 mm of shrinkage in the nanowire’s average diameter; this is connected to a thermal effect induced by the annealing.
The magnetic characterization, particularly the coercivity, is analyzed at room temperature as a function of the annealing temperature for Co–Fe and CoFeCu nanowires embedded in the templates. Particular attention is paid to the influence of the presence of Cu and to the modifications of structure and magnetic properties induced during thermal treatments. The evolution of the main magnetic parameters of the HLs for the series of samples CoxFe(100–x) and CoxFe(95–x)Cu5, with a 20-nm diameter, is depicted in Figure 2.24. For the CoxFe(100–x) series, an overall parallel increase of coercivity and remanence with Co content was observed. A reduction is obtained for the sample with the higher Co content. Similar trends with Co content are found in the case of the CoxFe(95–x)Cu5 samples. By comparison, a small deterioration in both coercivity and remanence is observed for the samples containing Cu. For the range of investigated compositions, the saturation magnetization takes a value of 2.25 ± 0.1 T, while it decreases to around 2.0 T after adding Cu in the indicated amount (Bran et al., 2014).

The HLs under an applied magnetic field parallel to the nanowires axis were measured at room temperature for as-prepared samples and after annealing in the temperature range from 300 to 800 °C (Rodríguez-González et al., 2014; Figure 2.25a). For a better description of the influence of thermal treatments, the evolution of coercivity and squareness is shown in Figure 2.25b. As observed, the squareness takes a value of 0.71 in the as-prepared state, and it increases gradually as the annealing temperature increases and reaches a maximum of 0.91 for the sample annealed at 700 °C; then it decreases to 0.74 by further increasing the annealing temperature to 800 °C. Squareness takes very small values (< 0.1) in the case of HLs under an applied magnetic field perpendicular to the nanowires. The inset in Figure 2.25a shows an example of a HL measured with the field applied perpendicular to the as-prepared nanowires. Consequently, we can deduce that in all cases the easy magnetization axis lies along the nanowire’s axis (i.e., perpendicular to the membrane’s plane).
 ) and perpendicular (⊥) to the nanowire axis. (b) Evolution of coercivity (Hc) and squareness (M/Ms) as functions of the annealing temperature.
A similar evolution was observed for coercivity (Figure 2.25b). Again, the coercivity increases with annealing temperature and reaches a maximum after annealing at 700 °C, then decreases by increasing further the annealing temperature.
To determine the influence of annealing on the magnetic properties of FeCoCu nanowires with a diameter of about 20 nm, the samples were heated at 300, 400, 480, 500, 520, 535, and 550 °C in an argon atmosphere for 2 h, along with alumina templates (Bran et al., 2013b). The results are presented in Figure 2.26a. When the magnetic field is applied along the nanowire axis, the coercivity increases with temperature and reaches a maximum at 500 °C, then decreases by increasing further the temperature. The squareness of all annealed samples at 500 °C was around 0.95.

The increase in coercivity and squareness in the nanowires after annealing can be explained by a reduction of the internal stresses in the sample. When the samples are heated, the internal stresses accumulated during the electrodeposition process decreases and the atoms tend to recombine to reach a more stable state. Consequently, a higher degree of crystallinity is obtained. Annealing at a high temperature results in an increase in the crystallite sizes (a much narrower [110] peak for the annealed sample), as well as in a reduction of defects in the sample (Guo et al., 2003; Qin et al., 2003; Tang et al., 2004).
Above 500 °C, FeCoCu nanowires would react with the oxygen that exists in the nearest environment surrounding the pores of the NAM template, which would reduce the anisotropy along the wire axis; thus the Hc and Mr/Ms would decrease (Guo et al., 2003; Qin et al., 2003; Tang et al., 2004). Figure 2.26b shows the dependence of coercivity and squareness on the nanowire diameter, showing a reduction in remanence with increasing nanowire diameter, which can be attributed to the enhanced magnetostatic interactions as the wires get closer, while the decrease in coercivity is mainly due to the nanowire’s “shape anisotropy” effect (Vázquez et al., 2004a,b; Zeng et al., 2000). Regarding the anisotropic magnetic behavior of the samples, parallel and perpendicular HLs for nanowires with an 18-nm diameter were measured in an as-prepared state and after annealing at 500 °C (Figure 2.26c).
It can be deduced from magnetic measurements that the easy magnetization axis lies along the nanowire axis (i.e., perpendicular to the membrane’s plane). The coercivity and squareness measured in an as-prepared state were 0.26 T and 0.945, respectively. The magnetic properties of the sample improve considerably after thermal treatment at 500 °C: The coercivity and squareness increased up to 0.36 T and 0.98, respectively. When the applied field is oriented perpendicular to the nanowire axis, the HLs are shared; in this case, the coercivity and the squareness are less than 0.05 T and 0.04, respectively, for both samples.
The influence of the geometric characteristics of the nanowires and the conditions of confinement inside the alumina membranes during the annealing should be pointed out. The present results correspond to thermal treatments performed in nanowires with a diameter of ~ 18-20 nm, arranged hexagonally, with and interwire distance of 53 nm. The annealing temperature at which larger hardening is achieved corresponds to 450–500 °C. For nanowires with a 40-nm diameter embedded into a template with higher separation among them (i.e., 105 nm), the optimal annealing temperature increases to ~ 700 °C. Changes in the optimal annealing temperature also are observed for nanowires with different diameters or lengths but with the same interwire distance (Bran et al., 2014). All these results indicate that the structure and magnetic properties after annealing are significantly dependent on the effective stresses and the effective degree of oxidation induced on the nanowires by the alumina surrounding the nanowires. After annealing at optimal temperature conditions, however, a magnetic hardening is observed for all the Co–Fe and CoFeCu samples; such hardening is more effective in the samples containing Cu. For example, measurements taken at room temperature for the wires with a 20-nm diameter indicate that for Co65Fe35 and Co78Fe22 samples, coercivity slightly increases with annealing in both cases, from around 0.28 to 0.30 T. On the other hand, Co67Fe28Cu5 and Co75Fe20Cu5 increase coercivity from 0.26 to 0.37 T and from 0.25 to 0.31 T, respectively, with optimal annealing.
Figure 2.27 shows the dependence of coercivity on measuring temperature for as-prepared Co67Fe28Cu5, as well as for annealed Co78Fe22, Co75Fe20Cu5, and Co67Fe28Cu5 nanowire samples. We observed notable differences between the following samples: (1) as-prepared and annealed CoFeCu samples, particularly Co67Fe28Cu5 nanowires and (2) Co–Fe and CoFeCu annealed samples.
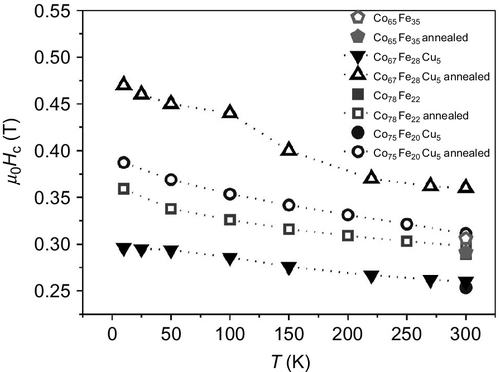
The structural and magnetic characterization of FeCoCu nanowires was reported by only a few groups. Using AC pulse electrodeposition, the Cu content was controlled by off time between pulses. Increasing the off time between pulses increased the Cu from 12% to 84% by substituting Co and Fe atoms with Cu during electrodeposition. Magnetization and coercivity decrease with increasing Cu content. After annealing, the coercivity was improved, and an increase in magnetization was observed for the sample with high Cu content (Almasi-Kashi et al., 2013).
2.2.2.3 Co–Pt nanowires
Co–Pt alloys are excellent candidates for applications in high-density information storage in magnetic recording media because of their high uniaxial magnetic anisotropy constant K1, which takes values of 4.9 × 10⁷ erg cm− 3 for Co–Pt and 2.0 × 10⁷ erg cm− 3 for Co3Pt, with respective saturation magnetization values of 800 and 1100 emu cm− 3 (Weller et al., 2000). Depending on the Co-to-Pt ratio, Co–Pt alloys can crystallize in a face-centered tetragonal (FCT) phase L10, which is observed in almost equiatomic compositions, or in a hexagonal phase observed in Co3Pt (Harp et al., 1993; Weller et al., 2000).
Although Co–Pt alloys are usually grown by molecular beam epitaxy or DC magnetron sputtering, electrochemical deposition of these alloys into nanoporous templates allow Co–Pt nanowire arrays to be obtained. Huang et al. (2002) electrodeposited Co–Pt nanowire arrays into anodic alumina templates from an electrolytic bath containing Co and Pt chloride salts CoCl2 and PdCl. The as-deposited nanowires showed soft magnetic properties but, upon annealing at 700 °C, they crystallized into an ordered FCT structure that coexists with the FCC structure, leading to coercivities of 0.97 and 2.56 kOe in the parallel and perpendicular direction with respect to the nanowire axis. Yasui et al. (2003) reported highly oriented L10 Co–Pt nanowires deposited from cobalt(II) sulfate and hexachloroplatinic acid containing H3BO3 and manganese(II) sulfate onto a Pt [001] underlayer that served as the working electrode. These nanowires, with a diameter of about 80 nm, showed high coercivity values of 7.4 kOe in the perpendicular direction with respect to the nanowire’s long axis and around 5 kOe in the parallel direction after annealing at 700 °C.
Mallet et al. (2004) deposited Co–Pt nanowires from cobalt(II) sulfate and diamminedinitritoplatinum, obtaining nanowires with a Co65Pt35 composition, which showed coercivity values of around 2 kOe for small-diameter nanowires (< 100 nm) and around 0.5-1 kOe for those with larger diameters (> 200 nm). A similar electrolyte was used by Gao et al. (2008) to produce Co52Pt48 nanowires with an ~ 10-nm diameter, which showed a coercive field along the nanowire axis of 4.5 kOe at low temperature (5°K).
Some other groups also fabricated CoxPt100–x nanowires with 7 < x < 100; most of the cases reported coercivity values of around 1-3 kOe, which were in some cases noticeably affected by thermal annealing at temperatures around 600–700 °C (Li and Shen, 2005; Gao et al., 2006; Shamaila et al., 2008; Khurshid et al., 2009; Wen et al., 2013b; Cortés et al., 2013).
2.2.2.4 Transition metal (Ni, Fe, Co)/palladium-based alloys
The alloying of FTMs with palladium (Pd) can make Pd in ferromagnetic even with additions of FTMs as little as 0.1 at.% (in the case of Co; Nagle et al., 1962; Noce et al., 2006; Noce et al., 2007). Furthermore, FTM/Pd-based alloys exhibit interesting magnetic and physicochemical properties that are of special interest in several applications. In the case of the Fe100–xPdx alloy, this material presents a structural austenite-to-martensite transition when x = 30 (Sohmura et al., 1980; Matsui et al., 1980; Prida et al., 2008), making it interesting for applications based on the ferromagnetic shape memory effect, which can be driven by varying either the temperature or the applied magnetic field. A high uniaxial crystalline anisotropy is observed when the composition is equiatomic (x = 50) because of the development of the L10-ordered ferromagnetic phase (Fei et al., 2007), which can be useful for magnetic data storage devices. In this way, Co–Pd alloys also present a strong uniaxial magnetic anisotropy, which, combined with the high Kerr rotation effect exhibited by these alloys, make them excellent candidates for magnetic and/or magneto-optical information storage devices (Gan’shina et al., 1998). In addition, Ni–Pd alloys exhibit a large magnetic moment effect because of the nature of the intermetallic Ni–Pd bonding (Moriya, 1965; Ai et al., 2010).
In addition to their interesting magnetic properties, Pd and Pd-based compounds also exhibit a good mechanical hardness and excellent corrosion resistance (Abys et al., 1999), and they are well-known catalysts for several chemical reactions of technological and environmental interest (Tsuji, 2004). Furthermore, the unique properties of the strong interaction between Pd and hydrogen atoms have been demonstrated to be advantageous in hydrogen sensing and storage—topics of outstanding relevance because of emerging hydrogen-based power generation technologies (Bryden and Ying, 2002; Tominaka et al., 2008).
The electrodeposition of FTM–Pd alloy nanowires have required extensive study because of the large difference in the values of the standard reduction potentials of Pd2 + (0.92 V) and Fe2 + (− 0.44 V), Co2 + (− 0.28 V), or Ni2 + (− 0.26 V) ions, which makes difficult the codeposition of alloys of those metals from a single bath (Hu et al., 2006; Xu et al., 2006). However, the use of certain additives, such as ammonia, brings together the standard reduction potentials of these metals by complexing Pd2 + ions, leading to the formation of (Pd(NH3)4)2 + complexes, which have a standard reduction potential of 0.0 V (Yoo et al., 2007). Some authors have studied the influence of complexing agents, such as ethylenediamine (Ding et al., 2003), glycine (Takata and Sumodjo, 2007), or ammonia (Yoo et al., 2007) in the electrodeposition of Pd and Pd alloy. However, Co–Pd alloy nanowires can also be deposited from noncomplexed electrolytes containing Pd2 + and Co2 + ions (Hu et al., 2006).
The electrodeposition of FTM–Pd alloys with nanowire geometry starting from a chloride-based electrolyte containing ammonia has been deeply studied by Yoo et al. (2007) and Vega et al. (2012b, c). In these cases, the electrolytes are created with ammonia, 0.2 M ammonium citrate, 2 mmol/L PdCl2 as the Pd2 + ion source, and 18 mmol/L of FeCl2, CoCl2 or NiCl2 as the sources of Fe2 +, Co2 +, or Ni2 + ions, respectively. Palladium chloride is first dissolved into concentrated hydrogen chloride and then diluted ammonia is slowly added, resulting in the formation of a (Pd(NH3)4)2 + solution. Citric acid and Fe, Co, or Ni chlorides are separately dissolved from the PdCl2 solution, and the pH of the solution is slowly increased up to ~ 8.5 by adding diluted ammonia. The solutions are then mixed, and the final pH is adjusted to 9 by conveniently using either diluted ammonia or hydrogen chloride. Once the electrolyte is obtained and stable, DC potentiostatic or galvanostatic electrodeposition processes are commonly applied. Vega et al. (2012c) pointed out that by varying the current density in galvanostatic electrodeposition, the composition of the FTM–Pd alloy can be tuned, as is summarized in Figure 2.28a. Moreover, this study has been performed using templates with a 70-nm pore diameter and a 105-nm interpore distance (Figure 2.28a). Figure 2.28b-d displays a cross-sectional SEM image of each kind of alloy nanowire: Fe–Pd, Co–Pd, and Ni–Pd, respectively.

Based on EDX-SEM characterization, Fe–Pd nanowires show a wide variation in Pd content, ranging from 63.3 at% for the lowest current density (2 mA cm− 2) down to 27.7 at% for an intermediate current density of 5 mA cm− 2. Further increases in the current density result in a progressive reduction of the Pd content in the Fe–Pd alloy. Co–Pd alloys display a smaller composition variation with the current density but a trend similar to those of Fe–Pd alloys. The Pd content decreases from 28.4 to 27.5 at% in the low current density range (2–7 mA cm− 2), whereas an increase and a further decrease in the Pd content is observed for 10 and 15 mA cm− 2, respectively. Finally, Ni–Pd alloys show a slight increase in Pd content with the electrodeposition current density, ranging from 10 at% Pd for 2 mA cm− 2 up to 19 at% for 15 mA cm− 2. In principle, the higher the current density, the faster the electrodeposition process if it is assumed that the efficiency of the process is constant. However, in the work by Vega et al. (2012c), the electrodeposition in all cases is carried out with the same total charge, that is, maintaining constant geometrical features for the templates should result in nanowires with the same average length. Figure 2.29b displays a change in the nanowire length when the current density is varied. This fact indicates substantial variations in the efficiency of the electrodeposition processes, which can vary from almost 0% up to 25% for Pd alloys, depending on the growth conditions used (Hernández et al., 2008).
The crystalline structure greatly depends on the FTM involved in the alloy. Fe–Pd nanowires with high Pd content (Fe60Pd40 and Fe52Pd48) display an FCC majority crystalline phase in which Pd atoms incorporate into the FCC lattice of Fe, whereas for nanowires with higher Fe content (Fe70Pd30 and Fe72Pd28), the BCC phase is the major crystalline phase. Co–Pd nanowires have an HCP crystalline structure in all the compositions shown above as a result of the high Co content in the alloy. It is worth noting that the presence of a minority FCC phase cannot be disregarded. Finally, Ni–Pd nanowires display an FCC crystalline structure typical of Ni, in which Pd atoms integrate by partially substituting the Ni atoms.
Since the shape anisotropy of these FTM–Pd nanowire arrays is relatively low, the magnetic properties should be more dependent on the crystalline structure and the Pd content of the nanowires. From the HLs of Fe–Pd nanowire arrays with different compositions, it can be appreciated that for most compositions the saturation field measured along the perpendicular direction is smaller than that corresponding to the parallel direction, indicating that the perpendicular direction is an easy magnetization axis and the magnetostatic interactions among nanowires along the parallel direction are very strong. However, the Fe52Pd48 sample does not exhibit a clear preferred magnetization easy axis. In addition, the Fe52Pd48 sample, which corresponds to a deposition current density of 15 mA cm− 2, shows the highest coercivity and reduced remanence values of the entire Fe–Pd alloys series in both parallel and perpendicular directions, whereas the Fe63Pd37 sample, which has been synthesized at 2 mA cm− 2, exhibits the lowest values of these magnitudes; all of this is summarized in Figure 2.30a. This could be related not only to the difference in the amount of Pd but also to the nanowire growth conditions, which might have a strong influence on the microstructure and stress distribution in the electrodeposited nanowires (Dunand and Müllner, 2011).

HLs of Co–Pd nanowires exhibit magnetic behavior similar to that of Fe–Pd nanowires. At low Pd contents, the easy magnetization axis tilts toward the perpendicular direction with respect to the nanowire axis, whereas in the Co59Pd41 and Co63Pd37 samples, the saturation fields tend to be closer to each other for both applied field directions. Figure 2.30b and c indicates that the parallel coercivity and reduced remanence values tend to increase with the Pd content in the alloy, reaching higher values than those obtained for the Fe–Pd nanowire arrays with similar Pd content.
2.2.3 Multilayered magnetic nanowires
Nanostructured materials as multilayers or core-shell structures have attracted much attention because of the capability to modify their physicochemical properties for applications in many fields, such as opto-electronics and magnetic materials (Yoon et al., 2010; Levy, 1994). The different contributions that can be dominant in the global behavior of the material concern the interface and collective contributions (Camley and Stamps, 1993). In some cases, the material’s behavior is driven by different structures; to the contrary, however, the different structures may interact with each other, showing completely different properties that are not necessarily a sum of the individual contributions. The development of heterogeneous, multisegmented, magnetic nanowires, comprising alternating single segments of soft and hard magnetic materials with well-controlled thicknesses and separated by nonmagnetic interspacers, has recently drawn the interest of the scientific community because of the interesting magnetization reversal processes that take place in these nanostructured materials and may allow for the design of multistable magnetic systems capable of storing several bits of information in a single nanowire (Allende et al., 2012). Therefore, the design and fabrication of multisegmented magnetic nanowire arrays with accurate control of the crystalline structure and magnetocrystalline anisotropy of each nanowire segment play a key role in the design of nanostructured magnetic materials with a required magnetic behavior for tailoring the magnetic and magnetotransport performance of nanostructured systems and devices (Rheem et al., 2007).
2.2.3.1 Co/Cu nanowires
Multilayered nanowires consisting of alternating magnetic and nonmagnetic layers have gained much scientific attention since the discovery of the GMR effect (Baibich et al., 1988) and the later demonstration of this effect in electrodeposited superlattices (Alper et al., 1993) and multilayered nanowires (Piraux et al., 1994), which have been synthesized by template-assisted electrodeposition in polycarbonate, polyester, and anodic alumina membranes (Schwarzacher et al., 1997; Evans et al., 2000; Nasirpouri et al., 2007). To achieve a multilayered structure, electrolytic baths containing high concentrations of ions of a magnetic metal (e.g., Co and Ni) and low ion concentrations of nonmagnetic materials (typically Cu) have been used. The low electrode potential of Cu allows selective Cu deposition at low potentials, while the diluted concentration of Cu ions in the electrolyte allows Cu contamination of the magnetic layer, deposited at high electrode potentials, to be kept at trace levels (< 1%; Fert and Piraux, 1999).
While conventional thin films show higher GMR values in the current-in-plane configuration, multilayered nanowires allow the study of GMR effects in the current perpendicular to the plane setup, as well (Heydon et al., 1997).
Co/Cu multilayered nanowires electrodeposited into polycarbonate membranes were first reported by Piraux et al. (1994). The magnetic and nonmagnetic layers of the nanowires, with a 40-nm diameter and a 10-nm thickness, are shown in Figure 2.31a; they have a remarkable magnetoresistance value of 15% at room temperature in the current-perpendicular-to-the-plane configuration (Figure 2.31b).

The influence of the thickness of the Cu interspacer layer on the magnetoresistance of Co (5 nm)/Cu multilayered nanowires with a 400-nm diameter was studied by Liu et al. (1995). Their results, shown in Figure 2.32, reveal a maximum GMR effect at both temperatures of 5 and 293°K for a Cu layer thickness of around 7 nm. However, this study was restricted to magnetic and nonmagnetic layers that are thinner than the spin diffusion lengths. Piraux et al. (1996, 1998) studied the magnetoresistance of nanowires with a wider range of layer thicknesses, from a few nanometers up to 1000 nm, and successfully explained their results based on the model described by Valet and Fert (1993).

The magnetic behavior and reversal mechanism of multilayered Co (5 nm)/Cu nanowire arrays of 40 nm in diameter as a function of the Cu layer thickness were described by Tan and Stadler (2006). Their work revealed a decrease in the coercivity measured along both the parallel and perpendicular directions of the nanowire axis with increasing Cu interspacer thickness. Nanowires with thin Cu layers (~ 0.5 nm) showed an easy magnetization axis along the wire’s length, whereas for thicker Cu layers a clear easy magnetization axis was not observed. The magnetization reversal took place by coherent rotation for magnetic measurements performed at 90° with respect to the nanowire axis in nanowires with thin Cu segments (0.5 nm) and rotation followed by flipping in nanowires with thicker Cu interspacers (5 nm). Measurements performed at 0° with respect to the wire’s axis indicate a flipping behavior for the Co/Cu nanowires with thick and thin Cu segments, whereas an intermediate Cu thickness (1.5 nm) led to a competition between flipping and rotation, which was ascribed to the strong exchange coupling between Co layers.
Because of the outstanding GMR effects displayed by Co/Cu multilayered nanowire arrays, they have more recently been explored as good candidates for exhibiting magnetothermoelectric and high thermopower effects (Hu et al., 2014).
2.2.3.2 Co–Ni multisegmented nanowires
Co–Ni alloys constitute an outstanding candidate for the development of multisegmented nanowires because of their anomalous electroplating behavior, which results in a preferential deposition of Co atoms with respect to the Ni atoms at low deposition potentials (Tian et al., 2011; Gómez et al., 1998, 2005; Ghahremaninezhad and Dolati, 2009). This allows for compositional control of the electrodeposited Co–Ni alloys from a single electrochemical bath by varying the electroplating potential (Vega et al., 2012a,b,c; Prida et al., 2013; García et al., 2014).
The linear dependence of Co–Ni nanowires’ composition and growth rate on the cathodic electrodeposition voltage is illustrated in Figure 2.33a for a Watts-type electrolyte containing 0.36 M CoSO4 + 0.04 M CoCl2 + 0.76 M NiSO4 + 0.13 M NiCl2 + 0.073 M H3BO3 with a pH of 4-4.2 at 35 °C. By pulsing the electrodeposition potential as schematized in Figure 2.33b, multisegmented Co54Ni46/Co85Ni15 nanowire arrays were grown into SiO2 coated, hard anodized nanoporous alumina templates (Prida et al., 2013; García et al., 2014). Furthermore, by carefully adjusting the duration of each pulse, the length of the different segments was also tuned.

HR-TEM characterization of isolated nanowires after being released from the alumina template revealed a sequence of segments with alternating Co–Ni alloy composition, which was confirmed by the EDX spectroscopy line scan, as shown in Figure 2.34a–c. Furthermore, the Co and Ni contents are constant within each segment. The mean length of the Co54Ni46 alloy segments estimated from these images was 290 ± 30 nm, and the mean length of the segments with Co85Ni15 alloy composition was 422 ± 50 nm. On the other hand, the diameter modulation of each Co–Ni segment could be an indication of a slight chemical etching on the surface of Co-rich segments during the process of releasing the nanowires from the NAM template. However, such etching or oxidation was not observed in the segments richer in Ni, as a result of the different corrosion resistance behaviors of Co85Ni15 and Co54Ni46 alloys (Srivastava et al., 2006).

Local examination of the microstructure and composition of the different nanowire segments shown in Figure 2.35 reveals that their crystalline structure changes as the Co-to-Ni ratio is modified. In particular, nanowire segments with high Co content display SAD patterns that correspond to HCP single crystals observed through the [001] plane, which means that the c-axis of the HCP phase grows perpendicular to the nanowires. On the other hand, nanowire segments with almost equiatomic composition exhibit SAD patterns corresponding to a Co–Ni alloy single crystal with an FCC structure, where the [111] direction lies along the nanowire axis. The appearance of the HCP structure in Co–Ni alloys with high Co content is in agreement with its equilibrium phase diagram (Hansen, 1958). It is worth noting, however, that in some of the nanowire segments studied, the HCP phase also appeared in Co54Ni46 segments, probably as a consequence of the nonequilibrium nature of the electrodeposition processes.

The aforementioned structural characterization indicates that the crystalline structure of Co–Ni alloys is strongly dependent on its composition. Magnetic HLs of multisegmented Co85Ni15/Co54Ni46 alloy nanowire arrays measured along the parallel and perpendicular directions with respect to the nanowire’s long axis are shown in Figure 2.36. The HLs corresponding to homogeneous Co85Ni15 and Co54Ni46 nanowires of similar length and diameter are shown for comparison. The whole set of samples display low coercivity and reduced remanence values, and none of the samples show a clear easy magnetization axis lying along the measurement directions. This fact suggests a strong competition between shape and magnetocrystalline anisotropies; this is evidenced more in the case of nanowires with a major HCP phase (Vivas et al., 2012c). In the multisegmented Co–Ni alloy nanowire array composed of alternating segments with two different Co–Ni alloy compositions, its overall magnetic behavior is strongly influenced by the magnetocrystalline anisotropy of each segment’s composition because of their different crystalline structures. In the case of magnetic measurements performed along the parallel direction, the multisegmented system mainly follows the behavior exhibited by the Co54Ni46 nanowire array, where the major cubic phase implies a reduction of magnetocrystalline anisotropy and therefore a switching process dominated by shape anisotropy. On the other hand, the perpendicular HL of the multisegmented nanowires displays basically the same magnetic features as those exhibited by the Co-rich nanowire arrays, where the contribution of the major HCP phase to the magnetocrystalline anisotropy plays an important role in the magnetization reversal process. Taking this into account, the resulting magnetic behavior of the multisegmented nanowires seems not to be just a superposition of the contributions corresponding to the different segment compositions, but rather a predominant magnetization reversal process driven by the Co54Ni46 and the Co85Ni15 phases along the parallel and perpendicular directions, respectively.
2.2.3.3 Co–Ni/Cu multilayer nanowires
Electrodeposited Co–Ni/Cu multilayered nanowires are of particular interest because of their large GMR effect, ease of preparation, and accurate control of layer thickness (Schwarzacher et al., 1997; Evans et al., 2000). Evans et al. (2000) synthesized Co–Ni/Cu nanowires with a diameter of ~ 300 nm and up to 60 μm in length using pulsed electrodeposition into nanoporous alumina templates. The Co–Ni layers, which contain some Cu contamination, have a nominal thickness of 5.4 nm, whereas the nonmagnetic Cu interspacers are around 2.1 nm in thickness. The current-perpendicular-to-plane GMR illustrated in Figure 2.37a were measured under maximum applied fields of ± 0.8 T and indicated a remarkable GMR value of 55% at room temperature, which increases up to 115% at 77 °K (Evans et al., 2000). Further GMR measurements in Co–Ni/Cu multilayered nanowires were reported by Tang et al. (2007a,b); the nanowires had a mean diameter of 250 nm and variable thickness: the magnetic Co–Ni layer was 2–170 nm thick and the Cu interspacer was 4.2-42 nm thick. A maximum current-perpendicular-to-the-plane GMR effect of 23% at room temperature was obtained for a Co–Ni layer and Cu interspacer that were 10.2 and 4.2 nm thick, respectively (Tang et al., 2007a,b). Meanwhile, the magnetic behavior of the multilayered Co–Ni/Cu nanowires with a Cu interspacer thickness of 4.2 nm indicated a ferromagnetic behavior at room temperature for Co–Ni layer thicknesses as small as 6.8 nm and relatively large coercivity values (~ 300 Oe). For magnetic layers with thicknesses < 6.8 nm, the nanowires displayed a superparamagnetic behavior associated with discontinuities in the electrodeposited magnetic layers, which became evident from the decrease in coercivity (Tang et al., 2006), as shown in Figure 2.37b.

The magnetization reversal process of Co–Ni/Cu nanowires with a Cu segment 4.2 nm thick was studied as a function of the Co–Ni segment length, based on room-temperature HLs measured at angles between 0° and 90° with respect to the longitudinal axis of the nanowires (Tang et al., 2006, 2007b). The magnetization reversal of multilayered nanowires with nanometric Co–Ni layers takes place by coherent rotation, and the nanowires display an easy magnetization axis along the direction perpendicular to their long axis. On the other hand, Co–Ni layers with thicknesses in the micrometer scale display an easy magnetization axis along they longitudinal direction and reverse their magnetization by curling if the magnetic field is applied at angles < 45° with respect to the easy axis, whereas they follow a coherent rotation mode if this angle is larger than 45° (Tang et al., 2006, 2007b).
Single, isolated, Co–Ni/Cu multilayered nanowires were recently prepared by electrodeposition in NAM templates to study and characterize the effects of the interplay between GMR and anisotropic magnetoresistance on the magnetothermoelectric and thermopower phenomena exhibited by these kind of nanoscale systems (Böhnert, 2014).
2.2.3.4 Co/Pt multilayer nanowires
Together with the high magnetic anisotropy of Co–Pt alloys, the feasibility in fabricating magnetic/non magnetic Co/Pt or Co–Pt/Pt multilayered nanowires makes also increasing the potential application of these kind of samples for GMR effect based devices. Because of the different standard electrode potential of Pt and Co, it is possible to grow multilayered nanowires by means of pulsed electrodeposition at two different deposition potentials. In the case of pure Pt electrodeposited nanowires, the FCC crystalline structure typical of bulk Pt is found. However, the magnetic layer depends on the concentration of Pt in such way that it transits from HCP for pure Co or Co-rich segments to FCC for concentrations of Pt higher than 50 at% (Peng et al., 2007, and references therein).
The magnetic properties of these multilayered nanowires greatly depend on the aspect ratio of the magnetic segment and on the thickness of the nonmagnetic layer. In principle, the reduction of the aspect ratio results in a reduction of the shape anisotropy in the magnetic segment, which tends to tilt the easy magnetization axis out of the parallel direction with respect to the nanowire axis (Su et al., 2004; Choi et al., 2005).
The fabrication of multilayered Co/Pt nanowires has been considered as an additional route when growing Co–Pt alloy nanowires. In this case, after the electrodeposition of the multilayered nanowires, they are submitted to thermal treatments where an interdiffusion between the magnetic and nonmagnetic layer takes place. In addition, crystallization in a c-axis compressed FCT Co–Pt structure is also favored by thermal treatments above 600 °C. The homogeneous L10 Co–Pt nanowires achieves a magnetic hardening with the easy magnetization axis parallel to the nanowires and with coercive fields up to 14 kOe, depending on the geometry of the nanowires, as well as the temperature and duration of the thermal treatment (Choi et al., 2005; Liu et al., 2009).
2.3 Conclusions and future perspectives
Metallic and magnetic cylindrical nanowire arrays based on single transition metal elements and their alloys can be synthesized through a straightforward and low-cost template-assisted electrochemical deposition technique by using highly hexagonally self-ordered NAMs as patterned templates. The synthesis, microstructure, and morphology, together with the magnetic properties of metallic nanowires based on a wide compositional range transition metals and their alloys, with different diameters and lengths, as well as the fabrication of multisegmented nanowires with varying chemical composition between each segment and dimensions, are studied and discussed within this chapter. Depending on the nanowire’s composition and size (namely, its diameter and length), the nanowire arrays can have different magnetic behaviors, where their magnetization processes are mainly governed by the competition between the shape and magnetocrystalline anisotropies existing in each case. Furthermore, in densely packed arrays of ferromagnetic nanowires, magnetostatic interactions among adjacent nanowires also play a determinant role in the collective magnetic behavior of the nanowires within the array. The accurate control of all parameters involved during the synthesis conditions (electrolyte composition, temperature, pH, electrodeposition potential, and so on), including the template, allows for the more appropriate characteristics and properties to be tuned to tailor desired structural, morphological, and magnetic features of the material to achieve its implementation in technological applications. From this starting point, it can be clearly stated that properly combining several of the fabrication techniques highlighted here (electrodeposition, ALD, NAM templates, among others) opens the door for the synthesis of more complex nanostructured materials in the future, such as modulated magnetic nanowires varying composition and diameter at the same time, nanowires with core-shell structures, and nanowires with a magnetic nucleus surrounded by a semiconducting cover, among others. This undoubtedly would bring to the scientific community an opportunity for the fabrication of novel nanostructured materials and composites with outstanding properties for their technological applications.
2.4 Acknowledgements
Funding from Spanish MINECO grants under projects MAT2010-20798-C05-01 and -04, MAT2013-48054-C2-1-R and -2-R, and MAT2013-47231-C2-1-P is gratefully acknowledged. Dr. J. García thanks FICyT for a “Severo Ochoa” fellowship. Scientific support from Laboratorio de Membranas Nanoporosas of the Nanotechnology Unit at Universidad de Oviedo is recognized.