
Controlled single-domain wall motion in cylindrical magnetic microwires with axial anisotropy
M. Vázquez; A. Jiménez; R. Pérez del Real Instituto de Ciencia de Materiales de Madrid, Madrid, Spain
Abstract
Amorphous microwires with high positive magnetostriction show strong uniaxial magnetic anisotropy arising from enhanced magnetoelastic and geometrically intrinsic shape anisotropies. Their magnetization reversal under a homogeneous magnetic field proceeds by the depinning and propagation of a single domain wall, resulting in bistable square-shaped hysteresis loops. In a first section, this chapter deals with the spontaneous formation of the closure domain structure at the ends of the microwire from which that single domain wall depins. In a second section, the motion of such a standard domain wall, DWst, under a homogeneous drive field, Hdr, is perturbed by the action of a local field, Hloc, which allows us to break and trap DWst. Next, we focus on the long-distance propagation of a single domain wall, and we define other wall modes as reverse DWrev stabilized at the end of the homogeneous field region, or DWdef created around local defects of the amorphous microwire. We observe the motion of different mode walls, which eventually annihilate. The next section is devoted to the motion of pairs of walls, DWinj, injected by a strong enough local field, Hloc, which propagate under a low drive field, Hdr. Alternating motion of DWinj is achieved by suitable selection of amplitude and frequency of in-phase Hdr and Hloc fields. The shape of the propagating wall after the induced signals at the pickup coils is also discussed. New perspectives are advanced regarding the controlled motion of trains of injected walls, which opens new fields of application for advanced recording and logic devices technologies.
Acknowledgement
This study has been supported by the Spanish Ministry of Economy and Competitiveness under project MAT2010-20798-C05-01.
12.1 Magnetization reversal and single domain wall in cylindrical magnetostrictive microwires
12.1.1 Relevance of domain walls: Nucleation and depinning of a single domain wall
The magnetism of spins at the transition regions between magnetically ordered regions or domains has attracted the interest of magneticians for many years. Domain walls are essential in most magnetization processes. After magnetic saturation, domain walls nucleate and move under reversed field. Although in most magnetic systems magnetization reversal takes place with a large number of domain walls, processes involving a single domain wall naturally attract much attention. In this regard, the particular geometry of wires offers specific advantages to study domain walls and their motion along a preferred direction. Apart from micromagnetic studies, the dynamics of domain walls present quite interesting technological opportunities in advanced nanoscaled information storage or logic magnetic systems. In fact, the velocity of the domain wall can determine the working speed and capabilities of those devices.
Domain walls are currently mostly studied in lithography nanostripes out of soft materials (i.e., Permalloy), where the shape anisotropy determines the spin distribution and its reversal process. The cylindrical geometry of nanowires introduces complexities in the domain walls, and specific singularities appear around the axis as, for example, the presence of a Bloch-point domain wall. Recently, studies on nano and submicrometric cylindrical wires have been reported (Chiriac et al., 2011). Micrometric magnetic wires offer alternative applications in a large number of micrometric magnetic sensor devices where the control of the magnetization reversal process and particularly of the domain walls’ motion is essential for the development of novel families of sensors (Vázquez, 2007; Zhukov et al., 2009; Vazquez et al., 2011). In the case of magnetostrictive amorphous microwires, magnetization reversal takes place by depinning and propagation of a single domain wall.
The magnetization process of amorphous magnetic microwires has been extensively investigated in past decades in view of its interesting fundamental and applied possibilities. Both aspects derive from the microwires’ outstanding magnetic behavior, which apart from the cylindrical shape depends on their magnetostrictive character as a consequence of the lack of magnetocrystalline anisotropy. Those microwires with vanishing magnetostriction (i.e., CoFe-based alloys with a relative percentage of magnetic elements of around 95/5) exhibit very high initial permeability, which results in the giant magnetoimpedance effect whereby strong changes in impedance are observed under a low dc magnetic field. This phenomenon is nowadays employed in a number of sensing devices (i.e., field, stress, temperature), where magnetoimpedance microwires are used as sensing elements. In turn, highly magnetostrictive microwires (i.e., Fe-based alloys) exhibit a unique magnetization reversal process involving the nucleation, depinning, and propagation of a single-domain wall. For general information about this family of microwires, the reader is referred to other chapters in the book, as well as to review articles (Vázquez, 2007; Zhukov et al., 2009; Vazquez et al., 2011).
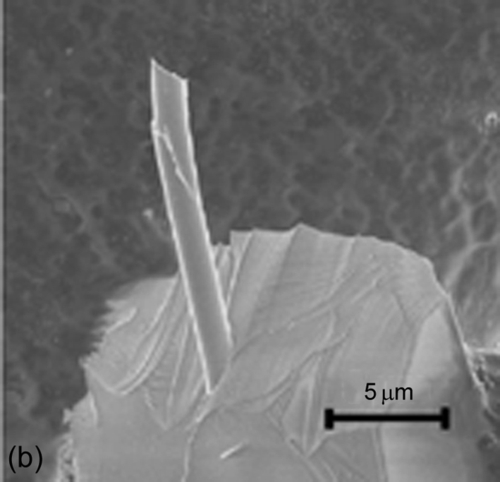
In this chapter, we will consider the formation of the domain wall and its propagation under the action of a homogenous field and a local field. Through the tuned action of these fields, we are able to control the wall motion. This investigation is performed in magnetostrictive glass-coated amorphous microwires (see Figure 12.1), where the strong uniaxial magnetic anisotropy determines a bistable magnetic behavior between two stable axially magnetized states.

The distribution of magnetization into magnetic domains and the dynamics of the magnetization process are determined by the energy balance of all involved magnetic anisotropy terms. The case of Pyrex-coated amorphous magnetic wires is very particular in the sense that only two energy terms are relevant because their amorphous nature implies the lack of crystalline energy:
(i) The magnetoelastic anisotropy plays a very relevant role, particularly in the case of magnetostrictive alloys as the Fe-based metallic glasses. It arises from the coupling between strong mechanical stresses frozen during the samples preparation and the magnetostriction constant. A complex mechanical stresses distribution is obtained during the rapid solidification process of fabrication, namely, (a) thermal stresses from quenching, (b) drawing stresses, and (c) stresses from the different thermal expansion coefficients of metal core and Pyrex shell. Tensile axial stress dominates in a central core and compressive radial and shear stress dominate at an external shell.
(ii) The shape anisotropy, which is determined by the cylindrical geometry of the wires. The large aspect ratio length to diameter gives rise to a significant uniaxial anisotropy with the longitudinal magnetization easy axis.
In addition, local fluctuations of magnetic anisotropy originate in the intrinsic compositional inhomogeneities ascribed to the amorphous structure and from geometry imperfections produced during the fabrication process. Several review articles have been published around the general distribution of magnetic anisotropies in amorphous microwires (Vázquez, 2007; Zhukov et al., 2009).
In Fe-based wires with high positive magnetostriction, the magnetoelastic anisotropy reinforces the shape anisotropy leading to a quite large single domain core axially magnetized. However, a different stress distribution and the magnetostatic energy reduction lead to the apparition of closure domains at the ends of the wire as sketched in Figure 12.2. Therefore, under homogeneous axial field, the magnetization reversal process between two stable magnetic configurations occurs by depinning of a single domain wall (DW) from the closure structure at one end of the wire. That gives rise to a square-shaped hysteresis loop as observed in Figure 12.2, defined by a single giant Barkhausen jump.

Along the different sections of the chapter, several experiments are described performed on various FeSiB amorphous microwires fabricated by quenching and drawing technique at the ICMM/CSIC cast unit. With these experiments, we aim to demonstrate the possibility to control the injection and motion of domain walls.
12.1.2 The magnetization reversal process in bistable microwires: Geometrical features
The magnetization process, as well as its particular parameters for the reversal process (i.e., coercivity) of cylindrical wires, depends on the specific geometry of the wires through the corresponding variations of demagnetizing field or shape anisotropy. First magnetic measurements have been taken in a vibrating sample magnetometer, VSM, on samples with different length and diameter.
With respect to the dependence on the microwires length, Figure 12.3 shows the hysteresis loops of a FeSiB microwire with 12-μm diameter and total diameter of DT = 20 μm. Measurements correspond to a 9-mm-long microwire, and after subsequent cutting into pieces reducing the length down to 1 mm. We observe that for samples longer than 3 mm, the coercivity (or switching field of the axial domain wall) remains unchanged (around 110 A/m), denoting a similar process of formation of the DW. Only the fractional remanence decreases with the length that is explained by the increased fractional volume of the closure domains. At the remanence, we can consider that:

where Lc and LT are the length of closure domain and the microwire’s length, respectively. The closure structure reduces continuously its length from Lc = 0.66 to 0.43 mm as the length of the wire’s pieces is reduced from 9 to 3 mm. This indicates that the length of the closure domains does not change dramatically for this length interval. Besides that, we can conclude a reduced magnetostatic interaction through stray fields between the closure domains as the coercivity remains nearly the same.

In turn, below 3 mm length, the hysteresis loops show a completely different behavior where small Barkhausen jumps are still observed with reduced amplitude as the wire’s length is further reduced. This behavior points to the huge influence of the closure domains in the magnetization process of the sample and their big fractional size when compared to that of the whole wire. According to Eq. (12.1), the closure domains extends up to 450 and 480 μm from the end of 2- and 1-mm-long wires, very similar values to that obtained for the longer wires. The parallel change of the switching field would suggest either a different axial domain structure or the apparition of a large stray field in the whole sample that increases as the length decreases.
With respect to the influence of diameter, hysteresis loops were taken for 5-mm-long FeSiB microwires with metallic diameter dmet = 1.5 and 12 μm, and total diameter of around DT = 20 μm (Ye et al., 2013). The microwire with smaller (1.5 μm) diameter exhibits a magnetically harder behavior, with smaller fractional remanence, Mr/Ms, and a larger coercivity (Hc = 1500 A/m) than the 12-μm wire (Hc = 110 A/m). This is ascribed to the comparatively stronger mechanical stresses induced by the larger thickness of Pyrex coating (Zhukova et al., 2002).
An additional difference is found when comparing the magnetization around the remanence for both diameters. In the case of the wire 1.5 μm in diameter, the remanence, Mr, and magnetization just before switching, Msw, are roughly equal. In turn, in the case of 12-μm-diameter microwire, the remanence, Mr, and magnetization just before switching, Msw, take different values (Mr − Msw ≈ 0.16 Ms), suggesting an angular magnetization reorientation or an enlargement of the closure structure between remanence and switching. These differences suggest significant differences in the formation of the domain wall that produces the bistable magnetic behavior.
12.1.3 Local magnetization reversal process at the ends of microwires
The closure domain structures at the ends of the microwires play an essential role in the magnetization reversal. At that region, the spin distributes in a particular way to reduce the total stray field energy. The longitudinal magnetization profile at remanence was earlier investigated (Zhukov et al., 1995) making use of fluxmetric induction method and a movable tiny search pickup coil. More recently, a nice experiment was designed to determine the magnetic profile from the local detection of magnetic field using a superconducting quantum interference device microscope (Gudoshnikov et al., 2007).
Specific studies have also been performed making use of the magneto-optical Kerr effect (MOKE). This technique has been proven very useful when imaging magnetic domains (Chizhik et al., 2008, 2009) in magnetic microwires, whereas less attention has been paid to obtain complementary information on parameters of local hysteresis loops. The magnetic response in a local region as small as few micrometers (Ye et al., 2013) can be obtained using the optimized longitudinal magneto-optical Kerr effect (NanoMOKE 2 by Durham Magnetooptics Ltd.). We proceeded to study the longitudinal profile, with a minimum spatial step of 1 μm and a laser spot size of around 3 μm under a maximum applied magnetic field of 8 kA/m. Figure 12.4 shows the fractional remanence, Mr/Ms, and coercivity, Hc, for same series of microwires as in the previous section, with diameter 1.5 and 12 μm and different lengths (after successive cutting processes of the same pieces of microwires about 8 mm long).

In the case of microwires with dmet = 1.5 μm, we note that Mr/Ms and Hc are quite similar for all the lengths, but at around 20–30 μm distance from the very end (i.e., the closure domains), where Mr/Ms and Hc take smaller values than at the center of the sample. These values suggest a critical length of around 50 μm to observe magnetic bistability, that is, twice the length of closure domains. In the case of wires with dmet = 12 μm, the closure domains extend up to around 500 μm, which confirms the values calculated using Eq. (12.1), and allows us to estimate a critical length of around 1 mm to observe magnetic bistability in agreement with the estimated value from the VSM measurements. Here, Hc takes very high values if compared with the value at the center of the wire.
The profile of the coercive field and fractional remanence along the wire confirm the model by which a domain wall spontaneous nucleates from the closure domain region, and it subsequently propagates toward the opposite end. In particular, the local coercive field, Hcloc, depends on several factors like the local distribution of stresses and the local stray field, and it can be expressed as:

where a is the ratio between the metallic and the total diameter of the wire, L is the wire’s length and x the distance to the end. The second term of the right-hand side of Eq. (12.2) denotes the local demagnetizing field, Hd, which mainly depends on the local distribution of magnetic charges, σm, which cannot be directly related to the macroscopic demagnetizing field created by a saturated magnetic cylinder. The observed constant value of Hcloc at the center of the wires denotes a reduced demagnetizing influence of the local field at the ends. The first term of the right-hand side is related to the magnetoelastic anisotropy field contribution where α is a parameter determined by the wall shape and the thermal activation energy term, λ is the saturation magnetostriction, and Γσ denotes the stress that depends on a and x. For all wires, the profile of Γσ remains constant at the central region of the wire, where the stress becomes stronger for wires with smaller diameter and thicker Pyrex coating which is in the origin of the comparatively higher coercivity for thinner wires, as shown in Figure 12.4, and discussed elsewhere (Zhukova et al., 2002).
Close to the ends, a more complex behavior is observed with differences between thin and thick microwires. In thin wires (i.e., dmet = 1.5 μm), the local coercivity, Hcloc, is smaller than at the center, whereas in thicker wires (i.e., dmet = 12 μm), Hcloc takes larger values than at the center. That particular behavior is a consequence of the closure domain structures that appear to minimize locally the magnetic energy and that extend longer in thicker wires. They give rise locally to a complex distribution of magnetic charges, σm (local demagnetizing field) and mechanical stresses Γσ (local magnetoelastic anisotropy). Moreover, inverted hysteresis loops (i.e., with apparent negative remanence and coercivity, see Figure 12.4d) have been observed under particular demagnetizing field distribution (Ye et al., 2013).
A final outcome arises from the MOKE measurements, whose hysteresis loops actually correspond to the magnetization process at a very thin layer at the microwire’s surface (i.e., a penetration depth of around 30 nm is estimated from the laser frequency f = 4.74 × 10¹⁴ Hz). We should underline that MOKE coercivity (Figure 12.4) at the center of microwires takes very similar values as for VSM loops (Figure 12.3). It confirms that surface magnetization reverses at the same longitudinal applied field as the main axial domain, which suggests that the magnetization at the surface is either part of the axially magnetized big domain or that at least it contains a significant axial contribution. That would imply the modification of the commonly assumed model where the radial distribution of mechanical stresses give rise to a purely radial magnetized outer shell (Zhukov et al., 2009).
In summary, the magnetization reversal of microwires with axial anisotropy under homogeneous longitudinal field takes place by the depinning and propagation of a single domain wall from a complex closure domain structure close to the microwire’s end. The local distribution of magnetic charges and mechanical stresses are correlated with the microwire diameter and finally determine the extension of that closure structure and the actual value of the switching field. The propagating domain wall gives rise to a single giant Barkhausen jump and to square-shaped hysteresis loop in both the inner and the surface regions of the microwire. We should finally underline that at finite magnetic field, one wall is nucleated at each end of the wire ready to be depinned at its switching field. However, only one wall departs first, as the smallest local inhomogeneity is sufficient to promote depinning from a given end. This is particularly relevant when interested in the biased directional propagation of a wall. In the next sections, such a domain wall nucleated spontaneously close to the ends of the wires is labeled as standard domain wall, DWst.
12.2 Controlled propagation of single-domain walls under homogeneous and local fields
12.2.1 Controlled propagation of a standard single-domain wall through local field
In Section 12.1.3, we analyzed the magnetic profile along the microwire in connection with the nucleation and depinning of a single-domain wall close to the end under homogeneous longitudinal field. The dynamics of the propagation of that standard wall, DWst, has been earlier reported (Varga et al., 2005). In most studies, a long solenoid or system of Helmholtz coils provides the longitudinal driving field, Hdr, and the velocity of the propagating DWst is deduced from the time interval between induced voltage signals at secondary coils separated by a given distance. The motion of the wall is given by the general equation:

where m is an effective mass of the wall with section S, β the damping coefficient, k the restoring force constant, and 2μ0MsSHdr the driving force by the applied field Hdr. Once the wall reaches the stationary propagation at constant velocity, Eq. (12.3) reduces to v = 2μ0Ms/β (Hdr – H0), where v is the DWst velocity, 2μ0Ms/β denotes its mobility, and H0 represents the minimum applied field required for the DWst propagation (Varga et al., 2008). Such a linear behavior between wall velocity and applied field has been systematically studied as a function of a number of parameters as temperature, applied stress, or thermal treatments (Corodeanu et al., 2011; Zhukov et al., 2012). The intrinsic damping mechanism to the motion has been investigated elsewhere (Varga et al., 2005; Ovari et al., 2011), whereas other agents can interact with the propagating wall such as compositional impurities, local geometry defects or surface roughness.
Although the motion of a DWst has been thoroughly investigated in previous works, our objective in this section has been to demonstrate how the motion of that DWst can be experimentally controlled under the action of an additional magnetic field applied in a local position (Vázquez et al., 2012). We demonstrate that the wall motion can be slowed down and the wall even stopped depending on the amplitude and relative orientation of a homogeneous driving, Hdr, and the local, Hloc, fields.
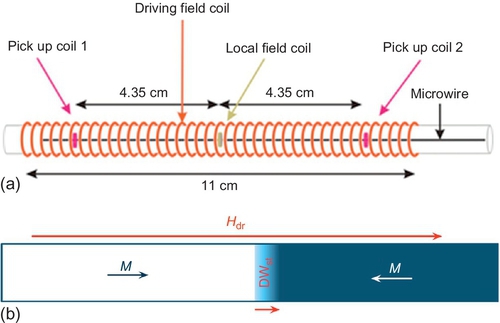
Figure 12.5a shows a schematic view of the simple, Sixtus & Tonks-like, experiment. It consists of an 11-cm-long solenoid, which creates a homogeneous driving magnetic field, Hdr, and a short, 4-mm-long, exciting coil generating a local longitudinal field, Hloc, favoring or opposing Hdr. This local coil is placed exactly at the middle of the solenoid and equidistant from two pickup coils. Both the drive and the local-field coils are in phase fed by AC square electrical current at 40-Hz frequency, low enough so that the rising of the field signal reaches its stationary value, and a constant field is assumed to act on the propagating walls. Note particularly the asymmetric positioning of the microwire in Figure 12.5a to provoke the depinning of the standard wall at the left end. Its subsequent rightward motion is confirmed by the sequence of sensed pulses in several pickup coils, as will be later discussed in detail.
Thus, in a first experiment, a standard wall, DWst, depins from the left end of the wire under a homogeneous drive field, Hdr, its speed being evaluated from the time interval between induced signals in the two sensing coils P1 and P2 (see Figure 12.6a). When a moderate field Hloc is applied in antiparallel field configuration (opposing Hdr), the wall, DWst, reaches the first sensing coil and then approaches the local coil but its motion is slowed down as observed in Figure 12.7. Under a sufficiently strong local field, Hloc = Hloc,trap the wall bounces and is trapped somewhere before reaching the local field coil, just at the position where the local field balances the drive field, that is, when Hdr + Hloc = 0. In the particular experiment shown in Figure 12.6, the equilibrium position of the DWst, propagating under constant Hdr = 170 A/m, is calculated to be at 4.27 mm to the left of the local coil. The trapping of the wall is directly evidenced by the fact that only one peak is recorded at the left sensing coil, denoting that DWst does not reach the pickup coil to the right (see Figure 12.6b).


 red) and calculated (◊ blue) data of DWst speed are included. (b) The calculated DWst velocity, v, as a function of the position between pickup coils for a local field slightly below the critical field to trap the DWst (Hloc ≤ Hloc,trap) (after Vázquez et al., 2012).
The process of the wall trapping can be followed considered the motion equation, Eq. (12.3), where now the applied field is composed by two terms, the homogeneous field, Hdr, constant along the length of the wire, and the local field, Hloc, produced by a tiny coil with N turns, length l, and radius a given by:

Assuming a restoring force as the average of the constant resistance to the wall motion due to the intrinsic defects, Eq. (12.3) can be written as:

The Runge–Kutta method was employed to solve this differential equation. In the particular experiment (Hdr = 170 A/m), we obtained a damping parameter β = 3.69 × 10⁻¹⁰ kg/s and a wall inertial mass m = 3.257 × 10⁻¹⁵ kg. The calculated values of the wall velocity are also given in Figure 12.7 as a function of the local field amplitude Hloc that show a good agreement with experimental results.
Calculations also permit the determination of the profile of the standard wall velocity as it approaches the local field coil. As observed in Figure 12.7b, for an applied local field slightly smaller than the required for trapping (Hloc ≤ Hloc,trap) the DWst velocity is constant until it closely approaches the local field coil, a position where speed decreases dramatically, getting a value close to zero. After the position of the local field coil is overcome, the velocity recovers its value. That reflects in a total reduction of DWst as experimentally measured (see Figure 12.7a), which corresponds to the average value between both pickup coils. We should underline that the trapping local field can be tuned by modifying the inertial mass or/and the damping coefficient through the application of mechanical stress or after thermal annealing.
From the results in this section, we have demonstrated how the motion of a single-domain wall can be tuned under the controlled action of homogeneous and local fields, particularly, it is slowed down and finally stopped. Further experiments can be performed and, particularly when the local field is strong enough, a reverse domain is nucleated at the position of the local coil with magnetization parallel or antiparallel to the driving field. That generates the injection of a pair of domain walls that will try to move into opposite directions. DW injection can be also achieved by profiting that magnetic moments distribute around local defects that transform into local reverse domains under the action of suitable magnetic fields. This will be considered in more detail in the following section.
12.2.2 Single-domain wall modes and its propagation under homogeneous field
We have determined the process of nucleation and propagation of a standard domain wall and its controlled motion through a local magnetic field. We have to consider some experimental limitations introduced by the relatively short length of investigated microwires, typically of around 10–15 cm, as reported in previous studies by other authors and by ourselves. Such length is not so large if compared with the “macroscopic” length of the domain wall during its propagation. Previous estimates indicate such length to be of few millimeters, which is considered in more detail in a later section. In addition, it is acknowledged that glass-coated microwires show in many cases inhomogeneities in their “quality”; that is, geometry or compositional “defects” are known to affect the homogeneity in the magnetic properties of the wires and particularly the domain wall dynamics (Ipatov et al., 2009). As a consequence, new domain walls can nucleate at local defects generating interferences with so-labeled standard domain walls.
One objective in this section has been to point out the relevance of the effects resulting from the length and quality of the microwires. Thus, we are now dealing with longer pieces of microwires of 30–50 cm, which implies modifications in the experimental setup, particularly the solenoid generating the homogeneous field. Longer pieces of microwires will enable the location of several pickup coils for better detection of the presence of the propagating walls, their overall optimized dynamic characteristics, and the identification of eventual additional domain walls. In turn, it requires longer pieces of microwires with excellent quality in terms of no geometrical or compositional defects that pin the wall motion or being in the origin for the uncontrolled injection/nucleation of additional domain walls.
Figure 12.8 shows the schematic view of a multipickup coil system. We should underline again the asymmetric location of the microwire with one end inside the region of homogeneous field, whereas the other end is outside to ensure that magnetization reversal starts at the left end of the wire. In this experiment (Jiménez et al., 2013), the 30-cm-long solenoid provides a homogeneous longitudinal drive field, Hdr, fed with AC square wave 51 Hz in frequency. Four pickup coils, P1–P4, 2000 turns each and 3 mm wide, detect the crossing of the wall. The magnetostrictive Fe-rich alloy composition (FeSiBC) of the microwire in this experiment ensures the magnetic bistability. Pieces of 40-cm-long wires were taken for these measurements, with metallic and total diameters of dmet = 20.5 μm and Dtot = 30.5 μm, respectively.

Figure 12.9a–d shows the sequences of peaks generated in the pickup coils as the standard domain wall crosses them for a series of fields, Hdr, applied rightward (negative peaks) and leftward (positive peaks). For relatively small amplitude, Hdr = 373 A/m, rightward and leftward drive field (Figure 12.9a), the same sequences of peaks P1–P2–P3–P4 (or yellow–blue–pink–green in the color code) are observed and confirm that in both cases a standard wall, DWst, propagates rightward.

When the field amplitude is increased until Hdr = 411 A/m (Figure 12.9b), the time interval between peaks for the rightward field decreases, indicating an increase in the wall velocity. In addition, for leftward field, the peak in P4 is detected before the peak in P3, which denotes the presence of an additional wall, labeled DWrev, propagating in the opposite direction. The amplitude of the drive field is tuned to Hdr = 429 A/m in Figure 12.9c. There, induced signals in P2 (blue) and P4 (green) are picked up simultaneously (note its enhanced signal amplitude and reduced width): It indicates the collapse or annihilation of two walls, DWst and DWrev, moving along in opposite directions.
Figure 12.9e–h shows the schematic views of magnetic domains and moving domain walls under different applied fields for the interpretation of the peaks sequences in Figure 12.9a–d. Figure 12.9e corresponds to the propagation of a standard head-to-head domain wall, DWst1, moving from the left end crossing the pickup coils in the order 1, 2, 3, and 4, as corresponds to the sequence of negative and positive peaks in Figure 12.9a. This wall stops at the region to the right of the solenoid where the field loses its homogeneity. At the remanence state (Figure 12.9f) or if the reverse magnetic field amplitude is not high enough, this wall remains there, and therefore it does not have any influence in the subsequent sequence of peaks under the leftward applied field (Figure 12.9a).
Under leftward applied field a new standard, now tail-to-tail, domain wall, DWst2, would propagate (see Figure 12.9g). However, if the field is strong enough, it will generate the leftward motion of the domain wall DWst1, renamed as reverse domain wall, DWrev, because it is moving in the leftward direction. Under a very precise tuning of the driving field (in our case, leftward Hdr = − 29 A/m) both domain walls, head-to-head DWst2 and tail-to-tail DWrev, reach simultaneously and annihilate at the pickup coil P3 (corresponding to Figure 12.9c). Note that after this annihilation, the domain structure remains the same as initially.
For even higher field amplitude (i.e., for leftward Hdr = + 485 A/m in Figure 12.9d), a different behavior is observed. The induced signal in P4 (green) appears intermittently and earlier than that in P3 (pink). Such intermittency is typical of domain walls, labeled as DWdef, that are inadvertently injected close to nonhomogeneous field region seemingly containing a local “defect” (Jiménez et al., 2013; Zhukova et al., 2012; Zhukov et al., 2013), as depicted in Figure 12.9h. It is worth remarking that these defects play a similar role as notches do in nanostripes prepared by lithographic techniques (Parkin et al., 2008; Bogart et al., 2009).
In summary, we can thus define three sorts of domain walls, namely, (i) standard wall DWst that spontaneously depins from the end of microwire under the smaller homogeneous field, Hdr, (ii) reverse wall DWrev that gets confined at the end of the homogeneous-field region and moves under larger homogenous field, Hdr, and (iii) defect wall DWdef that depins from a local defect under the larger Hdr. An additional kind of wall, or injected DW, will be introduced in the next section, DWinj, appearing on injection of reverse domain by local field.
12.2.3 Controlled motion of single injected domain walls under homogeneous and local fields
The generation and motion of various sorts of domain walls under homogeneous driving field have been shown in the previous sections as well as the possibility to break and trap a single-domain wall under the additional application of a local field. In this section, we consider the local field as a source to nucleate reverse domain and to inject pairs of domain walls. We combine the supplementary action of homogeneous and local fields with an aim to control the motion of domain walls. We experimentally demonstrate the alternating controlled motion of injected domain walls, DWinj. It is necessary to remark, particularly for the outcome in this section, that it is crucial to count on microwires with the highest quality so that we can discard the injection of domain walls around structural or geometrical defects at least under the highest applied field.
In this experiment, the experimental setup is similar to that in the previous section, but it is implemented with an additional tiny coil creating the local field Hloc at the middle of the homogeneous field region (the scheme can be observed in Figure 12.10) (Jiménez and Vázquez, 2014). This local coil creates a magnetic field with a spatial distribution following Eq. (12.4) to nucleate a reverse domain so injecting a pair of domain walls when its amplitude is high enough. The driving field, Hdr, is generated by a 40-cm-long solenoid, and the local field Hloc is created by a tiny coil placed in the middle of the solenoid. Again, the microwire is asymmetrically positioned in the system in such a way that its left end is inside the long solenoid, and the other end is out. The solenoid and the local coil are fed with ac square-shaped in-phase signal that ensures constant field Hdr during DW propagation and whose relative amplitudes and frequencies can be tuned. In this experiment, the role of Hdr is to favor the propagation of domain walls, whereas Hloc is employed to nucleate a local reverse domain bordered by a pair of tail-to-tail and head-to-head injected DWinj. The amorphous microwire employed in this experiment is 50 cm long, with a metallic core of diameter dmet = 19.3 μm covered by a Pyrex coating 3.5 μm thick. The high positive magnetostriction, 3 × 10⁻⁵ of its alloy composition, Fe72.5B15Si12.5 ensures its bistable magnetic behavior.

Two pairs of pickup coils, P1–P2 and P3–P4 are symmetrically placed with regard to the central local field coil as depicted in Figure 12.10. The distances, d, between coils centers are: dP1–P2 = dP3–P4 = dP2–P3/2 = 51.0 mm, which are connected to individual channels of an oscilloscope. Under the only action of Hdr, a standard domain wall, DWst (head-to-head or tail-to-tail), depins from the wire’s left end, close to pickup coil P1, and propagates rightward inducing respective signals on crossing each pickup coil (see the sequence of peaks in Figure 12.11a). When the local magnetic field is large enough to nucleate a reverse domain, it also injects two domain walls, DWinj, which propagating along opposite directions give rise to the time sequence shown in Figure 12.11b. The different shape of the pickup signals of each amplitude of Hdr has been discussed elsewhere (Zhukov et al., 2013; Jiménez and Vázquez, 2014).

After the preliminary characterization, we consider different combinations of field amplitudes to guarantee that we are only dealing with injected walls, DWinj. It requires the nucleation of a reverse domain at the wire’s center under strong enough Hloc, and the subsequent propagation of DWinj under Hdr. It is worth mentioning that such driving field is small enough to avoid the depinning of any standard DWst from the wire’s end. Then, we select the controlled motion of injected walls by modifying the relative frequencies of fields.
The first combination of applied fields is depicted in Figure 12.12a (Hdr = 29 A/m, 100 Hz, and Hloc = 234 A/m, 50 Hz) where Hloc is high enough to inject two DWinj. We identify four different “events” that correspond to the number of half wave lengths of the field with highest frequency. The sequence of induced signals is given in Figure 12.13a–b, and the interpretation of the DWinj motion in each event is indicated in the caption as deduced from the color code of signal induced at each pickup coil.


Figure 12.13c shows a schematic interpretation of the domain walls, DWinj, along the different events. In the event I, both fields are applied in the same direction, and the total field at the wire’s center (Hinj = 263 A/m > Hnucl) is strong enough to inject a pair of walls, DWinj, that propagate under the drive field in opposite directions. They reach nearly simultaneously pickup coils P2 and P3, and later P4 and P1, and finally one of them annihilates at the left end, whereas the other one is brake to a complete stop at the right region outside the solenoid.
In event II, Hdr is reversed. The DWinj outside the solenoid (becoming DWrev) moves leftward until it approaches the local field coil, where it is trapped as explained in Section 12.2a. This is the reason why we only detect signals from P3 and P4. In event III, both magnetic fields reverse direction. This cancels the braking effect of Hloc so DWinj overcomes the local coil position. However, the reversal of Hdr prevents its further leftward motion. Finally, in event IV, Hdr reverses again so that, DWinj is allowed to move leftward until reaching the left end and annihilates: The initial magnetic state is recovered.
In a second exciting field configuration, the frequencies of the magnetic fields were exchanged, Hdr = 29 A/m (50 Hz) and Hloc = 234 A/m (100 Hz) as depicted in Figure 12.12b. The new sequence of induced signals in the pickup coils is given in Figure 12.14a, whereas Figure 12.14b shows a schematic interpretation of the motion of the DWinj in the different events but for event I.

In this magnetic fields configuration, event I is the same as in the previous configuration, and a pair of walls, DWinj, propagates in opposite directions. In event II, Hloc reverses but it does not affect the motion of the domain walls. In event III, both fields reverse, and we have the situation similar to event II of the previous configuration, that is, the DWinj moves back, crosses P4 and P3, and is stopped by the local field, Hloc. In event IV, Hloc reverses and allows the DWinj to propagate leftward until reaching the initial magnetic state.
Subsequent events give rise in both field configurations shown in Figure 12.12 to the alternating motion of injected domain wall between the same remanence magnetic state. That has been experimentally confirmed also in configurations characterized by different amplitude and frequencies for both applied fields.
12.3 Final remarks, conclusion, and perspectives
12.3.1 A remark: On the shape of the domain walls
We should remark that there are still several open questions around the single-domain wall, particularly its geometrical features (Jiménez et al., 2013). In the case of nanostripes with “ribbon” like geometry (i.e., 20–40 nm thick and 200–400 nm wide), two main kinds of domain walls have been thoroughly investigated. In Permalloy nanostripes, where the shape anisotropy overcomes other energy terms, transverse and vortex domain walls with hundreds of nanometer in width have been thoroughly investigated (Kläui et al., 2005; Hayashi et al., 2006). Much less attention has been paid to nanowires with cylindrical geometry. Only recently, the magnetization reversal of nanowires, tens of nanometers in diameter, out of Permalloy but also in Co-base nanowires has been investigated where magnetocrystalline anisotropy can play a relevant role (Ivanov et al., 2013). There, under given circumstances, a long Bloch-point like wall has been introduced in addition to a diameter in the range of units or tens of nanometer (Hertel and Kirschner, 2004; Da Col et al., 2014).
In our present case, we are dealing with microwires with strong magnetoelastic anisotropy that adds to intrinsic shape anisotropy while the main difference is its micrometric diameter. From the experimental studies we are describing, we can obtain relevant information about the geometry of the propagating domain walls from the induced signals in the pickup coils when the DW crosses its position. In fact, that information is restricted to the shape and length of the propagating wall but not on its thickness. In this opportunity, we performed an experiment on FeSiB microwire where a DWst is depinned by a pulse field of amplitude Hp, and then it propagates under different Hdr. Figure 12.15a shows the evolution of the shape of the induced signal in a pickup coil for a range of homogeneous drive field Hdr during propagation (similar results are observed for DWst and DWrev). We observe that the shape of induced signal strongly depends on the DW speed, proportional to Hdr. Particularly, the width of the peaks decreases and the height increases continuously with the wall velocity. For small Hdr, the peaks exhibit a kind of internal structure that seems to be related to a transient behavior observed when the wall has not yet reached the stationary propagation process either because it is still close to its depinning position or because the driving field is not strong enough. At higher field Hdr or wall velocity, the induced signal transforms into a single peak denoting likely a modification of the wall shape. However, a straightforward conclusion on the change of the wall shape with its velocity is nevertheless uncertain, as we will discuss.

Quantitative information about the length of the wall can be obtained if we consider the width in time of the induced signals in the pickup coils, which is related to the duration of the passing DW. Experimental data would indicate a high value of several millimeters (Gudoshnikov et al., 2009). Nevertheless, the width of the measuring pickup coils plays a significant role. A simple calculation enables us to estimate the DW length, LDW, from the expression LDW + Lp = v. wp, where Lp is the width of the pickup coil, v the DW velocity, and wp the peak width.
The actual shape of the domain wall in this type of microwires is still an open question. Similar transverse and vortex DWs have been proposed in cylindrical microwires where a change of such types of DWs would induce a change in its mobility (Richter et al., 2010). Nevertheless, such assumption is not yet clearly demonstrated. The different shapes proposed for cylindrical microwires are (i) planar-shaped (i.e., nearly ellipsoidal) wall and (ii) conical-shaped DW with vortex at the wire axis.
The shape of the induced signal is schematically shown in Figure 12.15b. Planar DW was first proposed for thicker amorphous cylindrical wires, around 150 μm in diameter, that give rise to symmetric-shaped induced peaks in pickup coils (Bishop, 1977; Chen et al., 1995). Alternatively, several sorts of conical-like shaped DWs have been considered. First, extended conical or tubular-shaped domain walls keep the circular symmetry of the wire (O’Handley, 1975; Panina et al., 2012), although it introduces a singularity for the magnetic charge density just at the center (i.e., axis) of the wire. More recently, a parabolic-shaped DW second alternative of the conical mode has been proposed for tiny diameter microwires (Tibu et al., 2012). It looks likely that the DW geometrical shape significantly depends on the diameter of the microwire as well as on the DW velocity. The wave form of the induced signal in the pickup coils can be calculated considering the induced voltage given by Faraday’s law:

where the summation is over all turns, N. The result is plotted in Figure 12.15b for planar, conical, and parabolic wall shapes considering N = 2000 turns distributed homogeneously along the 2-mm-long pickup coil and v = 1000 m/s. Note that asymmetric voltage is obtained particularly for conical/tubular shape with different slopes depending on the orientation direction of the wall. Symmetric peaks, although with different shape, can be obtained for planar and parabolic walls.
12.3.2 Final analysis, conclusions, and perspectives
Along the last years, several groups in different laboratories are intensively working on the magnetic behavior of glass-coated microwires. A main objective is the optimization of their magnetic properties and homogeneity so that they can be widely employed in various technologies mostly related to magnetic sensing devices. As indicated in the introduction, all these applications derive from an outstanding magnetic behavior either as ultrasoft microwires for magnetoimpedance or as uniaxial samples for bistable magnetic response. The possibility to deal with the bistable behavior in particular makes one to think of and design new experiments trying to control and profit from the existence and motion of a single domain wall. That is close to an ideal situation for fundamental micromagnetic studies and novel applications.
In magnetic nanostripes, the nucleation of domain walls has been experimentally studied at curved regions or at discrete geometry defects or notches (Jiang et al., 2011), the latter employed alternatively as pinning centers. The axial propagation of transverse and vortex domain walls has been activated by magnetic fields, electrical, and spin currents (Beck et al., 2013; Yamada et al., 2007). The interaction between domain walls and local dipolar fields has been also recently considered (O’Brien et al., 2011; Franken et al., 2014). Quite recently, interactions at the surface of controlled constraints of cylindrical nanowire diameter have been proposed (Dolocan, 2014). In our case, we have focused on the action of local field to control domain walls in cylindrical microwires.
In this chapter, we have shown how the motion of a standard domain wall can be tuned under homogeneous and local fields, or how pairs of domain walls can injected and their alternating motion tailored again by a suitable combination of those fields. We have confirmed that local compositional but mostly geometrical defects modify the wall dynamics, usually in an unwished or uncontrollable manner as those defects cannot be artificially manipulated or tailored.
However, new experiments are in progress. The appropriate tuning of those applied fields can be employed as magnetic gates. In fact, local field can be understood as a valve for the domain wall to stop or open the way of the traveling injected walls. Moreover, the controllable generation and motion of trains of domain walls is a next experimental challenge to overcome. That requires very long microwires (profiting of the improved technology that permits the fabrication even at laboratory scale of kilometer-long pieces of microwires), with reduced diameter and insulating glass coating. We expect that in the near future, these objectives will be achieved and eventually extended to nanoscaled systems.