
Processing magnetic microwires for magnetic bistability and magnetoimpedance
A. Zhukov1,2; M. Ipatov1; V. Zhukova1 1 University of the Basque Country, UPV/EHU, San Sebastian, Spain
2 IKERBASQUE, Basque Foundation for Science, Bilbao, Spain
Abstract
This chapter highlights the processes used to tune magnetic properties and the giant magnetoimpedance effect of thin ferromagnetic wires produced using the so-called Taylor–Ulitovsky method. We provide an overview of the magnetic properties of iron- and cobalt-based composite microwires; describe design issues and manufacturing challenges for light alloys; highlight commonly used metal casting and metal-forming processes; identify enablers that significantly increase the use of light alloys in the production of automotive parts; and describe some of the promising metal-forming technologies for light alloys.
8.1 Introduction
Many industrial sectors, such as magnetic sensors and actuators, microelectronics, security, automotive, energy-efficient refrigeration, medicine, aerospace, energy harvesting and conversion, informatics, electrical engineering, and magnetic recording, demand cost-effective magnetic materials. Soft magnetic materials are characterized by low coercivities, high values of magnetic permeability, and low magnetic hysteresis losses per remagnetization cycle. In the case of conventional crystalline soft magnetic materials, these properties are related to the low magnetocrystalline anisotropy and the small value of the magnetostriction constant, λs. The main interest in amorphous soft magnetic materials is related to their liquid-like structure, which is characterized by the absence both of long-range ordering and of magnetocrystalline anisotropy.
Amorphous and nanocrystalline soft magnetic materials have played an important role in modern industries during the past 20 years because of many attractive and relevant technological applications (Durand, 1983). Among different families of soft amorphous and nanocrystalline magnetic materials, magnetically soft wires (with typical diameters from 1 to 120 μm) attracted considerable interest because of their unusual magnetic properties such as magnetic bistability and giant magnetoimpedance (GMI) effect (Jiles, 2003; Zhukova et al., 2009a,b; Zhukov et al., 2014a). These properties have been proposed for various magnetic sensor applications (Honkura, 2002; Mohri et al., 2002).
For many emerging applications, sensor size is an important issue. Therefore, a certain tendency in the development of magnetic wires with thin diameters, such as melt-extracted wires (typically with diameters of 40–50 μm) (Qin and Peng 2013; Zhukova et al., 2003a,b) and glass-coated microwires with even thinner diameters (between 1 and 40 μm) (Chiriac et al., 2010; Zhukov and Zhukova, 2009; Zhukov and Zhukova, 2014), recently gained growing interest.
The advantage of the Taylor–Ulitovsky method, a unique, rapidly quenching fabrication technique, is that it allows the preparation of glass-coated metallic microwires with the thinnest diameters (from 0.2 to 100 μm). This method allows controllable fabrication of long (a continuous microwire up to a few kilometers long) and homogeneous thin composite wires (Chiriac and Ovari, 1996; Chiriac et al., 2010; Zhukov et al., 1995, 2014a; Zhukov and Zhukova, 2009).
The fabrication method denominated in most modern publications as a modified Taylor–Ulitovsky and/or quenching-and-drawing method has actually been well known since the 1960s and was well described in the Russian literature in the 1960s and 1970s (Ulitovski and Avernin, 1964; Ulitovsky et al., 1960; Badinter et al., 1973), as well as in recent publications (Zhukov and Zhukova, 2009). In the laboratory process, an ingot containing a few grams of the master alloy is placed into a Pyrex-like glass tube and within a high-frequency inductor heater. The alloy is heated to its melting point, forming a droplet. While the metal melts, the portion of the glass tube adjacent to the melting metal softens, enveloping the metal droplet. A glass capillary is then drawn from the softened glass portion and wound onto a rotating coil. At suitable drawing conditions, a composite microwire consisting of a metallic nucleus surrounded by a glass coating is formed.
The microstructure of a microwire depends mainly on the cooling rate. Bulk magnetic properties of glass-coated microwires are determined by the microstructure of the metallic nucleus, by magnetoelastic anisotropy, and by defects. On the other hand, to optimize the properties related to the surface layers (as in the case of the GMI effect), the interfacial layer between the metallic nucleus and the glass coating and the defects on the surface of the metallic nucleus are especially relevant (Zhukov and Zhukova, 2009). Existence of this interfacial layer and defects were recently reported (Zhukov et al., 2014b).
The great advantage of glass-coated microwires is that the metallic nucleus diameter obtained could be significantly reduced, compared with the case of amorphous wires produced using an “in-rotating water” method.
Since 2000, many results achieved for extremely soft magnetic properties and a high GMI effect in glass-coated microwires have been reported at the laboratory level (Pirota et al., 2000; Zhukov et al., 2008; Zhukov and Zhukova, 2014; Zhukov et al., 2014a–c; Zhukova et al., 2002, 2009a,b). These results gave rise to the development of industrial applications for low magnetic field detection in various industrial sectors (Zhukov et al., 2014a; Zhukov and Zhukova, 2014). Currently existing technical applications involve use of the GMI effect. New types of stress-tuneable composite materials based on thin ferromagnetic wires, with effective microwave permittivity depending on an external direct current (DC) magnetic field or tensile stress, have recently been introduced (Makhnovskiy et al., 2005; Qin and Peng, 2013; Panina et al., 2011; Peng et al., 2009).
Considerable progress in tailoring the magnetic properties of thin microwires, with special emphasis on a fast domain wall, has recently been achieved. In particular, high domain wall velocities have been observed in magnetic microwires with magnetic bistability (Varga et al., 2007; Zhukova et al., 2009a,b; Zhukov et al., 2014a; Zhukov and Zhukova, 2014). Extremely fast magnetization switching can be suitable for technological applications such as electronic surveillance, magnetic coding, magnetic memories, and logics.
In this chapter, we give attention to an overview of the fabrication, processing, and tailoring of magnetic properties of amorphous microwires exhibiting a number of exciting functional magnetic properties that are interesting for already introduced and proposed applications in magnetic sensors. We review the most relevant aspects concerning the magnetic properties of thin, magnetically soft microwires, followed by sections devoted to results of the correlation of the GMI effect and enhanced magnetic softness, the effect of thermal treatments, and tailoring of magnetic properties and GMI, GMI-related applications, and fast domain wall dynamics in thin wires.
8.2 Amorphous microwires and their magnetic properties
As mentioned above, development of soft magnetic materials in the form of ribbons, wires, microwires, and/or multilayered thin films with amorphous and nanocrystalline structures continues to attract significant attention within the scientific community. A comprehensive understanding of the processing–structure–property relationship in the fabricated materials is of critical importance.
Certain industrial sectors, such as magnetic sensors, microelectronics, and security, need cheap soft magnetic materials with reduced dimensions and, simultaneously, good magnetic properties (enhanced magnetic softness in particular). For the development of magnetic sensors with reduced dimensions, glass-coated microwires with the lowest ferromagnetic wire diameters obtained by relatively inexpensive technology are the best solution. Consequently, studies of magnetically soft glass-coated microwires recently attracted great attention (Zhukova et al., 2009a,b; Zhukov et al., 2014a; Zhukov and Zhukova, 2014). Initially, magnetic softness was considerably poorer than that of thicker amorphous alloys (ribbons and wires). But additional studies and processing (annealing, optimizing the alloy composition and/or magnetoelastic anisotropy) allowed considerably improved soft magnetic properties of glass-coated microwires (Zhukova et al., 2009a,b; Zhukov et al., 2014a; Zhukov and Zhukova, 2014). Consequently, since 2010 glass-coated microwires have been used in miniaturized magnetic field sensors produced by Aichi Steels (Zhukov et al., 2014a).
8.2.1 Effect of composition: Properties relevant for applications
As a rule, better soft magnetic properties are observed for nearly zero magnetostrictive cobalt (Co)-rich compositions. It is worth mentioning that the magnetostriction constant λs in a system (CoxFe1 − x)75Si15B10 changes with x, from − 5 × 10− 6 at x = 1 to λs ≈ 35 × 10− 6 at x ≈ 0.2, achieving nearly zero values at Co-to-iron (Fe) ratios of about 70:5 (Konno and Mohri, 1989; Zhukov et al., 2003). On the other hand, microwires with an Fe-rich metallic nucleus present rather different magnetic properties and exhibit rectangular hysteresis loops related to a large and single Barkhausen jump.
In general, magnetic properties and the overall shape of the hysteresis loops of amorphous microwires depend on the composition of the metallic nucleus, as well as the composition and thickness of the glass coating. This is illustrated in Figure 8.1, where the hysteresis loops of three main groups of amorphous microwires are Fe-rich, Co-rich, and Co–Fe-rich wires with positive, negative, and vanishing magnetostriction constants, respectively.

The composite character of glass-coated microwires affects magnetic properties mostly through the internal stresses induced by the glass coating (Zhukov et al., 2014a). The origin of these stresses is determined by the difference in the thermal expansion coefficients of the glass and metallic alloy and by rapid solidification of the composite microwire. It is worth mentioning that the strength of such internal stresses depends on the ρ ratio between the metallic nucleus diameter d, and the total microwire diameter D. Consequently, the strength of these stresses can be controlled by the ρ ratio: As the strength of the internal stresses increases, the ρ ratio decreases, that is, it increases with an increase in the glass volume (Velázquez et al., 1996; Chiriac et al., 2003; Antonov et al., 2000). Therefore, within each group of the aforementioned amorphous microwire compositions (Fe-rich with a rectangular hysteresis loop or Co–Fe-rich with a vanishing magnetostriction coefficient), the considerable effect of the ρ ratio on hysteretic magnetic properties can be appreciated from Figures 8.2 and 8.3. Thus, increasing of the magnetic anisotropy field (Figure 8.2) and increasing of the coercivity (Figure 8.3) with a decrease in the ρ ratio is observed for Co–Ni–Fe- and for Fe-based microwires, respectively.


All Co-rich microwires exhibit almost unhysteretic loops with a low enough coercivity (4–5 A/m) (Figure 8.2). The magnetic anisotropy field Hk increases as the ρ ratio increases. Low coercivity, remanent magnetization, and magnetic anisotropy field and high magnetic permeability are attributed to the considerable contribution of magnetization rotation at a low magnetic field. This denotes the existence of a circumferential magnetic anisotropy throughout the whole volume of the metallic nucleus, practically without an inner core (Vázquez, 2007; Zhukov et al., 2000a,b), indicating that almost the entire cross section should consist of a circumferentially magnetized shell with a well-defined transverse magnetic anisotropy kφ, whose anisotropy field ![]() can be experimentally evaluated as the field required to reach saturation in the axial direction.
can be experimentally evaluated as the field required to reach saturation in the axial direction.
Magnetic bistability exhibited by amorphous, glass-coated microwires with a positive magnetostriction constant is associated with a perfectly rectangular hysteresis loop, which is typical of microwires related to axial orientation of magnetization in the majority of the metallic nucleus (Vázquez and Zhukov, 1996; Vázquez, 2007; Zhukov et al., 2014a). All hysteresis loops of Fe-rich microwires presented in Figure 8.3 exhibit a perfectly rectangular character when the hysteresis loops are measured at low enough values of frequency f and/or amplitude H0 of an applied magnetic field. The magnetization reversal is characterized by the switching field Hs, which corresponds to the beginning of the magnetization switching. For low enough f and/or H0 values, Hs practically coincides with the coercivity Hc. Increasing the f and/or H0, a considerable change in the slope of the vertical regions of the hysteresis loops can be observed. This phenomena should be attributed to the counterbalance between the sweeping rate dH/dt = 4fH0 (i.e., increasing H0 results in a faster change of magnetic field dH for the same time interval dt) and the switching time related to the time needed for domain wall propagation along the whole wire (Zhukov et al., 1997).
As can be observed in Figure 8.3, for the same Fe-rich composition of the metallic nucleus, quite different coercivity values can be obtained. The switching field Hs, that is, the magnetic field required to reverse magnetization (creating a rectangular hysteresis loop), increases for the same metallic nucleus composition (Fe65B15Si15C5) with a decrease in the geometric ratio ρ. Such increase in the switching field has been attributed to an increase in the strength of internal stresses as the thickness of the glass coating increases. The switching field Hs should be proportional to the energy required to form the domain wall γ involved in the bistable process. The domain wall energy is related to the magnetoelastic anisotropy and, therefore, to the applied tensile stress, as given by (Zhukov and Zhukova, 2009):
where α is the angle between the magnetization and axial directions, A is the exchange energy constant, λs is the saturation magnetostriction constant, and σi is the internal stress. Consequently, Hs must be proportional to (σa + σr)1/2 for cos α ≈ 1. Note that, as mentioned above, the strength of the internal stresses increases as the ρ ratio decreases.
Consequently, a considerable increase (almost one order of magnitude) in the switching field (from about 80 to 700 A/m) is observed when the ferromagnetic metallic nucleus diameter decreases from 15 to 1.4 μm (Zhukov et al., 2012a,b). The rectangular shape of the hysteresis loop is maintained, even for the smallest microwires diameters.
Thus one more relevant parameter affecting the strength of internal stresses and the magnetoelastic energy is the ρ ratio. Such strong dependence of the hysteresis loops on these parameters should be attributed to the magnetoelastic energy Kme, given by
where λs is the saturation magnetostriction and σi is the internal stress (Zhukov and Zhukova, 2009; Zhukov et al., 2014a). The estimated values of the internal stresses in these glass-coated microwires are on the order of 100–1000 MPa, depend strongly on the ρ ratio, and increase with a decrease in the ρ ratio (Chiriac and Ovari, 1996; Velázquez et al., 1996). Such large internal stresses give rise to a drastic change in the magnetoelastic energy Kme, even for small changes in the glass-coating thickness at a fixed metallic core diameter.
The aforementioned magnetic bistable behavior is related to the presence of a single large Barkhausen jump, which was interpreted as the magnetization reversal in a large single domain (Vázquez and Zhukov, 1996). This peculiar domain structure is observed above a certain critical length that correlates well with the demagnetizing factor (Zhukov et al., 1995), indicating that the closure domains penetrate from the wire ends inside the internal axially magnetized core, destroying the single domain structure. Use of glass-coated microwires allows drastic reduction of the demagnetizing factor and, consequently, of the critical length lc, from a few centimeters (lc ≈ 7 cm for conventional Fe-rich amorphous wires with a diameter of ~ 120 μm) to a few millimeters (lc ≈ 2 mm for Fe-rich glass-coated microwires with a diameter of ≈ 10 μm). This drastic reduction in critical length is essentially important for microsensor applications.
As mentioned above, the current main technological interest in magnetically soft microwires is related to the excellent magnetic softness and GMI effect observed in nearly zero magnetostriction composition (Zhukov et al., 2014a). This GMI effect consists of the large change in the electric impedance of a magnetic conductor when it is subjected to an axial DC magnetic field. The GMI effect is usually characterized by the MI ratio ΔZ/Z, defined as
where Hmax is the maximum DC longitudinal magnetic field on the order of few kiloamperes per meter, usually supplied by long solenoid and/or Helmholtz coils. The example of ΔZ/Z (H) dependence measured in a Co-rich glass-coated microwire is shown in Figure 8.4. The large sensitivity of the total impedance of a soft magnetic conductor at low magnetic fields and a high-frequency driven alternating current (AC) originates from the dependence of the transverse magnetic permeability on the axial DC magnetic field and the skin effect (Beach and Berkowitz, 1994; Panina and Mohri, 1994). The main interest in GMI effect is that aforementioned large magnetic field sensitivity is suitable for inexpensive and quite sensitive magnetic field detection. A few laboratory and industrial magnetic field sensors allowing 1- to 10-pT magnetic field resolution have been reported to date (Uchiyama et al., 2011; Gudoshnikov et al., 2014). In addition to high magnetic field resolution, low price and small dimensions are other advantages of proposed GMI magnetic field sensors (Uchiyama et al., 2011; Honkura, 2002).

8.2.2 GMI effect and enhanced magnetic softness: Tailoring magnetic properties and GMI
As already mentioned in Section 8.2.1, the GMI effect usually observed in soft magnetic materials phenomenologically consists of a change in the AC impedance, Z = R + iX (where R is the real part, or resistance, and X is the imaginary part, or reactance), when submitted to an external magnetic field H. The GMI effect was interpreted well in terms of the classical skin effect in a magnetic conductor assuming the dependence of the penetration depth of the AC flowing through the magnetically soft conductor on the DC applied magnetic field (Beach and Berkowitz, 1994; Panina and Mohri, 1994). The cylindrical shape and high circumferential permeability typical of amorphous wires are quite favorable for achieving a high GMI effect (Panina and Mohri, 1994; Zhukov et al., 2014a). Dependence of the GMI ratio on the magnetic field is intrinsically related to the magnetic anisotropy features: the circumferential anisotropy leads to the observation of the maximum of the real component of wire impedance (and, consequently, of the GMI ratio) as a function of the external magnetic field. For axial magnetic anisotropy, the maximum value of the GMI ratio corresponds to zero magnetic fields (Usov et al., 1998), that is, it results in a monotonic decay of the GMI ratio with the axial magnetic field.
Like magnetic permeability, the GMI effect presents a tensor character (Sandacci et al., 2004; Zhukov et al., 2008). Moreover, from the point of view of industrial applications, antisymmetrical magnetic field dependence of the output voltage with a linear region obtained for a pulsed GMI effect based on detection of the off-diagonal GMI component of amorphous wires is very useful (Sandacci et al., 2004; Zhukov et al., 2008). Consequently, this pulsed GMI effect is actually used for industrial applications.
The GMI effect was initially interpreted assuming a scalar character for the magnetic permeability, as a consequence of a change in the penetration depth of the AC caused by the DC applied magnetic field. The electrical impedance Z of a magnetic conductor in this case is given by (Panina and Mohri, 1994):
with k = (1 + j)/δ, where J0 and J1 are the Bessel functions, r is the wire’s radius, and δ is the penetration depth given by:
where σ is the electrical conductivity, f is the frequency of the current along the sample, and μϕ the circular magnetic permeability, which is assumed to be scalar. The DC applied magnetic field introduces significant changes in the circular permeability μϕ. Therefore, the penetration depth also changes and finally results in a change in Z (Panina and Mohri, 1994).
The main feature of the GMI effect that makes it suitable for applications is a large change in the total impedance (in most cases > 100%). In the case of amorphous wires with high circumferential permeability, the highest GMI effect is usually reported (Zhukov et al., 2014a). Thus, a few researchers reported an achievement of an ~ 600% GMI ratio in Co-rich microwires with a vanishing magnetostriction constant (Zhukova et al., 2002; Pirota et al., 2000). In this case, it is quite promising for the application of magnetic sensors.
Moreover, the GMI materials—whether wires, ribbons, or films—are usually extremely soft magnetic materials. In addition, the AC plays an important part in the GMI effect, mainly because the AC current flowing through the sample creates a circumferential magnetic field. This circumferential magnetic field affects the magnetic permeability, which, similar to the GMI effect, presents a tensor character (Aragoneses et al., 2000). The AC current can also produce Joule heating (Zhukova et al., 2001).
The surface impedance tensor in magnetic wires with circumferential anisotropy has been expressed as (Makhnovskiy et al., 2001; Sandacci et al., 2004; Zhukov et al., 2008)

The circular magnetic field hφ is produced by the currents iw running through the wire. At the wire’s surface, hφ = i/2πr, where r is the wire radius. The longitudinal magnetic field hz is produced by the currents ic running through the exciting coil, hz = N1ic, where N1 is the number of turns of the exciting coil.
Various excitation and measurement methods are required to reveal the impedance matrix elements. The longitudinal and circumferential electrical fields on the wire’s surface can be measured as a voltage drop along the wire vw and voltage induced in the pickup coil vc wound around it (Makhnovskiy et al., 2001; Sandacci et al., 2004; Zhukov et al., 2008).
where lw is the wire length and lt = 2πrN2 the total length of the pickup coil turns N2 wound directly around the wire.
The methods for revealing the different elements of an impedance tensor are shown in Figure 8.5. The longitudinal diagonal component ςzz is defined as the voltage drop along the wire and corresponds to the definition of impedance in a classical model (Figure 8.5a):


The off-diagonal components ςzφ and ςφz (Figure 8.5b and c) and the circumferential diagonal component ςφφ (Figure 8.5d) arose from a cross-sectional magnetization process (hφ → mz and hz → mφ) (Makhnovskiy et al., 2001; Sandacci et al., 2004; Zhukov et al., 2008; Ipatov et al., 2008a,b).
As mentioned above, a pulsed excitation scheme allows the antisymmetrical magnetic field dependence of the output voltage with a linear region to be obtained (Makhnovskiy et al., 2001; Sandacci et al., 2004; Zhukov et al., 2008; Ipatov et al., 2008a,b). The shape of the magnetic field dependence of the GMI effect (including off-diagonal components) is intrinsically related to the magnetic anisotropy and peculiar surface domain structure of amorphous wires (Usov et al., 1998). The magnetic anisotropy of amorphous microwires in the absence of magnetocrystalline anisotropy is determined mostly by the magnetoelastic term (Zhukov et al., 2014a). Therefore, the magnetic anisotropy can be tailored by thermal treatment (Zhukov and Zhukova, 2009; Zhukov and Zhukova, 2014; Zhukov et al., 2014a–c). On the other hand, considerable GMI hysteresis, which was recently observed and analyzed in microwires (Ipatov et al., 2010), has been explained considering the helical magnetic anisotropy.
The magnetic field H and dependence of the real part R on the longitudinal wire impedance Z (Z = R + iX), measured up to 4 GHz in Co66Cr3.5Fe3.5B16Si11 and Co67Fe3.85Ni1.45B11.5Si14.5Mo1.7 microwires, are shown in Figure 8.6. General features of these dependences are the existence of two maximums, ΔZ/Zm, that shift to higher magnetic fields with increasing the frequency f. A considerable GMI effect has been observed even at gigahertz frequencies.
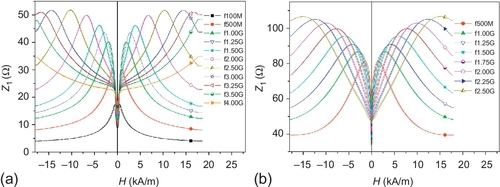
Values of ΔZ/Zm at high enough frequencies usually decrease starting from some frequency. Most microwires show the highest GMI ratio at frequencies between 100 and 300 MHz (Figures 8.6 and 8.7). Other interesting features observed in Figure 8.7a and b are that the frequency dependence of the maximum GMI ratio ΔZ/Zm(f), measured in microwires with the same composition but different diameters, presents an optimum frequency (at which ΔZ/Zm versus f exhibits the maximum value) at different frequencies. Thus, for metallic nucleus diameters ranging between 8.5 and 9.0 μm, the optimum frequency is about 100 MHz, whereas for microwires with metallic nucleus diameters between 9 and 11.7 μm, the optimum frequency is about 200 MHz.

One more factor that must be avoided for applications of the GMI effect is GMI hysteresis. Both off-diagonal and diagonal components of GMI present considerable hysteresis, as shown in Figure 8.8 for a Co67Fe3.85Ni1.45B11.5Si14.5Mo1.7 microwire. This GMI hysteresis does not depend on frequency: hysteresis persists with increases in the frequency of the GMI (Figure 8.8b).

Our recent studies revealed that observed GMI hysteresis is related to considerable deviation of the anisotropy easy axis from the transverse direction (Ipatov et al., 2010). Consequently, we explained the nature of observed low field hysteresis on R(H) and Zϕz(H) (Figure 8.8a and b) considering the existence of helical magnetic anisotropy (Ipatov et al., 2010). Application of the circular bias magnetic field Hb produced by the DC IB running through the wire affects the hysteresis and asymmetry of the GMI dependence, suppressing this hysteresis when IB is high enough (see Figure 8.9, which shows the effect of bias voltage on diagonal impedance R and on the S21 parameter, proportional to off-diagonal GMI component).

As shown above, the strength of internal stresses can be controlled by the ρ ratio: The strength of internal stresses increases with a decreasing ρ ratio (i.e., it increases with an increase in the glass volume). The DC magnetic field that corresponds to the maximum GMI ratio Hm is attributed to the static magnetic anisotropy field Hk (at frequencies < 1 GHz, where the influence of FMR is not significant). Figure 8.2 shows the influence of the ρ ratio on the hysteresis loops and magnetic anisotropy field of Co67.1Fe3.8Ni1.4Si14.5B11.5 microwires with the same composition of metallic nucleus but different ρ ratios.
Consequently, the ρ ratio also affects the GMI effect of glass-coated microwires, as shown in Figure 8.10. Both maximum values of the GMI ratio ΔZ/Zm and the magnetic anisotropy considerably depend on the sample’s geometry. It is worth mentioning that for microwires with thinnest glass coating (the largest ρ ratio), ΔZ/Zm ≈ 600% has been observed (Zhukova et al., 2002).

Considering that the magnetoelastic energy Kme is determined by both internal (σi) and applied stresses (σa), the GMI effect has been measured under tensile stresses in various Co-rich microwires. Figure 8.11 presents tensile stress dependence measured in Co67.05Fe3.85Ni1.4B11.33Si14.47Mo1.69 and Co68.5Mn6.5Si10B15 microwires. ΔZ/Z and Hm are quite sensitive to the application of external tensile stresses σa; here the magnetic field Hm, corresponding to the maximum of ΔZ/Z, shows a roughly linear increase with σ (Figure 8.11c).

As mentioned above, the value of the DC axial field that corresponds to the maximum GMI ratio Hm should be attributed to the static circular anisotropy field Hk. Consequently, using ΔZ/Z(H) dependences measured at different σa, we obtained Hm(σ) dependence (presented in Figure 8.11c) and evaluated the magnetostriction coefficient value considering well-known expression for the stress dependence of the anisotropy field (Cobeño et al., 2001), given by
where μο Ms is the saturation magnetization.
Estimated values of λs ≈ − 2 × 10− 7 have been obtained, which are rather reasonable compared with the reported values measured from the stress dependence of initial magnetic susceptibility (λs ≈ − 3 × 10− 7 for such composition) and the magnetostriction values measured in amorphous wires of similar compositions (Cobeño et al., 2001).
Moreover, the observed tendency of Hm to change under application of tensile stresses (Figure 8.11c) and the change in Hm and Hk with a decreasing ρ ratio (Figures 8.2 and 8.10) are the same, confirming the effect of magnetoelastic anisotropy on hysteresis loops and GMI.
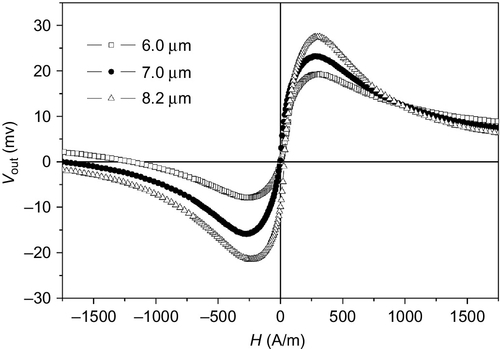
Similarly, the ρ ratio affects the antisymmetrical magnetic field dependence of the output voltage typical for a pulsed excitation regime. In this case, the output voltage from the pickup coil surrounding the microwire is proportional to the off-diagonal GMI component of amorphous wires. Figure 8.12 shows the field dependence of the off-diagonal voltage response Vout, measured using a pulsed scheme, in a Co67.1Fe3.8Ni1.4Si14.5B11.5Mo1.7 (λs ≈ − 3 × 10− 7) microwire with different geometry: a metallic nucleus diameter of 6 μm, a total diameter 10.2 μm (ρ ≈ 0.59); a metallic nucleus diameter of 7 μm and a total diameter of 11 μm (ρ ≈ 0.64); and a metallic nucleus diameter of 8.2 μm and a total diameter of 13.7 μm (ρ ≈ 0.6). As can be observed, the amplitude of the Vout increases with an increase in the metallic nucleus diameter d, and the Hm value depends on the ρ ratio. As in the case of the conventional GMI effect, the effect of the ρ ratio on Vout(H) (Figure 8.12) should be attributed to the magnetoelastic anisotropy related to internal stresses.
The conventional way to tailor the magnetoelastic anisotropy is relaxing internal stress by heat treatment. Under DC annealing the Hm decreases from 480 A/m in an as-cast state to 230 A/m after 5 min annealing with a 50-mA current (Figure 8.13). After the Joule heat treatment, the Vout(H) curve becomes sharper, exhibiting higher magnetic field sensitivity and showing a lower maximum field Hm related to the magnetic anisotropy field. We explained the observed changes by considering that the Joule heating of nearly zero magnetostriction microwires results in a decrease in the internal stresses and an increase in the magnetic softness (Zhukov et al., 2008).

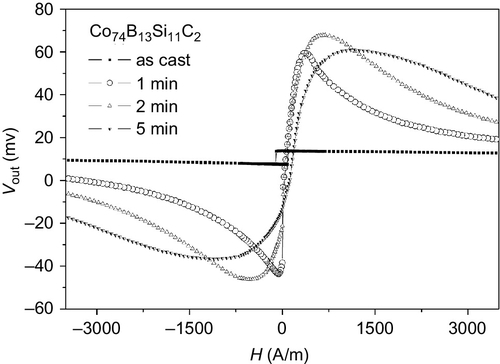
Similarly, in Co74B13Si11C2 microwire with high negative magnetostriction (λs ≈ − 10− 6; d ≈ 10 μm), Joule heating strongly affects the off-diagonal MI curve (Zhukova et al, 2008); the hysteretic MI curve transforms into an unhysteretic one with a large enough nearly linear region (Figure 8.14). Low sensitivity of microwires with negative magnetostriction should be attributed to a high enough magnetoelastic energy, related to high negative magnetostriction and stresses induced in the metallic nucleus by the glass coating during simultaneous quenching. Joule heating reduces internal stresses and enhances the Vout.
Similarly, current annealing (caused by Joule heating) induced changes in the GMI ratio (Figure 8.15). This effect should be mostly attributed to stress relaxation (although the electrical current also induces a circular magnetic field).

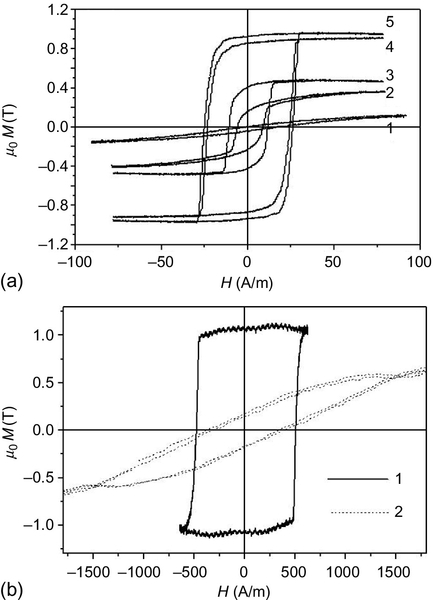
We recently observed drastic changes induced by annealing in nearly zero magnetostrictive Co-rich microwires. These microwires showed a low, negative magnetostriction coefficient in an as-prepared state. As-prepared Co69.2Fe4.1B11.8Si13.8C1.1 amorphous microwires present soft magnetic behavior with quite low coercivity (about 4 A/m; Figure 8.16a), similar to the other Co-rich amorphous microwires with a nearly zero negative magnetostriction constant and similar compositions. Annealing even for only 5 min at different temperatures induced considerable changes in the hysteresis loops (Figure 8.16b and c). After annealing at temperatures above 200 °C, the hysteresis loop of a Co69.2Fe4.1B11.8Si13.8C1.1 microwire drastically changes: we observed a considerable increase in coercivity, from 4 to 40 A/m. It is worth mentioning that an annealed (annealing temperature [Tann] of 300 °C for 5 min) Co69.2Fe4.1B11.8Si13.8C1.1 amorphous microwire presents a rectangular hysteresis loop similar to that of an as-prepared amorphous Fe73.8Cu1Nb3.1B9.1Si13 microwire. The differences between these hysteresis loops are the coercivity (about 15% higher for Fe-rich microwires) and the magnetic permeability of the flat branches of hysteresis loop (higher for Co-rich microwires).

As-prepared Co69.2Fe4.1B11.8Si13.8C1.1 microwires present a rather large GMI effect (GMI ratio ΔZ/Z up to 300%; Figure 8.17a). After annealing at Tann = 300 °C for 5 min, a decrease in ΔZ/Z, from 300% to 150%, is observed (Figure 8.17b). A comparison of the GMI ratios of amorphous Fe73.8Cu1Nb3.1B9.1Si13 microwires measured at the same conditions is provided in Figure 8.17c. As can be appreciated, Co-rich microwires showing rectangular hysteresis loops present a much larger GMI ratio than Fe-rich microwires, which also show a rectangular hysteresis loop. For Fe-rich microwires, we observed ΔZ/Z ≈ 8%.

An off-diagonal GMI effect represented by S21 without bias current is rather low for as-prepared and annealed samples (Figure 8.18). As can be appreciated from Figure 8.18, and similar to other Co-rich microwires, the bias field Hb, produced by the bias current IB, strongly affects the off-diagonal impedance and GMI hysteresis. But considerable hysteresis is observed even when IB = 50 mA, reflecting the considerable helical magnetic anisotropy of the sample (Ipatov et al., 2010).

To interpret an unusual increase in the coercivity and the overall change in the hysteresis loop, both stress relaxation and the considerable effect of internal stresses on the magnetostriction constant have been considered. It was assumed that stress relaxation induced by annealing results in a change in the magnetostriction sign. However, a considerable GMI effect allows the assumption that the outer domain shell of the annealed Co-rich microwire, exhibiting a rectangular hysteresis loop and a GMI effect, has high circumferential magnetic permeability.
It was previously demonstrated that application of stress and/or magnetic field during annealing of amorphous materials may induce strong additional magnetic anisotropy. In the case of microwires, this induced anisotropy can be reinforced by strong internal stresses; in this case even conventional annealing must be considered as stress annealing (Zhukov et al., 2000a,b).
In some cases, this results in drastic changes in hysteretic magnetic properties and GMI behavior (Zhukov, 2006; Zhukov et al., 2006; Zhukova et al., 2003a,b). As an example, application of an axial magnetic field during annealing induces axial magnetic anisotropy in Co-rich microwires (Figure 8.19). Here, hysteresis loops of Co67Fe3.85Ni1.45B11.5Si14.5Mo1.7 microwires (d = 22.4 μm, D = 22.8 μm) annealed by Joule heating without magnetic field, current annealing (CA) and with application of an axial magnetic field, field current annealing (FCA) are shown. As can be appreciated, application of a magnetic field during annealing resulted in the complete opposite tendency in the change of magnetic properties induced by annealing: An increase in the remanent magnetization and a decrease in coercivity are observed after FCA, whereas CA treatment induced a decrease in the remanence and the coercivity.

In the case of stress-annealed Fe-rich microwires, the character of the hysteresis loops completely changed when compared with as-prepared samples (Figure 8.20). Stress annealing of Fe74B13Si11C2 microwires caused considerable stress-induced anisotropy (Zhukov, 2006; Zhukov et al., 2006; Zhukova et al., 2003a,b). The shape of the hysteresis loop changes completely, and the degree of induced changes depends on the duration and temperature of annealing (Figure 8.20a). In this case, the easy axis of magnetic anisotropy has been changed from axial to transverse (Zhukov, 2006; Zhukov et al., 2006; Zhukova et al., 2003a,b). In addition, the application of stress during measurements of stress-annealed microwires with well-defined transverse anisotropy resulted in a drastic change in the hysteresis loop (Figure 8.20b).
The origin of such stress-induced anisotropy has been explained by considering so-called back stresses that originate from the composite origin of glass-coated microwires annealed under tensile stress. Compressive stresses compensate for the axial stress component, and transversal stress components are predominant in stress-annealed microwires under these conditions (Zhukov, 2006; Zhukov et al., 2006; Zhukova et al., 2003a,b).
Consequently, these stress-annealed samples exhibit a stress impedance effect, that is, an impedance change (ΔZ/Z) under applied stress σ is observed in samples with stress-induced transversal anisotropy (Zhukov, 2006; Zhukov et al., 2006; Zhukova et al., 2003a,b). After annealing at proper conditions, considerable stress impedance is achieved, as shown in Figure 8.21.

8.2.3 Effect of partial crystallization and nanocrystallization on magnetic properties and GMI
Although crystallization of amorphous materials usually results in the degradation of their magnetic softness, in some cases crystallization can improve magnetically soft behavior. This is the case of so-called nanocrystalline alloys obtained by suitable annealing of amorphous metals. These materials were introduced in 1988 by Yoshizawa et al. (1988) and later were intensively studied by a number of research groups (Herzer, 1990). A nanocrystalline structure of partially crystalline amorphous precursors is observed, in particular in Fe–silicon (Si)–boron (B) with small additions of copper (Cu) and niobium (Nb). Small additions of Cu and Nb inhibit the grain nucleation and decrease the grain growth rate (Herzer, 1990). The main interest in such nanocrystalline alloys is related to extremely soft magnetic properties combined with high saturation magnetization. Such soft magnetic character is thought to originate when the magnetocrystalline anisotropy vanishes and the very small magnetostriction value achieved when the grain size approaches 10 nm (Herzer, 1990). In addition to the suppressed magnetocrystalline anisotropy, low magnetostriction values provide the basis for the superior soft magnetic properties observed in particular compositions (Herzer et al., 2010).
Considerable magnetic softening and enhancement of the GMI effect have previously been reported for FINEMET-type ribbons and conventional wires (Guo et al., 2001; Hernando et al., 2006). Magnetic softening was reported in glass-coated, FINMET-type microwires (Dudek et al., 2007; Arcas et al., 1996; Chiriac et al., 1998). However, considerable improvement in the GMI effect in the case of glass-coated microwires was reported quite recently (Zhukov et al., 2014c; Talaat et al., 2014a,b).
As-prepared FINMET-type Fe73.4Cu1Nb3.1SixB22.5 − x (x = 11.5, 13.5, and 16.5) and Fe73.4 − xCu1Nb3.1Si13.4 + xB9.1 (0 ≤ x ≤ 1.1) microwires present rectangular hysteresis loops similar to other Fe-rich amorphous microwires (Zhukov et al., 2014c; Talaat et al., 2014a,b). For illustration, in Figure 8.22 we provide hysteresis loops of Fe70.8Cu1Nb3.1Si14.5B10.6 microwires with different ρ ratios (ρ = 0.79 and ρ = 0.38).

The coercivity Hc of as-prepared, Finemet-type microwires depends on the ratio ρ = d/D (Figure 8.23). After annealing we observed magnetic softening of Finemet-type microwires followed by abrupt magnetic hardening at Tann > 873°K (Figure 8.24). This magnetic hardening is usually associated with the second crystallization process.


Magnetic softening with a rather low Hc value is obtained in samples treated at Tann of 773–873°K. This magnetic softening is related to the nanocrystallization process due to the precipitation of fine grains (10–15 nm) of an α-Fe(Si) phase within the amorphous matrix. Such interpretation has been confirmed by X-ray diffraction studies of as-prepared samples and samples annealed at different temperatures (Talaat et al., 2014a; Zhukov et al., 2014c; Talaat et al., 2014a; Figure 8.25). As-prepared Fe70.8Cu1Nb3.1Si14.5B10.6 microwires present an amorphous structure. The first crystallization process was observed at a temperature ≥ 823 K (Figure 8.25) and corresponds to the precipitation of α-Fe (Si) body-centered cubic crystal structure, similar to the nanocrystallization of conventional FeCuNbSiB materials (Herzer, 1990; Herzer et al., 2010). We estimated the grain size Dg using the Debye–Sherrer formula. As shown in Figure 8.26, the average crystallite size at Tann = 823°K is 12 nm, increasing to 27 nm at T = 923°K. Similar dependence of the average crystallite size on Tann has been observed for the Fe70.8Cu1Nb3.1Si14.5B10.6 microwires with different ρ ratios.


The GMI effect in as-prepared Fe-rich microwires is rather small (Figure 8.27a–c): about 1% at a measured frequency of ~ 100 MHz. After annealing, a considerable increase in the GMI ratio ΔZ/Z has been observed (Figure 8.27a–c). The GMI effect has been measured after annealing at Tann below that of the first crystallization process (723°K) and right after the beginning of the nanocrystallization. As can be appreciated from Figure 8.27, after annealing at temperatures at which the nanocrystalline structure of the samples was achieved, we observed a drastic enhancement of the ΔZ/Z effect. This considerable growth of the GMI ratio must be related to the magnetic softening of microwires after annealing and related to the internal stress relaxation and especially the nanocrystallization.

Another factor that affects the GMI ratio is the frequency at which the GMI ratio is measured. Consequently, ΔZ/Z(H) has been measured at different frequencies (Figure 8.28). In as-prepared samples, we did not observe any appreciable frequency dependence, and the GMI effect is low (< 3%; Figure 8.28a). In samples annealed at 823°K (Figure 8.28b), however, the GMI ratio achieves values around 90% at 500 MHz for the same Fe70.8Cu1Nb3.1Si14.5B10.6 microwire.

It is well known that magnetic anisotropy considerably affects the ΔZ/Z(H) dependence (Usov et al., 1998). A double-peak ΔZ/Z(H) observed in nanocrystalline microwires is typical for samples with a low negative magnetostriction constant. Therefore, we can assume that annealing results in the formation of a double-phase structure with a vanishing magnetostriction constant.
As observed in Figure 8.27, the GMI ratio increases even after annealing at temperatures less than the initial crystallization temperatures. The GMI effect is affected by the internal stresses distribution (Cobeño et al., 2002). Consequently, this GMI ratio increase must be attributed to stress relaxation.
Analyzing the dependence of as-prepared microwires on ΔZ/Z(H), we found that some as-prepared samples present an anomalously high GMI effect (Figure 8.29). This is the case for an Fe73.8Cu1Nb3.1Si13B9.1 microwire, which exhibits a maximum GMI ratio of ~ 45%. X-ray diffraction studies show that as-prepared Fe73.8Cu1Nb3.1Si13B9.1 microwires exhibiting a high GMI ratio in fact have a nanocrystalline structure, although as-prepared Fe70.8Cu1Nb3.1Si14.5B10.6 microwires with a low GMI effect are amorphous.

Studies of magnetic properties of FINEMET-type FeCuNbSiB microwires reveal that annealing considerably affects the hysteresis loops and the GMI effect of this family of microwires. In as-prepared microwires, the reduction of the ρ ratio results in the increase in coercivity. Magnetoelastic anisotropy affects the soft magnetic properties of as-prepared FeCuNbSiB microwires. We observed magnetic softening and a considerable increase in the GMI effect in FINEMET-type FeCuNbSiB with a nanocrystalline structure, even in as-prepared microwires. After adequate annealing of FINEMET-type microwires, we observed a GMI ratio of ~ 100%. The nanocrystallization of FeCuNbSiB microwires is a key for optimizing the GMI effect.
8.3 Fast domain wall dynamics in thin wires
As mentioned in Section 8.1, the rectangular hysteresis loop typical of positive magnetostriction compositions was interpreted in terms of nucleation or depinning of the reversed domains inside the internal single domain and the consequent domain wall propagation (Zhukov, 2001; Zhukov and Zhukova, 2009; Varga et al., 2007, 2008). The perfectly rectangular shape of the hysteresis loop has been related to a very high velocity of such domain wall propagation. A few methods show that the remagnetization process of such a magnetic microwire starts from the ends of the sample as a consequence of the domain walls being depinned and the subsequent domain wall propagation from the closure domains (Zhukov, 2001).
Consequently, amorphous, glass-coated microwires with a positive magnetostriction constant are a unique material allowing for the study of the magnetization dynamics of a single domain wall in a cylindrical micrometric wire. This peculiar magnetization switching is related to their domain structure, which is determined by stress distribution during the rapid solidification fabrication process (Vazquez et al., 2011; Zhukov, 2001; Zhukov and Zhukova, 2009; Varga et al., 2007, 2008). The magnetization switching is therefore related to the propagation of the single head-to-head domain wall along the wire.
It is worth mentioning that controllable and fast domain wall propagation recently observed in various families of thin magnetic wires prepared by different methods has been proposed for information storage, magnetic sensors, and logics (Allwood et al., 2005; Hayashi et al., 2006). A rather fast domain wall velocity—usually exceeding 1000 m/s—has been reported for amorphous micrometric wires with a cylindrical cross section and a positive magnetostriction constant (Varga et al., 2007, 2008).
We previously showed that the magnetoelastic energy considerably affects the magnetic properties and GMI effect of glass-coated microwires. This magnetoelastic anisotropy has various origins. Like conventional amorphous wires, solidification of glass-coated microwires starts from the surface and progressively extends inside the metallic nucleus (Zhukov and Zhukova, 2009; Chiriac and Ovari, 1996). The most considerable difference from other amorphous materials, however, is related to the composite character of glass-coated microwires. Simultaneous rapid quenching of the metallic nucleus inside the glass coating produces additional and the strongest internal stresses (Velázquez et al., 1996).
On the other hand, the composite character of glass-coated microwires affects magnetic properties, mostly through the internal stresses induced by the glass coating (Zhukov et al., 2014a). The origin and features of these stresses are described in Section 8.1 (Velázquez et al., 1996; Chiriac et al., 2003; Antonov et al., 2000).
In this section, we provide an overview of only a few concrete topics related to domain wall propagation in glass-coated microwires because this phenomena is described in the other chapter of this book (Chapter 12).
8.3.1 Effect of magnetoelastic anisotropy
The perfectly rectangular shape of the hysteresis loop observed in Fe-rich microwires has been related to the very high speed of domain wall propagation. A few methods demonstrate that the remagnetization process of such magnetic microwires starts from the ends of the sample as a consequence of the domain walls being depinned from the closure domains and subsequent domain wall propagation from the closure domains (Ekstrom and Zhukov, 2010; Ipatov et al., 2009; Zhukov et al., 2012a,b; Vázquez et al., 2012). The magnetization process runs in an axial direction through the propagation of the single head-to-head domain wall. It is worth mentioning that the micromagnetic origin of a rapidly moving head-to-head domain wall in microwires is still unclear, although there is evidence that this domain wall is relatively thick and has a complex structure (Ekstrom and Zhukov, 2010; Gudoshnikov et al., 2009).
In the case of microwires, the domain wall dynamics were measured using a modified Sixtus–Tonks technique (Sixtus and Tonks, 1932), as described recently elsewhere (Ipatov et al., 2009). Using a system consisting of three coaxial pickup coils is essential. Details about this are provided in Section 8.3.2. In addition, one end of the sample is placed outside the solenoid to ensure domain wall nucleation always occurs near one of the microwire ends. In this way, contrary to classical Sixtus–Tonks experiments, the nucleation coils are not needed to nucleate the domain wall because the closure domain wall already exists.
As described above, a characteristic feature of microwires is the additional magnetoelastic anisotropy that considerably affects the soft magnetic properties of glass-coated microwires. Consequently, considerable attention has been paid to the effect of magnetoelastic anisotropy on domain wall dynamics in amorphous, magnetically bistable microwires (Zhukov et al., 2012a,b).
The magnetoelastic energy given by Eq. (8.2) depends on the magnetostriction coefficient and on the value of internal stress. It is worth mentioning that the magnetostriction constant λs in a (CoxFe1 − x)75Si15B10 system changes with x, from − 5 × 10− 6 at x = 1 to λs ≈ 35 × 10− 6 at x ≈ 0.2 (Konno and Mohri, 1989). Therefore, by producing microwires with various Fe-/Co-rich compositions, we were able to change the magnetostriction constant from λs ≈ 35 × 10− 6 for Fe-rich compositions (Fe72.75Co2.25B15Si10 and Fe70B15Si10C5) to λs ≈ 10− 7 for a Co56Fe8Ni10Si10B16 microwire. In addition, within each metallic nucleus composition we also produced microwires with different ratios of metallic nucleus diameter and total diameter D, that is, with different ratios ρ = d/D. Because the strength of internal stresses is determined by ratio ρ, this allowed us to control residual stresses. In this way the effect of the magnetoelastic contribution on domain wall dynamics has been experimentally studied, controlling the magnetostriction constant and applied and/or residual stresses.
It is usually assumed that a domain wall propagates along the wire with a velocity:
where S is the domain wall mobility, H is the axial magnetic field, and H0 is the critical propagation field.
The dependence of domain wall velocity v on the magnetic field H for Fe16Co60Si13B11 and Co41.7Fe36.4Si10.1B11.8 amorphous microwires with the same ρ ratio is shown in Figure 8.30. In this case, because the internal stresses determined by the ρ ratio are the same, the effect of only the magnetostriction coefficient must be considered. Comparison of v(H) dependence for a Co41.7Fe36.4Si10.1B11 microwire (λs ≈ 25 × 10− 6) with that of an Fe16Co60Si13B11 microwire (λs ≈ 15 × 10− 6) allows us to deduce that a slower domain wall velocity at the same magnetic field and less domain wall mobility S are observed for a Co41.7Fe36.4Si10.1B11 microwire with a higher λs.

The dependence of domain wall velocity on the applied field for Fe55Co23B11.8Si10.1 microwires with different ratios is shown in Figure 8.31. As in Figure 8.30, at the same applied field value H, the domain wall velocity is higher for microwires with a higher ρ ratio, that is, when the internal stresses are lower.

Another way to manipulate the magnetoelastic energy is to apply stresses during measurements. Figure 8.32 shows v(H) dependences for a Co41.7Fe36.4Si10.1B11.8 microwire (ρ ≈ 0.55) measured under applied tensile stresses. A considerable decrease in domain wall velocity v at the magnetic field value H have been observed under application of stress. In addition, increasing the applied stress σa results in a decrease in the domain wall velocity (Zhukov et al., 2013).

Consequently, in low magnetostrictive Co56Fe8Ni10Si10B16 microwires, the domain wall velocity values achieved at the same values of applied field (Figure 8.33) are considerably higher (almost two times) than those observed for microwires with a higher magnetostriction constant (compare with Figures 8.30–8.32).

The domain wall dynamics in a viscous regime are determined by a mobility relation (8.11), where S is the domain wall mobility given by:
where β is the viscous damping coefficient and μ0 is the magnetic permeability of vacuum. Damping is the most relevant parameter determining the domain wall dynamics. Various contributions to viscous damping β have been considered, and two are generally accepted (Varga et al., 2006; Zhukov et al., 2013): Microeddy currents circulating near moving domain walls are the more obvious cause of damping in metals. However, the eddy current parameter βɛ is considered to be negligible in highly resistive materials such as thin amorphous microwires. The second generally accepted contribution of energy dissipation is magnetic relaxation damping βρ, which is related to the delayed rotation of electron spins. This damping is related to the Gilbert damping parameter and is inversely proportional to the domain wall width δω (Zhukov et al., 2013):
where γ is the gyromagnetic ratio, A is the exchange stiffness constant, and Kme is the magnetoelastic anisotropy energy given by Eq. (8.2). Consequently, the magnetoelastic energy can affect domain wall mobility S, as we experimentally observed in a few Co-/Fe-rich microwires.
Considering the aforementioned results, we can suggest that domain wall velocity v should decrease with stress and an increase in the magnetostriction constant, and only if the magnetoelastic energy affects the domain wall dynamics should v show an inverse square root dependence on stress or magnetostriction. Therefore, we tried to evaluate the v(σapp) dependence. An example of v(σapp) dependence obtained for Fe55Co23B11.8Si10.2 microwires (d = 13.2 μm; D = 29.6 μm) is shown in Figure 8.34a. Qualitatively, we observed a decrease in domain wall velocity v with an applied stress σapp. To evaluate whether obtained dependence v(σapp) fits the inverse square root dependence on applied stress σapp, we expressed obtained dependence as σapp(v− 2). From Figure 8.34b, we can conclude that v(σapp) dependence cannot be described by a single v(σapp− 1/2) dependence. On the other hand, at a high enough σapp, observed v(σapp) dependence probably can be fitted by two v(σapp− 1/2).

To summarize this section, we experimentally observed that manipulating the magnetoelastic energy through the application of tensile stress and changing the magnetostriction constant and internal stresses of studied microwires, we significantly affected the domain wall dynamics in magnetically bistable microwires. Considering this, we assume that to achieve a faster domain wall propagation velocity at the same magnetic field and enhanced domain wall mobility, special attention should be paid to decreasing the magnetoelastic energy.
8.3.2 Role of defects
Microwires (like any materials) present various kinds of defects. The presence of defects can be detected indirectly through measurements of the local nucleation fields of reversed domains, as well as directly using optical and electron microscopy (Zhukov et al., 2014b).
Considering a number of unusual effects found while studying domain wall propagation in amorphous microwires, we tried to reveal the contribution of local defects to peculiarities of domain wall propagation and the correlation of the linearity of v(H) dependence with defects existing in amorphous microwires. A comparative study of single domain wall dynamics and local nucleation fields in Fe-rich amorphous, glass-coated microwires was performed (Ipatov et al., 2008b, 2009).
To detect the possible nucleation and subsequent propagation of several domain walls, the setup using three pickup coils, described above, was used. To measure local nucleation fields, a special setup was developed (Ipatov et al., 2008b). To create a reversal domain with opposite magnetization far from the wire ends, a short microcoil that produces a magnetic field strong enough to nucleate a reversed domain has been used. Thus, a pair of head-to-head and tail-to-tail domain walls can be created in a controllable manner, avoiding the nucleation of domain walls at the wire end, as usually occurs in experiments. The magnetic field necessary for nucleation of the reversed domain gives a local value of the wire nucleation field at various points along the wire length. These measurements can be made under applied tension stress created by a small load attached to the bottom end of the wire (Ipatov et al., 2008b). In this way, the remagnetization dynamics in magnetically bistable Fe-rich microwires have been studied.
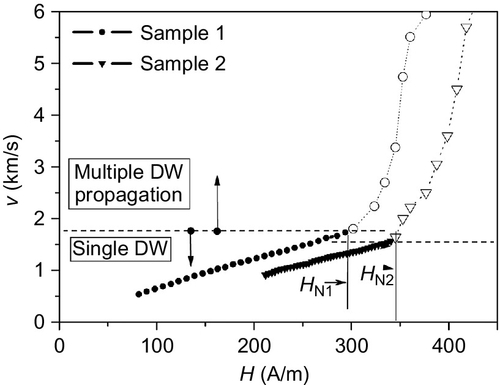
The distributions of the HN(x) for Fe-rich samples are shown in Figure 8.35. A number of dip holes on HN(x) curves for both samples have been previously attributed to the positions of localized defects existing within the microwire (Ipatov et al., 2008b). The overall minimum HN observed for both microwires from HN(x) has been compared with the v(H) dependence of the same samples. Figure 8.36 shows the measured dependence of domain wall velocity on the applied magnetic field in the same bistable, Fe-rich, amorphous, glass-coated microwires. The linear v(H) regime has been observed in both samples up to 294 and 340 A/m for samples 1 and 2, respectively. The domain wall mobility S of ~ 5 m2/As and a maximum domain wall velocity v of 1.7 km/s have been observed. The mechanism of such ultrafast magnetization switching in the second regime of the sample magnetization reversal is considered below in detail. It was assumed that such a drastic change in the remagnetization process and deviation from linear v(H) dependence is caused by possible nucleation and the consequent growth of an additional reversed domain with the lowest local nucleation field HN. This new reverse domain can be located at any place inside the sample (Ipatov et al., 2009).

Considering the aforementioned details, it was assumed that when the applied magnetic field has reached HN, the new domain is nucleated and two more domain walls start to propagate toward the wire’s ends. As noted above, in such a situation it is not possible to measure correctly a single domain wall’s velocity, and we can consider only the effective domain wall velocity.
Consequently, the existence of defects can lead to considerable acceleration of the microwire remagnetization process. On the other hand, neglecting this factor can result in exaggerated estimation of domain wall velocity from Sixtus–Tonks experiments when using just two pickup coils. Therefore, at a magnetic field above the HN, the contribution of defects can be essential. The appearance of these additional domains at H > HN can accelerate remagnetization switching, resulting in a faster effective domain wall velocity.
The essence of this process is clearly shown in Figure 8.37. There the left front of the propagating head-to-head domain wall dw2 moves toward dw1. These two reversed domains finally clamp and the right front dw3 becomes unique. This process, which can be nominated as tandem remagnetization, obviously results in a significant decrease of the magnetization switching time and acceleration of magnetization switching in magnetically bistable microwires. The proposed mechanism of ultrafast magnetization switching can explain the nonlinearity of v(H) dependence and ultrafast domain wall propagation reported in magnetically bistable microwires (Ipatov et al., 2009).

A local nucleation field is typical, describing the defects distribution in a given sample. Figure 8.38 shows the distribution of the local nucleation fields HN along the sample length x, measured using a short, movable magnetizing coil placed far from the sample’s ends and moving in the opposite directions. To distinguish the microwire’s ends, we have marked one as “end 1” and other as “end 2.” The black solid line shows the distribution of the local nucleation fields measured by moving a short magnetization coil between end 1 and end 2. The red dotted line indicates the movement in the opposite direction. As we can observe in Figure 8.38, the nucleation field near the wire’s ends is considerably smaller. This characteristic feature is responsible for the origin of a large Barkhausen jump, which occurs when fast switching of the magnetization runs by depinning and consequent fast domain wall propagation from one of the wire ends. Based on the HN(x) distributions, one can also see that the dip holes keep the same position, moving the short magnetizing coil from end 1 to end 2 and back, that is, this nucleation field profile is specific for a given microwire sample.

Figure 8.39 demonstrates a correlation between the HN(x) and domain wall dynamics in an Fe74B13Si11C2 microwire. Figure 8.39a shows HN(x) dependence. The deepest minimum is observed between pickup coils 1 and 2 at HN ≈ 170 A/m. Figure 8.39b represents the dependence of domain wall velocity v on the applied magnetic field H, measured by a pair of coils 1–2 (v1–2) and 2–3 (v2–3). These dependences exhibit a significant difference: both v1–2(H) and v2–3(H) at low fields show linear growth with H, but at H ≈ 190 A/m we observed an abrupt jump on v1–2(H), while v2–3 continued growing with H. The field of jump on v1–2(H) corresponds to the minimum nucleation field HN ≈ 170 A/m observed in Figure 8.39b.

Consequently, the microwire’s inhomogeneities sufficiently affect the remagnetization process (Ipatov et al., 2009; Zhukova et al., 2014), as was observed through the measurement of the distribution of the local nucleation field HN along the sample length L. The origin of the defects might be related to stress inhomogeneities, shape irregularities, or oxides. It is assumed that at least some of these defects might have a magnetoelastic origin and therefore might be affected by a heat treatment.
8.3.3 Manipulation of domain wall dynamics
Considering various ways to achieve a higher domain wall velocity in microwires, we can assume that at least some of the defects might have a magnetoelastic origin and therefore might be affected by heat treatment. The effect of annealing on domain wall dynamics, coercivity, and local nucleation field distributions has recently been reported (Chichay et al., 2013).
Dependence of the coercivity Hc on annealing time tann for an Fe74B13Si11C2 microwire measured at two different temperatures Tann is shown in Figure 8.40. The considerable difference in Hc(tann) at Tann = 250 and 300 °C observed in the Fe74B13Si11C2 microwire might be explained by considering the main contribution of stress relaxation at lower Tann and tann, as well as the increasing influence of the first crystallization processes at a higher Tann and an elevated tann.

The dependence of domain wall velocity between coils 2–3 (V2–3) for the Fe66.7Cr11.4B12Si9Ni0.9 microwires, and between coils 1–3 (V1–3) for the Fe74B13Si11C2 microwires are presented in Figure 8.41. We observed a typical, almost linear v(H) dependence in both as-prepared samples. After heat treatments at both temperatures, we observed an extension of the magnetic field range, where linear v(H) dependence takes place (corresponding to a single domain wall propagation regime) and the domain wall velocity increases. At the longest annealing time (> 120 min) both parameters (domain wall velocity and range of magnetic field for linear v(H) dependence) are almost insensible on tann, exhibiting a tendency toward saturation.

Dependence of the domain wall velocity value measured at the same magnetic field after different heat treatments as a function of annealing time is presented in Figure 8.42a and b. We can observe a clear tendency of increasing domain wall velocity with an increase in tann at fixed H values. The increase in the velocity observed in the Fe66.7Cr11.4B12Si9Ni0.9 sample annealed at Tann = 250 °C (Figure 8.42a) is less pronounced when compared with the Fe74B13Si11C2 microwire annealed at Tann = 300 °C (Figure 8.42b). Moreover, for the as-prepared samples, the difference for the velocities V1–2, V2–3, and V1–3 is larger than that of annealed samples with different tann values. Local nucleation field distributions in as-prepared and annealed (Tann = 250 °C for tann = 150 min) Fe66.7Cr11.4B12Si9Ni0.9 microwires, as well as in as-prepared and annealed (Tann = 300 °C) Fe74B13Si11C2 microwires, are shown in Figure 8.43a and b. As can be appreciated in these images, a decrease in oscillation amplitudes in HN(L) dependence takes place after annealing. Observed decreases in the amplitude of local nucleation fields, an increase in domain wall velocity, and extension of the magnetic field range of a single domain wall propagation regime could be attributed to stress relaxation after annealing.


Consequently, we can assume that at least some of the samples’ inhomogeneities that can be observed through the oscillations of the local nucleation fields and limiting single domain wall regime have an origin related to inhomogeneities in the internal stress distribution. In addition, based on the results presented above, we may assume two possible mechanisms influencing the defects on domain wall dynamics: domain wall nucleation and the pinning of propagating domain wall. Annealing of microwires, giving rise to internal stress relaxation and/or the release of some defect, can enhance the domain wall velocity at a given magnetic field, as well as allow the range of magnetic fields in which a single domain wall propagation takes place to be extended.
It is worth mentioning that application of a transverse magnetic field can enhance the domain wall velocity (Zhukova et al., 2009b). On the other hand, by moving the sample with the holder inside the magnetization coil and/or applying the bias field at different angles with respect to the wire axis, domain wall propagation from the opposite end of the microwire can be activated and the domain wall collision can be observed. Examples of the manipulation of domain wall dynamics are presented in Figure 8.44, where a temporal dependence of the voltage peaks in coils 1, 2, and 3 wound over a 10-cm-long wire and separated by 27 mm is seen.

As seen in Figure 8.44a–d, by changing value of Hb (and, consequently, the axial Hb projection), we can activate in a controllable way the domain wall propagation from the opposite end of the sample and realize a domain wall collision at various locations in the sample. If this collision takes place in the vicinity of a pickup coil, an increase in the voltage peak amplitude will be observed. Consequently, we are able to engineer domain wall collisions between two moving domain walls in different places on the magnetic microwire by controlling an applied bias field. Manipulating the bias field enables the release of the domain walls at targeted locations along the microwire.
Analyzing the data in Figure 8.44c, we find that at Hb ≈ 252 A/m, the domain wall collision takes place near the position of the second coil. In this case, the height of the signal from coil 2 drastically increases (Figure 8.44b and c). In addition, when the Hb value is high enough, the domain wall from the opposite end of the sample and the domain wall propagating from the nearest end of the sample arrive at coil 1 simultaneously (Figure 8.44d). In this case we observed the domain wall collision by coil 1 (Figure 8.44d).
To summarize, annealing of microwires allows the magnetoelastic anisotropy of glass-coated microwires to be manipulated and therefore enhances the domain wall velocity by extending the field range for single domain wall propagation, as well as enhancing domain wall velocity at a given magnetic field through internal stress relaxation. The correlation between the annealing influence on the local nucleation field distribution and a change in the magnetic field dependence of domain wall velocity have been observed in amorphous Fe-based microwires with two different compositions and geometric parameters. Consequently, the nature of local defects limiting the single domain wall propagation regime and damping the domain wall might be related to the internal stress distribution.
Under certain experimental conditions, manipulating the domain wall dynamics in a magnetic wire in a field-driven regime and observing controllable domain wall collisions are possible. This controllable domain wall collision can be realized in different parts of the wire. Such domain wall collisions can be used to release pinned domain walls with weak external fields. The control of domain wall dynamics is essential for advanced racetrack memory devices.