
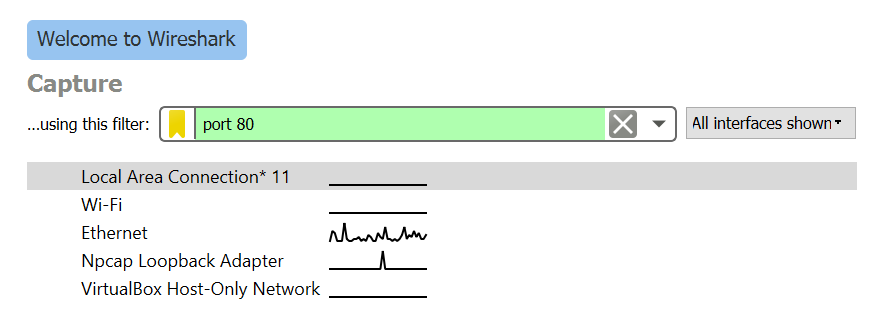
The interaction between the client and server through the exchange of network packets can be analyzed using any network-packet-capturing tool, such as Wireshark. You can configure Wireshark to filter packets by port or host. In this case, we can filter by port 80. You can get the options under the Capture | Options menu and type port 80 in the input box next to the Capture Filter option, as shown in the following screenshot:
In the Interface option, we choose to capture packets that are passing through any interface. Now, run the preceding TCP client to connect to www.yahoo.com. The first three packets establish the TCP connection by a three-way handshake between the client and server. You can see the sequence of packets being exchanged in Wireshark:

As you can see, the HTTP GET request has other components, such as Request URI and Request Version. Now, you can check the HTTP response from the web server to your client. It comes after the TCP acknowledgment packet, that is, the sixth packet. Here, the server typically sends an HTTP response code (in this case, the response is 200 ok), content length, and the data or web page content. The structure of this packet is shown in the following screenshot:

From the preceding analysis of the interaction between the client and server, you can now understand, at a basic level, what happens behind the scenes when you visit a web page using your web browser. In the next section, you will be shown how to create your own TCP server and examine the interactions between your personal TCP client and server.
In this section, we introduced socket concepts and reviewed practical use cases with the Python socket module, such as creating a TCP client, banner grabbing, and port scanning. We also reviewed how to inspect the client and server's communication with Wireshark.