

260 IBM Cognos Dynamic Cubes
Set preferences for logging folder URI
If query execution logs are to be accessed through a web server (rather than the file system)
enter the URL details from which logs can be accessed:
1. Select Logs from the Preferences navigation pane (Figure 10-2). If the preferences pane
is closed, open the Preferences dialog and select Window Preferences from the
Dynamic Query Analyzer menu.
2. Enter the log folder URL. Your Cognos system administrator can provide details for how to
use and connect remotely to the Cognos Server dynamic query mode logs directory.
3. Enter Name and Password details provided by your administrator if authorization is
required to access the logs directory through a web connection.
4. Select Apply to save your configuration.
5. Select OK to close the Preferences window.
Figure 10-2 Set Dynamic Query Analyzer logs folder URL preferences
10.1.3 Query execution tracing
To gather log and trace information for exploration in Dynamic Query Analyzer, enable query
execution tracing.
Query execution tracing can be enabled for all requests to a designated Dynamic Query
Mode (QueryService). This trace is configured from within Cognos Connection. Appropriate
system administration privileges are required to enable query execution. Query execution
tracing for an individual report can also be enabled in Dynamic Query Analyzer.
Chapter 10. Troubleshooting 261
Enable server query execution tracing
Use the following procedure to enable query execution for a target QueryService, tracing all
requests including cube startup:
1. Open Cognos Connection.
2. Click the Launch Menu and select IBM Cognos Administration.
If IBM Cognos Administration is not available as an option from the Launch menu, and
you believe you should have access to Cognos system administration functionality, contact
your Cognos systems administration team.
3. Select Status.
4. Select System.
5. Select the Cognos Server and dispatcher that is running Cognos Dynamic Query Mode
(QueryService) and dynamic cube you are targeting for query execution tracing.
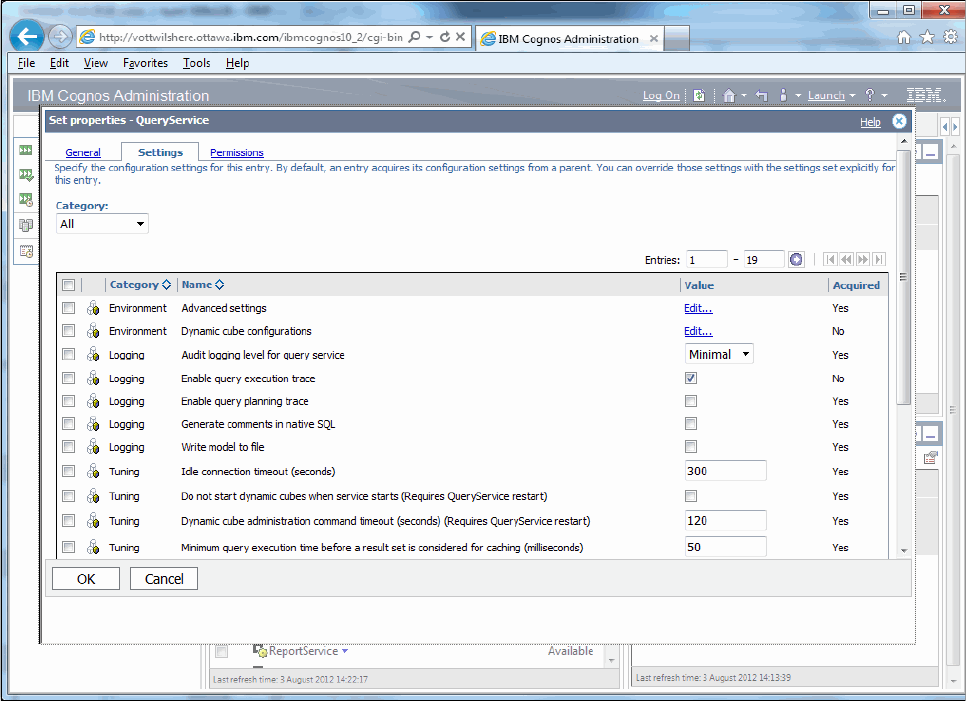
6. Select QueryService.
7. Select Set properties from the QueryService context menu.
8. Select the Settings tab.
9. Select the check box in the Value column for Enable query execution trace to establish
server based query execution tracing. See Figure 10-3.
10.Click OK to enable tracing and return to Cognos Connection.
Figure 10-3 Enable QueryService query execution tracing

262 IBM Cognos Dynamic Cubes
Disable server query execution tracing
Disable server query execution tracing as follows:
1. Deselect the check box for the Enable query execution trace property.
2. Click OK to disable tracing and return to Cognos Connection.
Enable Dynamic Query Analyzer query execution tracing
To help you with troubleshooting, Dynamic Query Analyzer provides the option to enable
query execution tracing for reports that are run in the Dynamic Query Analyzer interface. To
enable query execution tracing for a report run from Dynamic Query Analyzer, use the
following steps. If server-based query execution tracing is inactive, only those reports that are
run from Dynamic Query Analyzer will produce query execution logging.
1. Launch IBM Cognos Dynamic Query Analyzer.
2. Select Windows Preferences.
3. Select General from the Preferences navigation pane (Figure 10-4).
4. Select Query execution trace.
5. Set the logging level.
6. Click OK to apply changes and close the Preferences dialog.
Figure 10-4 Set DQA query execution tracing
Disable Dynamic Query Analyzer query execution tracing
Disable query execution tracing as follows:
1. Deselect the Query execution trace check box.
2. Click OK to disable tracing and close the Preferences dialog.
Note: Query execution tracing is enabled by default within Dynamic Query Analyzer.
..................Content has been hidden....................
You can't read the all page of ebook, please click here login for view all page.