226 IBM Cognos Dynamic Cubes
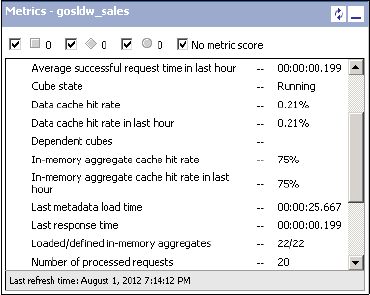
Figure 8-21 is an example of the gosldw_sales metrics that shows in-memory aggregate
cache hit rate.
Figure 8-21 Example of the gosldw_sales metrics that shows in-memory aggregate cache hit rate
8.4.4 In-memory aggregate tips and troubleshooting
This section provides tips and troubleshooting information for in-memory aggregates.
System considerations
You must consider several cube and system settings when you use in-memory aggregates.
Aggregate cache size
Hardware sizing and guidelines for the amount of memory to use for a cube’s in-memory
aggregate cache are in the Understanding Hardware Requirements for Cognos Dynamic
Cubes document, which you can find on the business analytics proven practices website:
https://www.ibm.com/developerworks/analytics/practices.html
The size of the aggregate cache that is specified in the properties of a dynamic cube is simply
a maximum. Setting the value to a very large number does not increase or waste memory.
Only enough memory that is required to hold the defined aggregates is used. For example,
if 90 MB can hold the aggregates for gosldw_sales, and the aggregate cache size is set to
1 GB, only 90 MB of memory is used. Over time, if the underlying fact tables grow, the
aggregates are allowed to grow to the specified maximum of 1 GB.
You should not use more than 30 GB for the aggregate cache. Although the QueryService
system might have enough physical memory, the number of objects that are created by the
large in-memory aggregates can affect the system resources and result in overall degraded
performance.
Data cache size
The data cache is still used, even with the presence of in-memory aggregates. If a query is at
a higher level of aggregation than the in-memory aggregate, the values in the in-memory
aggregate are used to calculate the requested value. After the calculation is done by using
the in-memory aggregate values, it is then stored in the data cache for future use. Therefore,
you should provide a sufficient amount of memory for the data cache, even with using the
in-memory aggregate cache.
JVM considerations
If the JVM garbage collection options are adjusted, be aware that all the memory that is used
by the in-memory aggregate cache will be an object with a long lifespan. This means that for

Chapter 8. Optimization and performance tuning 227
generational concurrent (gencon) garbage collection policies, the administrator should
account for enough tenured space to hold the long-lived memory objects of the in-memory
aggregate cache.
Underlying database resources
See 8.4.2, “Loading in-memory aggregates into the aggregate cache” on page 221 for
underlying database considerations that the DBA should be aware of in terms of database
resources when in-memory aggregates are loaded.
Troubleshooting
This section describes several common in-memory aggregates issues you might encounter,
how to identify the cause, and how to resolve the issue.
In-memory aggregates are not loading
The most common reason why in-memory aggregates are not loaded is that cube
configuration property for the amount of memory to use for the aggregate cache is set to zero,
which disables the aggregate cache. If this is the case, a message that describes the situation
will be available in the View recent messages dialog list for the cube.
Figure 8-22 shows the dialog and why in-memory aggregates were not loaded.
Figure 8-22 View recent messages for gosldw_sales, showing why in-memory aggregates were not
loaded
Another common reason why the aggregates are not loading is that the cube configuration
was updated or the in-memory aggregates were saved immediately before initiating a
cube-start or restart. In this case, wait a few minutes for the updates to the Content Store
(that is, the cube configuration and the in-memory aggregate definitions) to be refreshed and
available to the QueryService before attempting to start the cube.
Incorrect data values
The first step in troubleshooting a potential in-memory aggregate query problem is to
determine whether the problem is because of the aggregates. Disable the aggregate cache
and rerun the scenario without the in-memory aggregates to see if the correct data values are
returned. To disable the aggregate cache, set the Maximum amount of memory to use for
aggregate cache property in the cube configuration to zero. Restart the cube for the updated
setting to take effect. Although in-memory aggregates may be defined and associated with
the cube, they will not be loaded.
If the values that are calculated from the in-memory aggregates are smaller than the
aggregation of the actual underlying database values, it might be a sign of referential integrity
problems in the data. For more information, see Cognos Dynamic Cubes User Guide, v10.2.0
at the following website:
http://pic.dhe.ibm.com/infocenter/cbi/v10r2m0/nav/5_6

228 IBM Cognos Dynamic Cubes
In that guide, see the Cognos Dynamic Cubes overview topic, the section about Referential
integrity in data warehouses. It describes a set of queries to run to identify when referential
integrity issues occur.
Using the DQM server log to understand in-memory aggregate processing
This section describes advanced troubleshooting techniques by using more verbose logging
levels and examining the DQM server log.
To generate some insight about what in-memory aggregates are selected and what happens
when processing a query against an in-memory aggregate, enable the logging event group
specifically for the aggregate cache-related activity:
1. On the QueryService system, edit the DQM logging configuration, which is located relative
to the server installation directory:
configurationxqe.diagnosticlogging.xml
2. Edit the aggregate cache event group to log level of info:
<eventGroup name="ROLAPCubes.AggregateCache" level="info"/>
3. Edit the query performance event group to log level of info:
<eventGroup name="ROLAPQuery.Performance" level="info"/>
4. Save the xqe.diagnosticlogging.xml file.
5. Restart the QueryService for the logging level changes to take effect.
6. Start the cube.
7. After the in-memory aggregates complete loading, run the problem query.
8. By default, the DQM server log is written to a file, which is located relative to the server
installation directory:
logsXQExqelog-<timestamp>.xml
When troubleshooting, by using the DQM server log, is complete, revert the changes to
the log levels in the xqe.diagnosticlogging.xml file and restart the QueryService for the
changes to take effect.
Open the DQM server log to verify that the following steps occur when processing a query in
the aggregate cache:
? Score in-memory aggregates and select one.
The requested members of the query are inspected to see whether there is an in-memory
aggregate that can be used to solve the query. Each aggregate is internally scored based
on how close to the user-requested query it is, and the aggregate with the best score is
selected. The closer to the user-requested query the aggregate is, the better the score.
For example, if the query is for [Retailers].[Americas], then an aggregate on
[Retailers].[Retailer Country] will score better than an aggregate on
[Retailers].[Retailer name]. This log entry is shown in Example 8-1.
Example 8-1 Log entry
<event ...><![CDATA[Aggregate [aggregate_memory_1] selected with cost
85596.0]]></event>
? Determine whether the query is a direct hit for the selected aggregate.
If the levels in the query match all the levels in the aggregate, it is considered a direct hit
and it is routed directly to the aggregate cache. A direct hit has a score cost of 1.0.

Chapter 8. Optimization and performance tuning 229
? Fetch values from the selected aggregate for rollups if not a direct hit.
If the query is not a direct hit, then roll ups are needed and processing continues. The
query is inspected to see what values are needed from the aggregate. A portion of the
query is issued against the aggregate to fetch the needed values.
For example, if the query is for [Retailers].[Americas] and the aggregate on
[Retailers].[Retailer Country], then the aggregate query will request values for every
country in the Americas. The fetch time is also recorded because many values might be
needed. This the log entry is shown in Example 8-2.
Example 8-2 Log entry
<event ...><![CDATA[Fetched 24,088 tuples in 549ms.]]></event>
? Process the aggregate values in multiple threads.
After the values are fetched from the aggregate, they are inspected to determine how
many values there are and how much work processing might be. This step determines
whether the processing is split into multiple subtasks that will execute in parallel. The
number of available threads is also accounted for, so a busy system will result in splitting
the processing into fewer subtasks.
Also, a calculation modifier value accounts for how many locations each aggregate cell
belongs to. Consider an example query that requests [Retailers].[Americas],
[Retailers].[Americas].[United States] and [Retailers].[Americas].[United
States].[Outdoor Gear Co-op]. The value for [Outdoor Gear Co-op] can be in, or
contribute to, three locations: itself, as part of [United States], and also as part of
[Americas]. More locations mean more work and a larger calculation modifier.
Example 8-3 shows the log entry.
Example 8-3 Log entry
<event ...><![CDATA[Using 4 tasks to process aggregate. Total number of
aggregate cells accessed: 24088 with a calculation modifier of 4.0]]></event>
? Combine values as each processing thread completes.
Each subtask works on its set of values independently. Then, as these subtasks finish
processing, their results are combined to form the final result set.
For example, if the query is for [Retailers].[Americas] and the aggregate on
[Retailers].[Retailer name], there can be a subtask for each country, rolling up the
values for all retailers from each country independently. Then, the original task only has to
roll up the country values together. An entry for each subtask is shown in the log entry in
Example 8-4.
Example 8-4 Log entry
<event ...><![CDATA[Aggregate calc thread finished. Processed 6,022 cells.
Rollup time : 162 ms into 72 cells with 0 cells in the overfetchResultSet.
Result combination time 2ms, representing 1 calc threads. Cell cache hit
rate: 99% 99% 99% 99% 99% 99% 99% 99%]]></event>
? Query processing is complete.
After all the subtask results are combined, the final result set is returned. The log record in
Example 8-5 on page 230 signifies the end of this processing and captures some metrics.

230 IBM Cognos Dynamic Cubes
Example 8-5 Log record
<event ...><![CDATA[Finished execution of Query Strategy for report unknown
Requested 72 tuples
Found 0 tuples in data cache
Found 0 tuples in aggregate cubes
Fetched 0 tuples from database
0 of the tuples were from pushdown queries
Created 72 tuples from the aggregate cache
Total time processing aggregates : 774 (ms) using 4 tasks
24088 aggregate cells rolled up into 8 separate locations
If the query was not a direct hit and involved rolling up values, then those rolled up values are
put into the data cache asynchronously. Direct hit values that did not require rolling up are not
put into the data cache to prevent duplicating values in the caches and save memory usage.
Using the DQM server log to troubleshoot incorrect data values from
in-memory aggregate processing
This section describes advanced troubleshooting techniques using trace logging levels and
examining the DQM server log.
First, see the following sections to determine whether the incorrect values are the result of the
in-memory aggregates:
? “Incorrect data values” on page 227
? “Using the DQM server log to understand in-memory aggregate processing” on page 228
Next, if they are, use informational log entries to determine whether the appropriate
aggregate was selected.
Finally, if more information is needed to assess the issue, enable the logging event group
specifically for the aggregate cache-related activity and increase the log level to trace:
1. On the QueryService system, edit the DQM logging configuration, which is located relative
to the server installation directory:
configurationxqe.diagnosticlogging.xml
2. Edit the aggregate cache event group to log level of trace:
<eventGroup name="ROLAPCubes.AggregateCache" level="trace"/>
3. Edit the query performance event group to log level of info:
<eventGroup name="ROLAPQuery.Performance" level="info"/>
4. Save the xqe.diagnosticlogging.xml file.
5. Restart the QueryService for the logging level changes to take effect.
6. Start the cube.
7. After the in-memory aggregates complete loading, run the problem query.
8. By default, the DQM server log is written to a file that is in a location relative to the server
installation directory:
logsXQExqelog-<timestamp>.xml
After the problem query has been captured, revert the changes to the log levels in the
xqe.diagnosticlogging.xml file and restart the QueryService for the changes to take
effect.
..................Content has been hidden....................
You can't read the all page of ebook, please click here login for view all page.