Chapter 15

SketchUp for Geoscientists
John Lang is a Geoscience Information Specialist, with a BSc Geology (1980) and an MSc Geographic Information (2008), based in Perth, Australia. John specializes in innovative technologies for information management and is working as a spatial data management consultant to the petroleum industry. His recent projects include 2D/3D Google-based information systems for geoscientists, engineers, and managers focused on petroleum infrastructure.
Project: Is SketchUp with ArcGIS a practical tool for geoscientists?
Tools: Google SketchUp, ArcGIS, Google Earth; Plug-ins: ArcGIS, Cloud_V6, 3DVolume, Soap Skin and Bubble, and SketchyPhysics.
This project summarizes John’s MSc thesis “Is Google™ SketchUp combined with ArcGIS a practical 3D tool for geoscientists using two case studies from Kyrgyzstan” The thesis was sponsored by Monitor Energy Ltd to enable 3D visualization of its petroleum and uranium assets in Kyrgyzstan, Central Asia. The thesis was completed in 6 months at Curtin University of Technology in Perth, West Australia, and won the 2008 Spatial Science Institute student award. The thesis has been updated to demonstrate the use of SketchUp 6/7, ESRI ArcGIS 9.2/9.3, and Google Earth 4/5 to build the 3D models for the following:
• Generic and conceptual petroleum diagrams.
• Regional petroleum basin imported from ArcGIS.
• Underground mine site from historic plans and GPS.
The results are applied to exploratory data analysis, conceptual modeling, illustrating, marketing, and exploration planning. The resulting 3D models confirm that SketchUp is powerful and simple to use, but has limitations with geographical information system (GIS) integration. SketchUp is unsuitable for volumetrics, large images, or large data sets and lacks a relational data structure. SketchUp neither is a true 3D modeling system nor has the functionality of geoscience modeling software. The SketchUp users are pushing these limitations through innovation. The results confirm that SketchUp with ArcGIS is a practical tool for geoscience education, marketing, conceptual modeling, and qualitative 3D visualization.
Project Context
The idea for the MSc thesis was a presentation of a 3D annotated sketch of potential petroleum traps. This visualization was highly effective for enhancing geological understanding of the petroleum potential. A brief Internet search suggested that millions of people were using the same software for sketching 3D models, sharing them through a 3D warehouse, and viewing them in a virtual globe. However, there was only one shared geoscience model (GeoSum3D, 2007). The lack of geoscience models contrasted with the popularity of the software and identified the topic for research. The number of users confirms the future of SketchUp, but is such a tool practical for geoscientists? The author, who is a geoscientist, identifies the following minimum requirements:
Part 1: Create generic 3D geological features.
Part 2: Create a sedimentary basin model from ArcGIS data.
Part 3: Create a 3D mine model from scanned maps and ArcGIS.
Techniques Utilized
ArcGIS/SketchUp Integration
The ArcGIS 9.2 plug-in was used for import of selected features and surfaces into SketchUp:
• Import of 2D and 3D shape files.
• Import of personal geodatabase point, line, polygon, and multipatch feature classes.
• SketchUp models were used as point marker symbols in ArcScene/ArcGIS 3D Analyst.
• Import of borehole (well) locations and borehole sections.
• Import of cross section locations and cross section images.
• Import of geological features such as formation tops, faults, folds, and unconformities.
• Import of digital elevation model (DEM) surfaces and surface images, including contours, digital elevation, and plans.
ArcGIS/SketchUp Integration Background
As the SketchUp product and users evolved to include terrain and world coordinates, importers were provided for Google Earth, GIS, and CAD. In 2005, a SketchUp 5 shape file importer was introduced, and in July 2007, an ArcGIS plug-in was released for SketchUp 6, enabling the import of selected point, line, and polygon features, and for Triangular Irregular Networks (TINs) and rasters. ArcGIS 3D Analyst/ArcScene can display SketchUp models as a 3D marker symbol for a point. The next version of the plug-in (not released yet) should contain a working SketchUp to ArcGIS multipatch exporter. An excellent set of tutorials is available on the Harvard Design School website (Cote, 2007) that demonstrates how to create a 3D model using data from ArcGIS.
New Approaches
A generic tool such as SketchUp combined with GIS has significant potential for conceptual modeling of the surface and subsurface of the earth and complements existing 3D geological modeling software. Prior to this thesis, the application of SketchUp with GIS to geological modeling had yet to be investigated.
Should creating 3D models be the role of the specialist? Since the 1990s, computerized 3D modeling of the earth has become a critical part of geology. The industry has developed specialized software, including Surpac, GOCAD, Roxar, EarthVision, Petrel, Kingdom, and GeoModeller, to create, view, and analyze 3D geological models. These modeling tools have become increasingly powerful, complex, and expensive, leaving an opening for an easy-to-use, generic tool such as SketchUp.

FIG 15.1
Part 1: Create Generic Geological Models
I used SketchUp to create conceptual petroleum trap models that combine the standard geological features, including sedimentary layers, folds, faults, unconformities, and piercements, into 3D block models. The resulting models are exported to the 3D warehouse and viewed in Google Earth and ArcGIS ArcScene.
Step 1: Create SketchUp Petroleum Trap Models
Goal: To create generic 3D petroleum trap models.
Inputs: The CCOP guidelines for risk assessment of petroleum prospects, by Kalheim, Chaisilboon, and Caluyong (2000).
Tools: SketchUp, 3D Warehouse, and Google Earth.
To test whether SketchUp could create generic geological models, I created a set of petroleum trap block models based on the CCOP guidelines. The fold trap model consists of a 200-m-thick sandstone reservoir with a 100-m-thick claystones seal and was created using the following method
• Create a square base of 2000 m × 2000 m (VCB 2000,20000).
• Create a line curve representing the fold (or use shapes.rb to create a 3D dome).
• Copy the curve at 100-m intervals to create folds (VCB 100 × 4).

FIG 15.2

FIG 15.3
• Delete one curve to make a 200-m-thick sand.
• Draw two straight lines from the curve to the square base to create a face.
• Push–Pull (Copy) the face 2000 m to create the lower surface.
• Repeat for the next three surfaces, draw lines, and push–pull.
• Draw a line to create the oil and the face of the block model.
• Push–Pull (Copy) the oil and the face of the block model.
• Use materials to color the model.
• Add a 3D grid using the Ruby script Grid3d.rb or mesh_additions.rb.
• Add a dimension to the grid.
• Import a map compass from the 3D warehouse.
Step 2: Publish the Models for Visualization in Google Earth
Goals: To publish petroleum models.
Inputs: Generic petroleum models.
Tools: SketchUp, 3D Warehouse, and Google Earth.
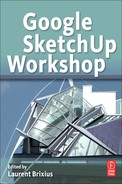
The aim was to enable potential partners to visualize where the potential petroleum traps were in Monitor Energy’s Kyrgyzstan exploration permits using Google Earth. This involved adding the World Geodetic System 1984 (WGS84) latitude and longitude coordinates of the location and the north direction of the model by typing the coordinates in the Model Info > Location (See Figure 15.4). The resulting models were exported from SketchUp using File > Export > 3D Model into kmz format and viewed in Google Earth.
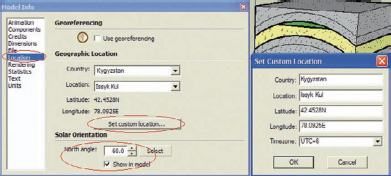
FIG 15.4
I published the resulting models in the 3D warehouse under the collection Geology 3D petroleum models under my user name “dinosur” (http://groups.google.com/group/geology-3d-petroleum-models).

FIG 15.5
Step 3: SketchUp Models in ArcGIS
Goal: To publish petroleum models in ArcGIS 3D analyst/ArcScene.
Inputs: SketchUp petroleum models, and Shape file of X and Y coordinates.
Tools: ArcGIS 3D Analyst and SketchUp Pro.
ArcGIS is the most widely used GIS software for the petroleum industry. Unlike Google Earth, the ArcGIS extension 3D analyst can place 3D objects below the earth’s surface. I installed the ArcGIS 9.2/SketchUp Pro importer/exporter (http://sketchup.google.com/download/plugins.html#arcgis) plug-in, which adds a button to ArcGIS, which enables the use of SketchUp models as symbols for point feature classes in an ArcScene model, using the Import button.
I created an ArcGIS 3D point feature class and located the SketchUp models in the ArcScene document (See Figure 15.7). When time permits, I will investigate this method further as groups like The University of West Virginia have created an immersive 3D ArcGIS ArcScene/SketchUp virtual reality model of Morganstown village (http://humanitiesgis.org/projects/virtualmotown/index.html).
Step 4: Visualize Drilling and Production
Goal: To create a realistic directional drilling program visualization.
Inputs: Example directional drilling program and generic trap model.
Tool: SketchUp Pro.
FIG 15.6

FIG 15.7
This step required the design of a drilling rig, platform, and drilling program that intersected the reservoir created from the previous steps. At work, I successfully created a platform from an imported AutoCAD model supplied by Worley; however, due to copyright reasons for this example, I created a simple jackup rig and production platform based on my previous work experience. It is available in the 3D warehouse as “Oil and Gas Production platform” by the user “dinosur”. Using the Scale tool, I resized the drilling program to intersect the oil-bearing sand (green) to demonstrate how a geoscientist would effectively produce a sand of this geometry.


FIG 15.9
Part 2: Create a Sedimentary Basin Model
Monitor Energy Ltd owns the At Bashi petroleum exploration license in Kyrgyzstan. The license covers a large underexplored basin surrounded by mountains. After the success of the generic geology models, a good case study was the import of ArcGIS data into SketchUp to create a 3D geological model of the At Bashi basin.

FIG 15.10
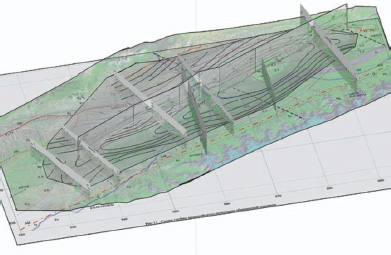
FIG 15.11
Step 5: SketchUp Import of ArcGIS Points and Lines
Goal: To import ArcGIS shape files and feature classes.
Inputs: ArcGIS point and lines.
Tools: ArcGIS, ArcGIS 9.2 SketchUp Plug-in, and SketchUp Pro.
ArcGIS features can be imported into SketchUp in two ways. Prior to June 2007, the shape file importer for SketchUp 5 was used to import all the features in a point, line, or polygon feature class. This method is effective and is documented in detail on the Harvard Graduate School of design website (http://www.gsd.harvard.edu/gis/manual/arcgis2sku_fp/index.htm) and is not repeated here. In June 2007, Google released a Beta ArcGIS 9.2/SketchUp 6 Pro importer/exporter (http://sketchup.google.com/download/plugins.html#arcgis) that supported the import of multiple selected 2D and 3D features from an ArcGIS map document and the import of TINs from ArcGIS ArcScene. This beta script appears to work with SketchUp 7, with the following major limitation: SketchUp fails to place the imported features at the correct real-world location in an existing model. The imported features would instead be centered from the maximum extent of the imported feature classes. The fundamental problem is the site-centered nature of SketchUp, which requires a model to have a center location with a WGS84 latitude and longitude and zero elevation. My solution was to select the site center at a known latitude and longitude and to create a feature class that extends equidistant in the X and Y axes beyond the extents of other feature classes.
Importing the site center feature class (shown in blue), with any import, ensures the model data remain correctly georeferenced.
Using the ArcGIS plug-in, a point, line, or polygon feature class can be exported from ArcGIS to SketchUp with an elevation z. The selected features at WGS84 X, Y, and Z locations are exported from ArcGIS with options for elevate by field and naming of groups. This method is satisfactory, but has limitations including the inability to import 2D point feature classes. It is recommended for detailed information that point and polygon features are converted into 3D features prior to export. An excellent set of 2D to 3D tools is contained within the ET Geowizards plug-in for ArcGIS, which can save the cost of ArcGIS 3D Analyst.

FIG 15.12
Step 6: SketchUp Import of ArcGIS Contours
Goal: To import ArcGIS contours to create a surface.
Inputs: ArcGIS lines and TINs.
Tools: ArcGIS, ArcGIS 9.2 SketchUp Plug-in, and SketchUp Pro.
Contours digitized in ArcGIS and imported into SketchUp can be used to create a TIN from lines of equal elevation using the Sandbox from contours tool. Invalid edge TIN lines and surfaces were deleted in SketchUp. This identified a further limitation as Sandbox was not able to create surfaces from large contour feature classes. The author suspects the same limitation as cloud6.rb, of approximately 10,000 vertices for building a TIN from contours.
Step 7: SketchUp Import of Digital Elevation Model
Goals: To import points to create a surface.
Inputs: ArcGIS points.
Tools: ArcGIS, Cloud6 plug-in, and SketchUp Pro.
ArcGIS import TIN is the simplest method to import a DEM into SketchUp; however, this requires the 3D analyst extension. An excellent alternative is to use the cloud6.rb script to import the X and Y locations and elevation into the model from an ASCII file exported from ArcGIS and then automatically create a TIN. To place the TIN at the correct location, an ArcGIS model was built, which calculated SketchUp site coordinates from Universal Transverse Mercator (UTM) Z43N coordinates by subtracting the site center locations from the UTM Z43N coordinates. This method was used to import the SRTM digital elevation model. The satellite image was used as a material to color the DEM surface.

FIG 15.13

FIG 15.14
The Cloud6.rb Ruby script was unable to import the full basin digital elevation model of 20,000 points and failed to build the TIN from the cloud after approximately 2 hours. The SRTM data were resampled to approximately 5000 points, and the import worked successfully. It appears that the upper limit for building TINs is approximately 10,000 points on the hardware used by the author. In addition, attempting to import and drape images over 4 MB could cause SketchUp to fail with a “bug splat.” The author recommends keeping images below 2 MB and TINs to below 10,000 points for speed and efficiency of the model.
Step 8: SketchUp Import of Sections, Wells, and Fields
Goal: To import points and lines to create scanned sections and well images.
Inputs: ArcGIS points.
Tools: ArcGIS, Cloud6 plug-in, and SketchUp Pro.
The ArcGIS plug-in cannot directly import a scanned cross section or image. However, by drawing the cross section as a line in ArcGIS and measuring the horizontal and vertical size of the image, a correctly scaled cross section can be imported into SketchUp. First, calculate the actual dimensions of the cross section in length (l) and height (h), and calculate the actual elevation of the top of the section. Next, draw the 2D cross section feature to the total length (l) of the cross section image and import to SketchUp using the actual elevation of the cross section. Extrude the cross section line by either using the Move/Copy tool to duplicate the feature and move it by (h) to the base elevation of the cross section, or use the Ruby script projections.rb, extrude lines along z (by Didier Bur) to create the cross section surface. The scanned image is imported as a texture and placed as a material onto the surface using l for width and h for height.
This method can be used for viewing a well log (image of the geological properties of the well) that can be viewed from any direction in the model. Using the same methodology described for importing the cross section, create a polygon or line width of the log, and extrude to the depth of the log. When finished, group the object as a component and set the properties of the component to always face the camera SketchUpWellField.

FIG 15.15
Step 9: Interpolate a Surface Between Sections
Goal: To create a realistic surface between two or more sections.
Inputs: Scanned cross sections and digitized tops.
Tools: SketchUp Pro, and Soap Skin and Bubble Plug-in.
A common requirement for geoscientists is to interpolate surfaces between digitized cross sections. The manual option is to draw lines between the cross sections until a surface is created. To simulate a more natural-looking surface, I used a soap bubble interpolation between the lines using the Soap Skin and Bubble Plug-in for SketchUp (Leibinger, 2007). This enabled pushing and pulling the structure to confirm the structural interpretation. The following workflow interpolates the top of the Paeleaozoic (Pz) between two cross sections.

FIG 15.16
Digitize the Pz horizon line on the georeferenced cross sections using the $$$Line$$$ and Arc tools. Join the ends of the lines to create a closed loop and triple-click the line to select the entire loop. Use the Skin tool to create a skin between the loops. Choose the number of vertices, and adjust the X/Y ratio to make the skin bulge or droop. The results were used to create realistic petroleum reservoirs from sections and existing interpreted contours. A good alternative is the SubdivideAndSmooth.rb, which creates organic 3D shapes from block models.
Part 3: Mine Model Using SketchUp and ArcGIS
I used SketchUp to create a 3D visualization of an abandoned mine in Kyrgyzstan from Russian plans. The aim was to validate the location of the mine within Monitor Energy Ltd’s exploration permit. The SketchUp model enabled me to communicate of ideas and concepts with the teams, provide illustrations for brochures, and ultimately to sell the prospect to investors.

Step 10: ArcGIS Export to SketchUp
Goals: To export the ArcGIS features, georeferenced maps, and sections into SketchUp.
Inputs: ArcGIS points, lines, and scanned sections.
Tools: ArcGIS, Cloud6 plug-in, and ArcGIS SketchUp plug-in.
First I use ArcGIS to create a vector map of the scanned Russian maps, including the point locations of mine shafts, mine adits and lines for contours, and mine tunnels to produce a map of the area. The SRTM data were imported into SketchUp using the cloud6.rb script, and the Google Earth image was used as a material to color the surface. The mine plans and section locations were adjusted to provide a good fit with the SRTM model.

FIG 15.18
Step 11: GPS Validation
Goal: To validate abandoned mine site with GPS.
Inputs: GPS Locations of the mine site.
Tools: GPS, ArcGIS, and Google Earth.

A field trip to Kyrgyzstan with global position sensors (GPSs) identified key features of the abandoned mine, including cemented-up shafts and open adits (mine drains). I exported the GPS locations to Google Earth to validate the adits with the topography. I then shifted the ArcGIS map and SketchUp model to match the GPS locations using the MoveIt.rb plug-in, which confirmed beyond doubt that the mine plans and sections belonged to the abandoned mine
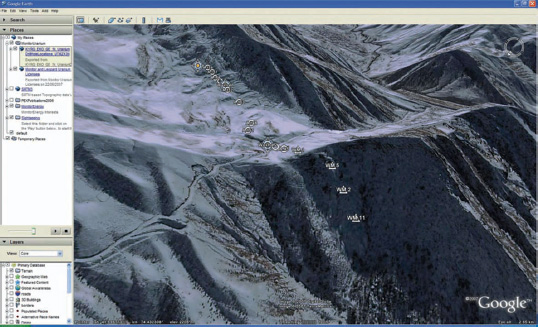
FIG 15.20
Step 12: Create a Drilling Program
Goal: To estimate the number and direction of drill holes.
Input: SketchUp model.
Tool: SketchUp Pro.
To evaluate a potential resource, the best method is to design a drilling program to sample the minerals. From the narrative of mineral thickness, I created a set of parallel polygons using the Move/Copy tool and VCB, and the layers were rotated with the Rotate tool to the correct angle and then rotated again to the correct direction to represent the mineral layers. The drilling engineer recommended an 80-m drilling grid, parallel to the mineral layers, and at approximately 60-degree inclination to intersect the minerals. One of the biggest risks is to intersect an existing mine shaft or tunnel as the drill can get stuck, causing significant loss of time and equipment. To minimize the risk of intersecting the mine tunnels, the grid of wells was shifted until no intersections were visualized using section cuts.
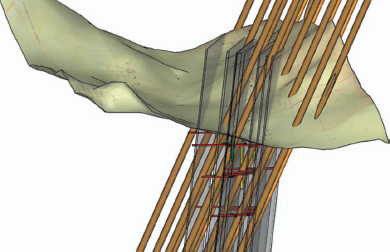
FIG 15.21
Note that Intersect with mode was not successful at identifying which drill holes intersected a tunnel.
Step 13: Pit Volume Estimation
Goal: To estimate the open cut volume for the site.
Inputs: SketchUp model and slope stability angle.
Tools: ArcGIS, SketchUp Pro, and VolumeCalculator21 plug-in.
The lowest cost method of mining is to create a pit; so, using an engineer-supplied stable slope angle, I used ArcGIS to create a set of pit contours, imported these to SketchUp, and used Sandbox to create a generic pit. Using the Intersect with Model, I intersected the pit with the surface and deleted the remainder. The VolumeCalculator21.rb was used to estimate the volume of rock required to be extracted for the minerals to be mined.

FIG 15.22
Conclusion
The author, who is a geoscientist, found SketchUp, combined with ArcGIS, a practical tool for visualization and qualitative 3D modeling of small to medium data sets. To summarize, SketchUp is recommended for geo-science 3D modeling and visualization under three or more of the following conditions:
• The data and images are of small to medium size or can be abstracted.
• The modeling is used for qualitative purposes, such as illustrative and conceptual purposes, or for the sharing of ideas.
• For shared visualization between teams or the public.
• The data are uncertain or imprecise.
• When specialist software is not available or inappropriate.
• The 2D data exist in GIS or CAD, and 3D visualization is required.
• For integration with ArcGIS or Google Earth.
• When time is short and the budget is low.
• For data entry to specialist modeling systems such as Surpac.
• When the model objects are not attributed with information.
The choice of SketchUp with ArcGIS and Google Earth was invaluable in locating the mine site through the shifting of the cross sections to fit the terrain. The SketchUp model location was relocated easily when accurate GPS information became available. SketchUp was particularly easy to use for creating drilling options, with section cuts used to visualize the effects of a particular grid and direction. SketchUp enabled visualization of specific site issues, including drilling collision avoidance and open cut options, but does not have the power for quantitative modeling of volumes or collision analysis. SketchUp exported the mine model to Surpac using AutoCAD file format where quantitative analysis was to be performed, and the results were imported back to SketchUp.
Since the completion of this project, I use SketchUp regularly for teaching the ideas and concepts of 3D modeling to students. At work, we successfully combine petroleum infrastructure models with geological models to visualize production options and risks. The recent addition of subsea Google Earth has added a whole new dimension of underwater construction visualization. I am researching the SketchyPhysics plug-in for geoscience problems, including subsea facilities construction; plume modeling; slope stability, for example, the slope stability of blocks after 30 seconds at 20-, 30-, and 40-degree slope angles; sedimentary fill; seismic movement; or deformation under gravity.

FIG 15.23
Resources
Software
ESRI ArcGIS 9.3 ArcView is a desktop GIS software that provides geographic data visualization, mapping, management, and analysis capabilities along with the ability to create and edit data. Price is about US$1500. Purchase from http://store.esri.com.
ESRI ArcGIS 3D Analyst, ArcGIS Extension: Three-dimensional visualization and analysis. Price is about US$2500. Purchase from http://store.esri.com.
ET GeoWizards extension for ArcGIS by Ian Tchoukanski, ET Spatial Techniques. Price is US$195. Purchase from http://www.ian-ko.com/ET_GeoWizards/gw_main.htm.
ESRI ArcScripts, over 5000 free scripts for ArcGIS. Download from http://arcscripts.esri.com/.
SketchUp’s Plug-ins
ArcGIS (Beta) Import/Export of ArcGIS data to/from SketchUp and use SketchUp models as 3D Marker Symbols. Download free from http://sketchup.google.com/download/plugins.html#arcgis.
3D_Grid.rb Creates a 3D grid along X,Y,Z axis, by J. Patrick and D. Bur. Download from http://www.crai.archi.fr/RubyLibraryDepot/Ruby/3d_grid.rb.
Attributes.rb Attach arbitrary attribute data to entities and then do queries based on those attributes, by @Last. Download from http://www.crai.archi.fr/RubyLibraryDepot/Ruby/EM/attributes.rb.
BezierSpline.zip Polyline can be converted into any BezierSpline curvex. Download from http://www.crai.archi.fr/RubyLibraryDepot/Ruby/Bezierspline.zip.
Cloud_V6.zip imports x, y, z points from an ASCII file and creates 3D surfaces. Download from http://www.crai.archi.fr/RubyLibraryDepot/Ruby/EM/Cloud_V6.zip.
GetDimensions.rb displays dimensions of component, by CptanPanic. Download from http://www.crai.archi.fr/rubylibrarydepot/ruby/GetDimensions.rb.
Grid.rb to create a rectangular grid of lines, by Jim Patrick. Download from http://www.crai.archi.fr/rubylibrarydepot/ruby/grid.rb.
K_tools_21.rb draws 2D and 3D maths functions to do basic geometrical construction, by Klaudius. Download from http://www.crai.archi.fr/rubylibrarydepot/ruby/k_tools_21.rb.
MoveIt.rb moves groups/components in 3D space using [x,y,z] coordinates, by Octavian “TBD” Chis. Price is US$5. Download from http://www.smustard.com/script/MoveIt.
Links.rb adds a URL to an object, by Didier Bur. Download from http://www.crai.archi.fr/rubylibrarydepot/ruby/links.rb.
mesh_additions.rb creates a 3D mesh, by @Last. Download from http://www.crai.archi.fr/rubylibrarydepot/ruby/mesh_additions.rb.
Shapes.rb to create 3D shapes including spheres, domes, and cones, by @Last. Download from http://www.crai.archi.fr/rubylibrarydepot/ruby/shapes.rb.
SketchyPhysics.rb Newtonian Physics Software Development Kit (SDK) by Newton Game Dynamics (2006) “for real time simulation of physics environments,” by DarthGak. Download from http://code.google.com/p/sketchyphysics/.
SoapSkinAndBubbleTools.rb for creating mechanically and pneumatically strained surfaces, by Leibinger. Download from http://www.tensile-structures.de/sb_software.html.
SubdivideAndSmooth.rb organic modeling toolset, by Dale Martins.
Price is $22. Download from http://www.smustard.com/script/SubdivideAndSmooth.
VolumeCalculator21.rb (or ZVolume.rb by Gareth Swarbrick) to calculate the volume of a selected groups or components, by TIG.
Download from http://www.crai.archi.fr/rubylibrarydepot/ruby/VolumeCalculator21.rb.
Other Plug-ins
EasyCalculate is a set of expressions (currently 110) for the ArcGIS field calculator, by Ianko Tchoukanski. Download from http://arcscripts.esri.com/details.asp?dbid=12224.
Export to KML 2.5.4 converts shape files to and from kml, by Kevin Martin. Download from http://arcscripts.esri.com/details.asp?dbid=12224.