
3.4. Explosion Limits and Oxidation Characteristics of Carbon Monoxide
Early experimental work on the oxidation of carbon monoxide was confused by the presence of any hydrogen-containing impurity. The rate of CO oxidation in the presence of species such as water is substantially faster than the “bone-dry” condition. It is very important to realize that very small quantities of hydrogen, even of the order of 20 ppm, will increase the rate of CO oxidation substantially [10]. Generally, the mechanism with hydrogen-containing compounds present is referred to as the “wet” carbon monoxide condition. Obviously, CO oxidation will proceed through this so-called wet route in most practical systems.
It is informative, however, to consider the possible mechanisms for dry CO oxidation. Again the approach is to consider the explosion limits of a stoichiometric, dry CO–O2 mixture. However, neither the explosion limits nor the reproducibility of these limits is well defined, principally because the extent of dryness in the various experiments determining the limits may not be the same. Thus, typical results for explosion limits for dry CO would be as depicted in Figure 3.5.
Figure 3.5 reveals that the low-pressure ignition of CO–O2 is characterized by an explosion peninsula very much like that in the case of H2–O2. Outside this peninsula one often observes a pale-blue glow, whose limits can be determined as well. A third limit has not been defined, and if it exists, it lies well above 1 atm.
As in the case of H2–O2 limits, certain general characteristics of the defining curve in Figure 3.5 may be stated. The lower limit meets all the requirements of wall destruction of a chain propagating species. The effects of vessel diameter, surface character, and condition have been well established by experiment [2].
Under dry conditions, the chain initiating step is
![]() (3.41)
(3.41)
which is mildly exothermic, but slow at combustion temperatures. The succeeding steps in this oxidation process involve O atoms, but the exact nature of these steps is not fully established. Lewis and von Elbe [2] suggested that chain branching would come about from the step

![]() (3.42)
(3.42)
This reaction is slow, but could build up in supply. Ozone (O3) is the metastable species in the process (like HO2 in H2–O2 explosions) and could initiate chain branching, thus explaining the explosion limits. The branching arises from the reaction
![]() (3.43)
(3.43)
Ozone destruction at the wall to form oxygen molecules would explain the lower limit. Lewis and von Elbe explain the upper limit by the third-order reaction
![]() (3.44)
(3.44)
However, O3 does not appear to react with CO below 523 K. Since CO is apparently oxidized by the oxygen atoms formed by the decomposition of ozone (the reverse of reaction (3.42)), the reaction must have a high activation energy (>120 kJ/mol). This oxidation of CO by O atoms was thought to be rapid in the high-temperature range, but one must recall that it is a three-body recombination reaction.
Analysis of the glow and emission spectra of the CO–O2 reaction suggests that excited carbon dioxide molecules could be present. If it is argued that O atoms cannot react with oxygen (to form ozone), then they must react with the CO. A suggestion of Semenov was developed further by Gordon and Knipe [11], who gave the following alternative scheme for chain branching:
![]() (3.45)
(3.45)
![]() (3.46)
(3.46)
where  is the excited molecule from which the glow appears. This process is exothermic and might be expected to occur. Gordon and Knipe counter the objection that is short-lived by arguing that through system crossing in excited states, its lifetime may be sufficient to sustain the process. In this scheme, the competitive three-body reaction to explain the upper limit is the aforementioned one:
![]() (3.47)
(3.47)
Because these mechanisms did not explain shock tube rate data, Brokaw [10] proposed that the mechanism consists of reaction (3.41) as the initiation step with subsequent large energy release through the three-body reaction (3.47) and
![]() (3.48)
(3.48)
The rates of reactions (3.41), (3.47) and (3.48) are very small at combustion temperatures so that the oxidation of CO in the absence of any hydrogen-containing material is very slow. Indeed, it is extremely difficult to ignite and have a flame propagate through a bone-dry, impurity-free CO–O2 mixture.
Very early, from the analysis of ignition, flame speed, and detonation velocity data, investigators realized that small concentrations of hydrogen-containing materials would appreciably catalyze the kinetics of CO–O2. The H2O-catalyzed reaction essentially proceeds in the following manner:
![]() (3.41)
(3.41)
![]() (3.24)
(3.24)
![]() (3.49)
(3.49)
![]() (3.21)
(3.21)
If H2 is the catalyst, the steps
![]() (3.22)
(3.22)
![]() (3.23)
(3.23)
should be included. It is evident then that all of the steps of the H2–O2 reaction scheme should be included in the so-called wet mechanism of CO oxidation. As discussed in the previous section, the reaction
![]() (3.25)
(3.25)
enters and provides another route for the conversion of CO to CO2 by
![]() (3.50)
(3.50)
At high pressures or in the initial stages of hydrocarbon oxidation, high concentrations of HO2 can make reaction (3.50) competitive to reaction (3.49), however reaction (3.50) is rarely as important as reaction (3.49) in most combustion situations [4]. Nevertheless, any complete mechanism for wet CO oxidation must contain all the H2–O2 reaction steps. Again, a complete mechanism means both the forward and backward reactions of the appropriate reactions in Appendix C. In developing an understanding of hydrocarbon oxidation, it is important to realize that any high-temperature hydrocarbon mechanism involves H2 and CO oxidation kinetics, and that most, if not all, of the CO2 that is formed results from reaction (3.49).
The very important reaction (3.49) actually proceeds through a four-atom activated complex [12,13] and is not a simple reaction step like reaction (3.21). As shown in Figure 3.6, the Arrhenius plot exhibits curvature [12]. And because the reaction proceeds through an activated complex, the reaction rate exhibits some pressure dependence [14].
Just as the fate of H radicals is crucial in determining the rate of the H2–O2 reaction sequence in any hydrogen-containing combustion system, the concentration of hydroxyl radicals is also important in the rate of CO oxidation. Again, as in the H2–O2 reaction, the rate data reveal that reaction (3.49) is slower than the reaction between hydroxyl radicals and typical hydrocarbon species; thus, one can conclude—correctly—that hydrocarbons inhibit the oxidation of CO (see Table 3.1).

It is apparent that in any hydrocarbon oxidation process CO is the primary product and forms in substantial amounts. However, substantial experimental evidence indicates that the oxidation of CO to CO2 comes late in the reaction scheme [15]. The conversion to CO2 is retarded until all the original fuel and intermediate hydrocarbon fragments have been consumed [4,15]. When these species have disappeared, the hydroxyl concentration rises to high levels and converts CO to CO2. Further examination of Figure 3.6 reveals that the rate of reaction (3.49) does not begin to rise appreciably until the reaction reaches temperatures above 1100 K. Thus, in practical hydrocarbon combustion systems whose temperatures are of the order of 1100 K and below, the complete conversion of CO to CO2 may not take place.
As an illustration of the kinetics of wet CO oxidation, Figure 3.7 shows the species profiles for a small amount of CO reacting in a bath of O2 and H2O at constant temperature and constant pressure. The governing equations were described previously in Chapter 2. The induction period during which the radical pool is formed and reaches superequilibrium concentrations lasts for approximately 5 ms. Shortly after the CO starts to react, the radicals obtain their maximum concentrations and are then consumed with CO until thermodynamic equilibrium is reached approximately 30 s later. However, 90% of the CO is consumed in about 80 ms. As one might expect, for these fuel-lean conditions and a temperature of 1100 K, the OH and O intermediates are the most abundant radicals. Also note that for CO oxidation, as well as H2 oxidation, the induction times and ignition times are the same. Whereas the induction time describes the early radical pool growth and the beginning of fuel consumption, the ignition time describes the time for the onset of significant heat release. It will be shown later in this chapter that for hydrocarbon oxidation the two times are generally different.
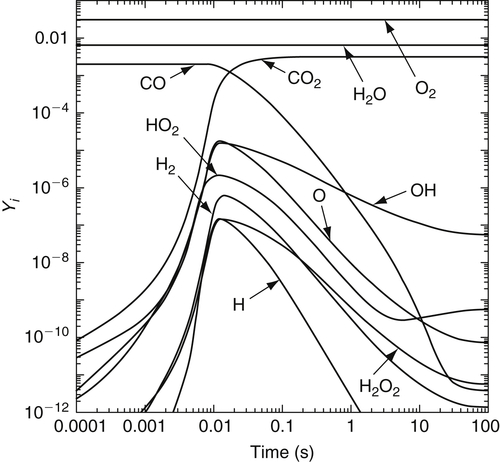
 = 0.01,
  = 0.028, and the balance N2, where Xi are the initial mole fractions.
Solution of the associated sensitivity analysis equations (Figure 3.8) gives the normalized linear sensitivity coefficients for the CO mass fraction with respect to various rate constants. A rank ordering of the most important reactions in decreasing order is
![]() (3.49f)
(3.49f)
![]() (3.25f)
(3.25f)
![]() (3.21f)
(3.21f)
![]() (3.21b)
(3.21b)
![]() (3.24f)
(3.24f)
![]() (3.24b)
(3.24b)
The reverse of reaction (3.49) has no effect until the system has equilibrated, at which point the two coefficients ∂ln YCO/∂ln k49f and ∂ln YCO/∂ln k49b are equal in magnitude and opposite in sense. At equilibrium, these reactions are microscopically balanced, and therefore the net effect of perturbing both rate constants simultaneously and equally is zero. However, a perturbation of the ratio (k49f/k49b = K49) has the largest effect of any parameter on the CO equilibrium concentration. A similar analysis shows reactions (3.21) and (3.24) to become balanced shortly after the induction period. A reaction flux (rate-of-production) analysis would reveal the same trends.

..................Content has been hidden....................
You can't read the all page of ebook, please click here login for view all page.