
Chapter 7
Ignition
Abstract
Chemical chain and thermal ignition phenomena are described. The thermal theories of Semenov and Frank-Kamenetskii are developed for analysis of the criteria for spontaneous ignition. Forced ignition by sparks and the concept of minimum ignition energy are presented as well as ignition by adiabatic compression and shock waves. Other specialized ignition processes, such as hypergolicity, pyrophoricity, and catalytically assisted ignition, are introduced.
Keywords
Catalytic ignition; Chain ignition; Hypergolicity; Minimum ignition energy; Pyrophoricity; Spark ignition; Thermal ignition7.1. Concepts
If the concept of ignition were purely a chemical phenomenon, it would be treated more appropriately prior to the discussion of gaseous explosions (Chapter 3). However, thermal considerations are crucial to the concept of ignition. Indeed, thermal considerations play the key role in consideration of the ignition of condensed phases. The problem of storage of wet coal or large concentrations of solid materials (grain, pulverized coal, etc.) that can undergo slow exothermic decomposition in the presence of air is also one of ignition, that is, the concept of spontaneous combustion is an element of the theory of thermal ignition. Indeed, large piles of leaves and dust clouds of flour, sugar, and certain metals fall into the same category.
It is appropriate to reexamine the elements discussed in the analysis of the explosion limits of hydrocarbons. The explosion limits shown in Figure 3.9 of Chapter 3 exist for particular conditions of pressure and temperature. When the thermal conditions for point 1 in this figure exist, some reaction begins; thus, some heat must be evolved. The experimental configuration is assumed to be such that the heat of reaction is dissipated infinitely fast at the walls of the containing vessel to retain the temperature at the initial value T1. Then, steady reaction prevails, and a slight pressure rise is observed. When conditions such as those at point 2 prevail, as discussed in Chapter 3, the rate of chain carrier generation exceeds the rate of chain termination; hence, the reaction rate becomes progressively greater, and subsequently, an explosion—or, in the context here, ignition—occurs. Generally, pressure is used as a measure of the extent of reaction, although, of course, other measures can be used as well. The sensitivity of the measuring device determines the point at which a change in initial conditions is first detected. Essentially, this change in initial conditions (pressure) is not noted until after some time interval and, as discussed in Chapter 3, this interval can be related to the time required to reach the degenerate branching stage or some other stage in which chain branching begins to demonstrably affect the overall reaction. This time interval is considered to be an induction period and to correspond to the ignition concept. This induction period will vary considerably with temperature. Increasing the temperature increases the rates of the reactions leading to branching, thereby shortening the induction period. The isothermal events discussed in this paragraph essentially define chemical chain ignition.
Now, if one begins at conditions similar to point 1 in Figure 3.9 of Chapter 3—except that the experimental configuration is such that the heat of reaction is not dissipated at the walls of the vessel, that is, the system is adiabatic—the reaction will self-heat until the temperature of the mixture moves the system into the explosive reaction regime. This type of event is called a two-stage ignition, and there are two induction periods, or ignition times, associated with it. The first is associated with the time (τc, chemical time) to build to the degenerate branching step or the critical concentration of radicals (or, for that matter, any other chain carriers), and the second (τt, thermal time) is associated with the subsequent steady reaction step and is the time it takes for the system to reach the thermal explosion (ignition) condition. Generally, τc > τt.
If the initial thermal condition begins in the chain explosive regime, such as point 2, the induction period τc still exists; however, there is no requirement for self-heating, so the mixture immediately explodes. In essence, τt → 0.
In many practical systems, one cannot distinguish the two stages in the ignition process since τc > τt; thus, the time that one measures is predominantly the chemical induction period. Any errors in correlating experimental ignition data in this low-temperature regime are due to small changes in τt.
Sometimes, point 2 will exist in the cool-flame regime. Again, the physical conditions of the nonadiabatic experiment can be such that the heat rise due to the passage of the cool flame can raise the temperature so that the flame condition moves from a position characterized by point 1 to one characterized by point 4. This phenomenon is also called two-stage ignition. The region of point 4 is not a chain branching explosion, but a self-heating explosion. Again, an induction period τc is associated with the initial cool-flame stage, and a subsequent time τt is associated with the self-heating aspect.
If the reacting system is initiated under conditions similar to point 4, pure thermal explosions develop, and these explosions have thermal induction or ignition times associated with them. As will be discussed in subsequent paragraphs, thermal explosion (ignition) is possible even at low temperatures, both under the nonadiabatic conditions utilized in obtaining hydrocarbon−air explosion limits and under adiabatic conditions.
The concepts just discussed concern premixed fuel−oxidizer situations. In reality, these ignition types do not arise frequently in practical systems. However, one can use these concepts to gain a better understanding of many practical combustion systems, such as the ignition of liquid fuels.
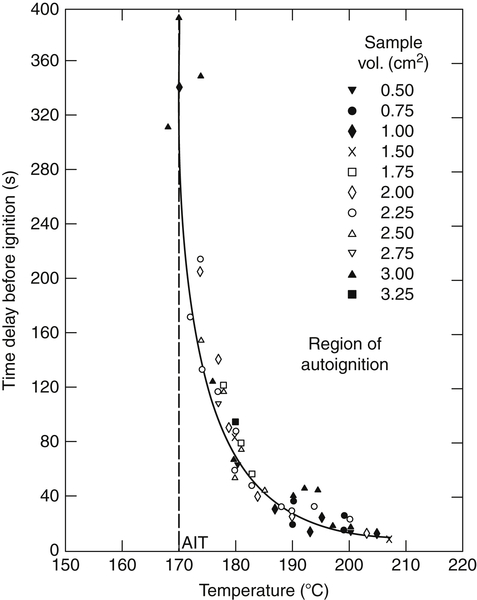
Many ignition experiments have been performed by injecting liquid and gaseous fuels into heated stagnant and flowing air streams [1,2]. It is possible from such experiments to relate an ignition delay (or time) to the temperature of the air. If this temperature is reduced below a certain value, no ignition occurs even after an extended period of time. This temperature is one of interest in fire safety and is referred to as the spontaneous or autoignition temperature (AIT). Figure 7.1 shows some typical data from which the spontaneous ignition temperature is obtained. The AIT is fundamentally the temperature at which elements of the fuel−air system enter the explosion regime. Thus, the AIT must be a function of pressure as well; however, most reported data, such as those given in Appendix G, are for a pressure of 1 atm. As will be shown later, a plot of the data in Figure 7.1 in the form of log (time) versus (1/T) will give a straight line. In the experiments mentioned, in the case of liquid fuels, the fuel droplet attains a vapor pressure corresponding to the temperature of the heated air. A combustible mixture close to stoichiometric forms irrespective of the fuel. It is this mixture that enters the explosive regime, which in actuality has an induction period associated with it. Approximate measurements of this induction period can be made in a flowing system by observing the distance from the point of injection of the fuel to the point of first visible radiation, then relating this distance to the time through knowledge of the stream velocity.
In essence, droplet ignition is brought about by the heated flowing air stream. This type of ignition is called “forced ignition” in contrast to the “self-ignition” conditions of chain and thermal explosions. The terms self-ignition, spontaneous ignition, and autoignition are used synonymously. Obviously, forced ignition may also be the result of electrical discharges (sparks), heated surfaces, shock waves, flames, etc. Forced ignition is usually considered a local initiation of a flame that will propagate; however, in certain instances, a true explosion is initiated. After examination of an analytical analysis of chain spontaneous ignition and its associated induction times, this chapter will concentrate on the concepts of self- or spontaneous ignition. Then, aspects of forced ignition will be discussed. This approach will also cover the concepts of hypergolicity and pyrophoricity. Lastly, some insight into catalytic ignition is presented.
7.2. Chain Spontaneous Ignition
In Chapter 3, the conditions for a chain branching explosion were developed on the basis of a steady-state analysis. It was shown that when the chain branching factor α at a given temperature and pressure was greater than some critical value αcrit, the reacting system exploded. Obviously, in that development, no induction period or critical chain ignition time τc evolved.
In this section, consideration is given to an analytical development of this chain explosion induction period that has its roots in the early work on chain reactions carried out by Semenov [3] and Hinshelwood [4] and reviewed by Zeldovich et al. [5].
The approach considered as a starting point is a generalized form of Eqn (3.9) of Chapter 3, but not as a steady-state expression. Thus, the overall rate of change of the concentration of chain carriers (R) is expressed by the equation,
![]() (7.1)
(7.1)
where  is the initiation rate of a very small concentration of carriers. Such initiation rates are usually very slow. Rate expressions kb and kt are for the overall chain branching and termination steps, respectively, and
  is simply the difference kb − kt.
Constants kb, kt, and, obviously, are dependent on the physical conditions of the system; in particular, temperature and pressure are major factors in their explicit values. However, one must realize that kb is much more temperature dependent than kt. The rates included in kt are due to recombination (bond formation) reactions of very low activation energy that exhibit little temperature dependence, whereas most chain branching and propagating reactions can have significant values of activation energy. One can conclude, then, that ϕ can change sign as the temperature is raised. At low temperatures, it is negative, and at high temperatures, it is positive. Then, at high temperatures, d(R)/dt is a continuously and rapidly increasing function. At low temperatures, as [d(R)/dt] → 0, (R) approaches a fixed limit  ; hence, there is no runaway and no explosion. For a given pressure, the temperature corresponding to ϕ = 0 is the critical temperature below which no explosion can take place.
At time zero, the carrier concentration is essentially zero, and (R) = 0 at t = 0 serves as the initial condition for Eqn (7.1). Integrating Eqn (7.1) results in the following expression for (R):
![]() (7.2)
(7.2)
If as a result of the chain system the formation of every new carrier is accompanied by the formation of j molecules of final product (P), the expression for the rate of formation of the final product becomes
![]() (7.3)
(7.3)
An analogous result is obtained if the rate of formation of carriers is equal to zero  , and the chain system is initiated due to the presence of some initial concentration (R)0. Then, for the initial condition that at t = 0, (R) = (R)0, Eqn (7.2) becomes
![]() (7.4)
(7.4)
The derivations of Eqns (7.1)–(7.4) are valid only at the initiation of the reaction system; kb and kt were considered constant when the equations were integrated. Even for constant temperature, kb and kt will change because the concentration of the original reactants would appear in some form in these expressions.
Equations (7.2) and (7.4) are referred to as Semenov's law, which states that in the initial period of a chain reaction the chain carrier concentration increases exponentially with time when kb > kt.
During the very early stages of the reaction, the rate of formation of carriers begins to rise, but it can be below the limits of measurability. After a period of time, the rate becomes measurable and continues to rise until the system becomes explosive. The explosive reaction ceases only when the reactants are consumed. The time to the small measurable rate  corresponds to the induction period τc.
![]() (7.5)
(7.5)
The induction period then becomes
![]() (7.6)
(7.6)
If one considers either the argument of the logarithm in Eqn (7.6) as a nearly constant term, or kb as much larger than kt so that ϕ ≅ kb, one has
![]() (7.7)
(7.7)
so that the induction time depends on the relative rates of branching and termination. The time decreases as the branching rate increases.
7.3. Thermal Spontaneous Ignition
The theory of thermal ignition is based upon a very simple concept. When the rate of thermal energy release is greater than the rate of thermal energy dissipation (loss), an explosive condition exists. When the contracondition exists, thermal explosion is impossible. When the two rates are equal, the critical conditions for ignition (explosion) are specified. Essentially, the same type of concept holds for chain explosions. As was detailed in Section 3.2 of Chapter 3, when the rate of chain branching becomes greater than the rate of chain termination (α > αcrit), an explosive condition arises, whereas α < αcrit specifies steady reaction. Thus, when one considers the external effects of heat loss or chain termination, one finds a great deal of commonality between chain and thermal explosion.
In consideration of external effects, it is essential to emphasize that under some conditions the thermal induction period could persist for a very long period of time, even hours. This condition arises when the vessel walls are thermally insulated. In this case, even with a very low initial temperature, the heat of the corresponding slow reaction remains in the system and gradually self-heats the reactive components until ignition (explosion) takes place. If the vessel is not insulated and heat is transferred to the external atmosphere, equilibrium is rapidly reached between the heat release and heat loss, so thermal explosion is not likely. This point will be refined in Section 7.3.2.
It is possible to conclude from the preceding that the study of the laws governing thermal explosions will increase the understanding of the phenomena controlling the spontaneous ignition of combustible mixtures and forced ignition in general.
The concepts discussed were first presented in analytical forms by Semenov [3] and later in a more exact form by Frank-Kamenetskii [6]. Since the Semenov approach offers an easier physical insight, it will be considered first, and then the details of the Frank-Kamenetskii approach will be presented.
7.3.1. Semenov Approach of Thermal Ignition
Semenov first considered the progress of the reaction of a combustible gaseous mixture at an initial temperature T0 in a vessel whose walls were maintained at the same temperature. The amount of heat released due to chemical reaction per unit time  then can be represented in simplified overall form as
![]() (7.8)
(7.8)
where V is the volume of the vessel,  is the reaction rate, Q is the thermal energy release of the reactions, c is the overall concentration, n is the overall reaction order, A is the preexponential in the simple rate constant expression, and T is the temperature that exists in the gaseous mixture after the reaction commences. The concentration can be represented in terms of the total density ρ and the mass fraction ε of the reacting species, that is, (M) = re. Since the interest in ignition is in the effect of the total pressure, all concentrations are treated as equal to ρε. The overall heat loss (
 ) to the walls of the vessel, and hence to the medium that maintains the walls of the vessel at T0, can be represented by the expression
![]() (7.9)
(7.9)
where h is the heat transfer coefficient, and S is the surface area of the walls of the containing vessel.
The heat release  is a function of pressure through the density term, and
  is a less sensitive function of pressure through h, which, according to the heat transfer method by which the vessel walls are maintained at T0, can be a function of the Reynolds number.
Shown in Figure 7.2 is the relationship between  and
and  for various initial pressures, a value of the heat transfer coefficient h, and a constant wall temperature of T0. In Eqn (7.8), takes the usual exponential shape due to the Arrhenius kinetic rate term, and
  is obviously a linear function of the mixture temperature T. The
  line intersects the
  curve for an initial pressure P3 at two points, a and b.
For a system in which there is simultaneous heat generation and heat loss, the overall energy conservation equation takes the form
![]() (7.10)
(7.10)
where the term on the left-hand side is the rate of energy accumulation in the containing vessel and cv is the molar constant volume heat capacity of the gas mixture. Thus, a system whose initial temperature is T0 will rise to point a spontaneously. Since  and the mixture attains the steady, slow-reacting rate
  or
or  , this point is an equilibrium point. If the conditions of the mixture are somehow perturbed so that the temperature reaches a value greater than Ta, then
  becomes greater than , and the system moves back to the equilibrium condition represented by point a. Only if there is a very great perturbation so that the mixture temperature becomes a value greater than that represented by point b will the system self-heat to explosion. Under this condition
  .
.
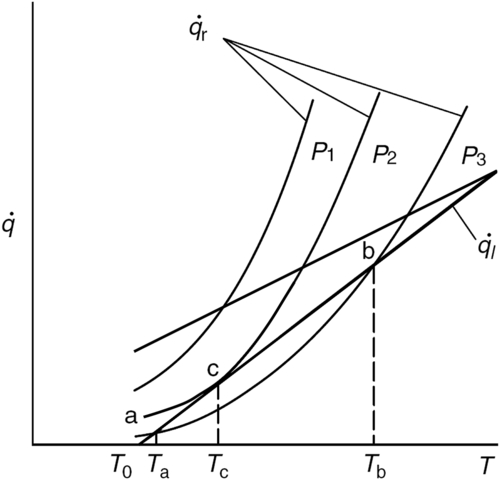
If the initial pressure is increased to some value P2, the heat release curve shifts to higher values, which are proportional to Pn (or ρn). The assumption is made that h is not affected by this pressure increase. The value of P2 is selected so that the  becomes tangent to the curve at some point c. If the value of h is lowered, is everywhere greater than
  and all initial temperatures give explosive conditions. It is therefore obvious that when the
  line is tangent to the curve, the critical condition for mixture self-ignition exists.
The point c represents an ignition temperature Ti (or Tc), and from the conditions there, Semenov showed that a relationship could be obtained between this ignition temperature and the initial temperature of the mixture—that is, the temperature of the wall (T0). Recall that the initial temperature of the mixture and the temperature at which the vessel’s wall is maintained are the same (T0). It is important to emphasize that T0 is a wall temperature that may cause a fuel–oxidizer mixture to ignite. This temperature can be hundreds of degrees greater than ambient, and T0 should not be confused with the reference temperature taken as the ambient (298 K) in Chapter 1.
The conditions at point c corresponding to Ti (or Tc) are
![]() (7.11)
(7.11)
or
![]() (7.12)
(7.12)
![]() (7.13)
(7.13)
Since the variation in T is small, the effect of this variation on the density is ignored for simplicity's sake. Dividing Eqn (7.12) by Eqn (7.13), one obtains
![]() (7.14)
(7.14)
Equation (7.14) is rewritten as
![]() (7.15)
(7.15)
whose solutions are
![]() (7.16)
(7.16)
The solution with the positive sign gives extremely high temperatures and does not correspond to any physically real situation. Rewriting Eqn (7.16)
![]() (7.17)
(7.17)
![]()
Since (RT0/E) is a small number, one may neglect the higher-order terms to obtain
![]() (7.18)
(7.18)
For a hydrocarbon–air mixture whose initial temperature is 700 K and whose overall activation energy is about 160 kJ/mol, the temperature rise given in Eqn (7.18) is approximately 25 K. Thus, for many cases, it is possible to take Ti as equal to T0 or  with only a small error in the final result. Thus, if
![]() (7.19)
(7.19)
and
![]() (7.20)
(7.20)
 (7.21)
That is, the rate of chemical reaction at the critical ignition condition is equal to the rate at the initial temperature times the number e. Substituting this result and the approximation given by Eqn (7.18) into Eqn (7.12), one obtains
![]() (7.22)
(7.22)
Representing ρ in terms of the perfect gas law and using the logarithmic form, one obtains
![]() (7.23)
(7.23)
Since the overall order of most hydrocarbon oxidation reactions can be considered to be approximately 2, Eqn (7.23) takes the form of the so-called Semenov expression:
![]() (7.24)
(7.24)
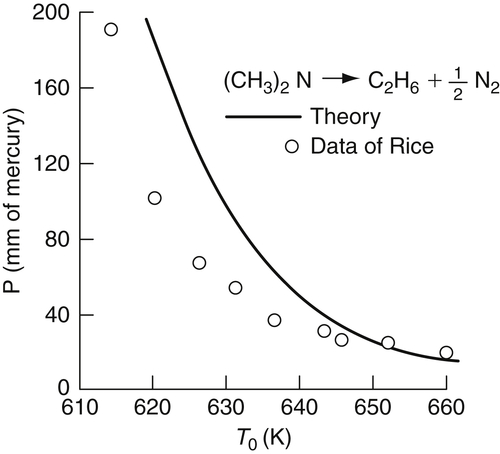
Equations (7.23) and (7.24) define the thermal explosion limits, and a plot of  versus (1/T0) gives a straight line as is found for many gaseous hydrocarbons. A plot of P versus T0 takes the form given in Figure 7.3 and shows the similarity of this result to the thermal explosion limit (point 3 to point 4 in Figure 3.9 of Chapter 3) of hydrocarbons. The variation of the correlation with the chemical and physical terms in B should not be overlooked. Indeed, the explosion limits are a function of the surface area to volume ratio (S/V) of the containing vessel.
Under the inherent assumption that the mass fractions of the reactants are not changing, further interesting insights can be obtained by rearranging Eqn (7.22). If the reaction proceeds at a constant rate corresponding to T0, a characteristic reaction time τr can be defined as
![]() (7.25)
(7.25)
A characteristic heat loss time τl can be obtained from the cooling rate of the gas as if it were not reacting by the expression
![]() (7.26)
(7.26)
The characteristic heat loss time is generally defined as the time it takes to cool the gas from the temperature (T − T0) to [(T − T0)/e] and is found to be
![]() (7.27)
(7.27)
By substituting Eqns (7.18), (7.25) and (7.27) into Eqn (7.22) and realizing that (Q/cv) can be approximated by (Tf − T0), the adiabatic explosion temperature rise, one obtains the following expression:
![]() (7.28)
(7.28)
Thus, if (τr/τl) is greater than the value obtained from Eqn (7.28), thermal explosion is not possible, and the reaction proceeds at a steady low rate given by point a in Figure 7.2. If (τr/τl) > (eΔTf/ΔTi) and ignition still takes place, the explosion proceeds by a chain rather than by a thermal mechanism.
With the physical insights developed from this qualitative approach to the thermal ignition problem, it is appropriate to consider the more quantitative approach of Frank-Kamenetskii [6].
7.3.2. Frank-Kamenetskii Theory of Thermal Ignition
Frank-Kamenetskii first considered the nonsteady heat conduction equation. However, since the gaseous mixture, liquid, or solid energetic fuel can undergo exothermic transformations, a chemical reaction rate term is included. This term specifies a continuously distributed source of heat throughout the containing vessel boundaries. The heat conduction equation for the vessel is then
![]() (7.29)
(7.29)
in which the nomenclature is apparent, except perhaps for  , which represents the heat release rate density.
The solution of this equation would give the temperature distribution as a function of the spatial distance and the time. At the ignition condition, the character of this temperature distribution changes sharply. There should be an abrupt transition from a small steady rise to a large and rapid rise. Although computational methods of solving this equation are available, much insight into overall practical ignition phenomena can be gained by considering the two approximate methods of Frank-Kamenetskii. These two approximate methods are known as the stationary and nonstationary solutions. In the stationary theory, only the temperature distribution throughout the vessel is considered, and the time variation is ignored. In the nonstationary theory, the spatial temperature variation is not taken into account, a mean temperature value throughout the vessel is used, and the variation of the mean temperature with time is examined. The nonstationary problem is the same as that posed by Semenov; the only difference is in the mathematical treatment.
7.3.2.1. The Stationary Solution—The Critical Mass and Spontaneous Ignition Problems
The stationary theory deals with time-independent equations of heat conduction with distributed sources of heat. Its solution gives the stationary temperature distribution in the reacting mixture. The initial conditions under which such a stationary distribution becomes impossible are the critical conditions for ignition.
Under this steady assumption, Eqn (7.29) becomes
![]() (7.30)
(7.30)
![]() (7.31)
(7.31)
It is important to consider the definition of . Defined as the amount of heat evolved by chemical reaction in a unit volume per unit time, is the product of the terms involving the energy content of the fuel and its rate of reaction. The rate of the reaction can be written as Ze−E/RT. Recall that Z in this example is different from the normal Arrhenius preexponential term in that it contains the concentration terms and therefore can be dependent on the mixture composition and the pressure. Thus,
![]() (7.32)
(7.32)
where Q is the volumetric energy release of the combustible mixture. It follows then that
![]() (7.33)
(7.33)
and the problem resolves itself to first reducing this equation under the boundary condition that T = T0 at the wall of the vessel.
Since the stationary temperature distribution below the explosion limit is sought, in which case the temperature rise throughout the vessel must be small, it is best to introduce a new variable:
![]()
where ν << T0. Under this condition, it is possible to describe the cumbersome exponential term as
![]()
If the term in brackets is expanded and the higher-order terms are eliminated, this expression simplifies to

and (Eqn (7.33)) becomes
 (7.34)
In order to solve Eqn (7.34), new variables are defined:
![]()
where r is the radius of the vessel, and x is the distance from the center. Equation (7.34) then becomes
![]() (7.35)
(7.35)
and the boundary conditions are η = 1, θ = 0, and η = 0, dθ/dη = 0.
Both Eqn (7.35) and the boundary conditions contain only one nondimensional parameter δ:
![]() (7.36)
(7.36)
The solution of Eqn (7.35), which represents the stationary temperature distribution, should be of the form θ = f (η, δ) with one parameter, that is, δ. The condition under which such a stationary temperature distribution ceases to be possible, that is, the critical condition of ignition, is of the form δ = const = δcrit. The critical value depends upon T0, the geometry (if the vessel is nonspherical), and the pressure through Z. Numerical integration of Eqn (7.35) for various values of δ determines the critical δ. For a spherical vessel, δcrit = 3.32; for an infinite cylindrical vessel, δcrit = 2.00; and for infinite parallel plates, δcrit = 0.88, where r becomes the distance between the plates.
As in the discussion of flame propagation, the stoichiometry and pressure dependence are in Z and Z ∼ Pn, where n is the order of the reaction. Equation (7.36) expressed in terms of δcrit permits the relationship between the critical parameters to be determined. Taking logarithms,
![]()
If the reacting medium is a solid or liquid undergoing exothermic decomposition, the pressure term is omitted and
![]()
These results define the conditions for the critical size of storage for compounds such as ammonium nitrate as a function of the ambient temperature T0 [7]. Similarly, it represents the variation in the mass of combustible material that will spontaneously ignite as a function of the ambient temperature T0. The higher the ambient temperature, the smaller the critical mass has to be to prevent disaster. Conversely, the more reactive the material, the smaller the size that will undergo spontaneous combustion. Indeed this concept is of great importance from a fire safety point of view due to the use of linseed oil and tung oil as a polishing and preserving agent of fine wood furniture. These oils are natural products that have never been duplicated artificially [8]. Their chemical structures are such that when exposed to air an oxidation reaction forms a transparent oxide coating (of the order of 24 Å) that protects wood surfaces. There is a very small finite amount of heat released during this process that the larger mass of the applied object readily absorbs. However, if the cloths that are used to apply these oils are not disposed of properly, they will self ignite. Disposing of these cloths in a waste receptacle is dangerous unless the receptacle contains large amounts of water for immersion of the cloths. The protective oxide coat formed during polishing is similar to the protective oxide coat on aluminum. Also, a large pile of damp leaves or pulverized coal, which cannot disperse the rising heat inside the pile, will ignite as well. Generally, in these cases, the use of the term spontaneous ignition could be misleading in that the pile of cloths with linseed oil, a pile of leaves or a pile of pulverized coal will take a great deal of time before the internal elements reach a high-enough temperature that combustion starts and there is rapid energy release leading to visible flames.
7.3.2.2. The Nonstationary Solution
The nonstationary theory deals with the thermal balance of the whole reaction vessel and assumes the temperature to be the same at all points. This assumption is, of course, incorrect in the conduction range where the temperature gradient is by no means localized at the wall. It is, however, equivalent to a replacement of the mean values of all temperature-dependent magnitudes by their values at a mean temperature, and involves relatively minor error.
If the volume of the vessel is designated by V and its surface area by S, and if a heat transfer coefficient h is defined, the amount of heat evolved over the whole volume per unit time by the chemical reaction is
![]() (7.37)
(7.37)
and the amount of heat carried away from the wall is
![]() (7.38)
(7.38)
Thus, the problem is now essentially nonadiabatic. The difference between the two heat terms is the heat that causes the temperature within the vessel to rise a certain amount per unit time:
![]() (7.39)
(7.39)
These terms can be expressed as an equality:
![]() (7.40)
(7.40)
or
![]() (7.41)
(7.41)
Equations (7.48) and (7.41) are forms of Eqn (7.29) with a heat loss term. Nondimensionalizing the temperature and linearizing the exponent in the same manner as in the previous section, one obtains
![]() (7.42)
(7.42)
with the initial condition θ = 0 at t = 0.
The equation is not in dimensionless form. Each term has the dimension of reciprocal time. In order to make the equation completely dimensionless, it is necessary to introduce a time parameter. Equation (7.42) contains two such time parameters:
![]()
Consequently, the solution of Eqn (7.42) should be in the form
![]()
where τl,2 implies either τ1 or τ2.
Thus, the dependence of dimensionless temperature θ on dimensionless time t/τ1,2 contains one dimensionless parameter τ2/τ1. Consequently, a sharp rise in temperature can occur for a critical value τ2/τ1.
It is best to examine Eqn (7.42) written in terms of these parameters, that is,
![]() (7.43)
(7.43)
In the ignition range, the rate of energy release is much greater than the rate of heat loss, that is, the first term on the right-hand side of Eqn (7.43) is much greater than the second. Under these conditions, removal of heat is disregarded, and the thermal explosion is viewed as essentially adiabatic.
Then, for an adiabatic thermal explosion, the time dependence of the temperature should be in the form
![]() (7.44)
(7.44)
Under these conditions, the time within which a given value of θ is attained is proportional to the magnitude τ1. Consequently, the induction period in the instance of adiabatic explosion is proportional to τ1. The proportionality constant has been shown to be unity. Conceptually, this induction period can be related to the time period for the ignition of droplets for different air (or ambient) temperatures. Thus, τ can be the adiabatic induction time and is simply
![]() (7.45)
(7.45)
Again, the expression can be related to the critical conditions of time, pressure, and ambient temperature T0 by taking logarithms:
![]() (7.46)
(7.46)
The pressure dependence, as before, is derived not only from the perfect gas law for ρ, but from the density–pressure relationship in Z as well. Also, the effect of the stoichiometry of a reacting gas mixture would be in Z. But the mole fraction terms would be in the logarithm, and therefore have only a mild effect on the induction time. For hydrocarbon–air mixtures, the overall order is approximately 2, so Eqn (7.46) becomes
![]() (7.47)
(7.47)
It is interesting to note that Eqn (7.47) is essentially the condition used in bluff-body stabilization conditions in Chapter 4, Section 4.8. This result gives the intuitively expected answer that the higher the ambient temperature, the shorter is the ignition time. Hydrocarbon droplet and gas fuel injection ignition data correlate well with the dependences as shown in Eqn (7.47) [9,10].
In a less elegant fashion, Todes [11] (see Jost [12]) obtained the same expression as Eqn (7.45). As Semenov [3] has shown by the use of Eqn (7.25), Eqn (7.45) can be written as
![]() (7.48)
(7.48)
Since (E/RT0)−1 is a small quantity not exceeding 0.05 for most cases of interest and (cvT0/Q) is also a small quantity of the order 0.1, the quantity  may be considered to have a range from 0.01 to 0.001. Thus, the thermal ignition time for a given initial temperature T0 is from a hundredth to a thousandth of the reaction time evaluated at T0. Since from Eqn (7.28) and its subsequent discussion
![]() (7.49)
(7.49)
then
![]() (7.50)
(7.50)
which signifies that the induction period is of the same order of magnitude as the thermal relaxation time.
Since it takes only a very small fraction of the reaction time to reach the end of the induction period, at the moment of the sudden rapid rise in temperature (i.e., when explosion begins), not >1% of the initial mixture has reacted. This result justifies the inherent approximation developed that the reaction rate remains constant until explosion occurs. Also justified is the earlier assumption that the original mixture concentration remains the same from T0 to Ti. This observation is important in that it reveals that no significantly different results would be obtained if the more complex approach using both variations in temperature and concentration were used.
7.4. Forced Ignition
Unlike the concept of spontaneous ignition, which is associated with a large condensed-phase mass of reactive material, the concept of forced ignition is essentially associated with gaseous materials. The energy input into a condensed-phase reactive mass may be such that the material vaporizes and then ignites, but the phenomena that lead to ignition are those of the gas-phase reactions. There are many means to force ignition of a reactive material or mixture, but the most commonly studied concepts are those associated with various processes that take place in the spark ignition, automotive engine.
The spark is the first and most common form of forced ignition. In the automotive cylinder, it initiates a flame that travels across the cylinder. The spark is fired before the piston reaches top dead center and, as the flame travels, the combustible mixture ahead of this flame is being compressed. Under certain circumstances, the mixture ahead of the flame explodes, in which case the phenomenon of knock is said to occur. The gases ahead of the flame are usually ignited as the temperature rises due to the compression or some hot spot on the metallic surfaces in the cylinder. As discussed in Chapter 2, knock is most likely an explosion, but not a detonation. The physical configuration would not permit the transformation from a deflagration to a detonation. Nevertheless, knock, or premature forced ignition, can occur when a fuel–air mixture is compressively heated or when a hot spot exists. Consequently, it is not surprising that the ignitability of a gaseous fuel–air mixture—or, for that matter, any exoergic system—has been studied experimentally by means approaching adiabatic compression to high temperature and pressure, by shock waves (which also raise the material to a high temperature and pressure), or by propelling hot metallic spheres or incandescent particles into a cold reactive mixture.
Forced ignition can also be brought about by pilot flames or by flowing hot gases, which act as a jet into the cold mixture to be ignited. Or it may be engendered by creating a boundary layer flow parallel to the cold mixture, which may also be flowing. Indeed, there are several other possibilities that one might evoke. For consideration of these systems, the reader is referred to Ref. [13].
It is apparent, then, that an ignition source can lead either to a pure explosion or to a flame (deflagration) that propagates. The geometric configuration in which the flame has been initiated can be conducive to the transformation of the flame into a detonation. There are many elements of concern with respect to fire and industrial safety in these considerations. Thus, a concept of a minimum ignition energy has been introduced as a test method for evaluating the ignitability of various fuel–air mixtures or any system that has exoergic characteristics.
Ignition by near adiabatic compression or shock wave techniques creates explosions that are most likely chain carrier, rather than thermal, initiated. This aspect of the subject will be treated at the end of this chapter. The main concentration in this section will be on ignition by sparks based on a thermal approach by Zeldovich [14]. This approach, which gives insights not only into the parameters that give spark ignition but also into forced ignition systems that lead to flames has applicability to the minimum ignition energy.
7.4.1. Spark Ignition and Minimum Ignition Energy
The most commonly used spark systems for mobile power plants are capacitance sparks, which are developed from discharged condensers. The duration of these discharges can be as short as 0.01 μs or as long as 100 μs for larger engines. Research techniques generally employ two circular electrodes with flanges at the tips. The flanges have a parallel orientation and a separation distance greater than the quenching distance for the mixture to be ignited. (Reference [13] reports extensive details about spark and all other types of forced ignition.) The energy in a capacitance spark is given by
![]() (7.51)
(7.51)
where E is the electrical energy obtained in joules, cf is the capacitance of the condenser in farads, υ2 is the voltage on the condenser just before the spark occurs, and υ1 is the voltage at the instant the spark ceases.
In the Zeldovich method of spark ignition, the spark is replaced by a point heat source, which releases a quantity of heat. The time-dependent distribution of this heat is obtained from the energy equation
![]() (7.52)
(7.52)
When this equation is transformed into spherical coordinates, its boundary conditions become
![]()
The distribution of the input energy at any time must obey the equality
 (7.53)
The solution of Eqn (7.52) then becomes
![]() (7.54)
(7.54)
The maximum temperature (TM) must occur at r → 0, so that
![]() (7.55)
(7.55)
Considering that the gaseous system to be ignited exists everywhere from r = 0 to r = ∞, the condition for ignition is specified when the cooling time (τc) associated with TM is greater than the reaction duration time τr in the combustion zone of a laminar flame.
This characteristic cooling time is the period in which the temperature at r = 0 changes by the value θ. This small temperature difference θ is taken as  , that is,
![]() (7.56)
(7.56)
This expression results from the same type of analysis that led to Eqn (7.18). A plot of TM versus τ [Eqn (7.55)] is shown in Figure 7.4. From this figure, the characteristic cooling time can be taken to a close approximation as
![]() (7.57)
(7.57)
The slope is taken at a time when the temperature at r = 0 is close to the adiabatic flame temperature of the mixture to be ignited. By differentiating Eqn (7.55), the denominator of Eqn (7.57) can be evaluated to give
![]() (7.58)
(7.58)
where  is now given a specific definition as the amount of external input energy required to heat a spherical volume of radius rf uniformly from T0 to Tf, that is,
![]() (7.59)
(7.59)

Thus, Eqn (7.58) becomes
![]() (7.60)
(7.60)
Considering that the temperature difference θ must be equivalent to (Tf − Ti) in the Zeldovich–Frank-Kamenetskii–Semenov thermal flame theory, the reaction time corresponding to the reaction zone δ in the flame can also be approximated by
![]() (7.61)
(7.61)
where  is the characteristic time associated with the flame and
![]() (7.62)
(7.62)
specifies the thermal width of the flame.
![]() (7.63)
(7.63)
Physically, Eqn (7.63) specifies that for a spark to lead to ignition of an exoergic system, the corresponding equivalent heat input radius must be several times the characteristic width of the laminar flame zone. Under this condition, the nearby layers of the initially ignited combustible material will further ignite before the volume heated by the spark cools.
The preceding developments are for an idealized spark ignition system. In actual systems, much of the electrical energy is expended in radiative losses, shock wave formation, and convective and conductive heat losses to the electrodes and flanges. Zeldovich [14] has reported for mixtures that the efficiency
![]() (7.64)
(7.64)
can vary from 2% to 16%. Further, the development was idealized by assuming consistency of the thermophysical properties and the specific heat. Nevertheless, experimental results taking all these factors into account [14,15] reveal relationships very close to
![]() (7.65)
(7.65)
The further importance of Eqns (7.63) and (7.65) is in the determination of the important parameters that govern the minimum ignition energy. By substituting Eqns (7.62) and (7.63) into Eqn (7.59), one obtains the proportionality
![]() (7.66)
(7.66)
Considering α = (λ/ρcp) and applying the perfect gas law, the dependence of  on P and T is found to be
![]() (7.67)
(7.67)
The minimum ignition energy is also a function of the electrode spacing. It becomes asymptotic to a very small spacing below which no ignition is possible. This spacing is the quenching distance discussed in Chapter 4. The minimum ignition energy decreases as the electrode spacing is increased, reaches its lowest value at some spacing, then begins to rise again. At small spacings, the electrode removes large amounts of heat from the incipient flame, and thus, a large minimum ignition energy is required. As the spacing increases, the surface area to volume ratio decreases, and, consequently, the ignition energy required decreases. Most experimental investigations [13,16] report the minimum ignition energy for the electrode spacing that gives the lowest value.
An interesting experimental observation is that there appears to be an almost direct relation between the minimum ignition energy and the quenching distance [16,17]. Calcote et al. [16] have reported significant data in this regard, and their results are shown in Figure 7.5. These data are for stoichiometric mixtures with air at 1 atm.
The general variation of minimum ignition energy with pressure and temperature would be that given in Eqn (7.67), in which one must recall that SL is also a function of the pressure and the Tf of the mixture. Figure 7.6 from Blanc et al. [15] shows the variation of  as a function of the equivalence ratio. The variation is very similar to the variation of quenching distance with the equivalence ratio ϕ [12] and is, to a degree, the inverse of SL versus ϕ. However, the increase of from its lowest value for a given ϕ is much steeper than the decay of SL from its maximum value. The rapid increase in must be due to the fact that SL is a cubed term in the denominator of Eqn (7.67). Further, the lowest is always found on the fuel-rich side of stoichiometric, except for methane [14,16]. This trend is apparently attributable to the difference in the mass diffusivities of the fuel and oxygen. Notice the position of the methane curve with respect to the other hydrocarbons in Figure 7.6. Methane is the only hydrocarbon shown whose molecular weight is appreciably lower than that of the oxygen in air.

Many [13,16] have tried to determine the effect of molecular structure on . Generally, the primary effect of molecular structure is seen in its effect on Tf (in SL) and α.
Appendix H lists minimum ignition energies of many fuels for the stoichiometric condition at a pressure of 1 atm. The Blanc data in this appendix are taken from Figure 7.6. It is remarkable that the minima of the energy curves for the various compounds occur at nearly identical values.
In many practical applications, sparks are used to ignite flowing combustible mixtures. Increasing the flow velocity past the electrodes increases the energy required for ignition. The flow blows the spark downstream, lengthens the spark path, and causes the energy input to be distributed over a much larger volume [13]. Thus, the minimum energy in a flow system is greater than that under a stagnant condition.

From a safety point of view, one is also interested in grain elevator and coal dust explosions. Such explosions are not analyzed in this text, and the reader is referred to the literature [18]. However, many of the thermal concepts discussed for homogeneous gas-phase ignition will be fruitful in understanding the phenomena that control dust ignition and explosions.
7.4.2. Ignition by Adiabatic Compression and Shock Waves
Ignition by sparks occurs in a very local region and spreads by flame characteristics throughout the combustible system. If an exoergic system at standard conditions is adiabatically compressed to a higher pressure and hence to a higher temperature, the gas-phase system will explode. There is little likelihood that a flame will propagate in this situation. Similarly, a shock wave can propagate through the same type of mixture, rapidly compressing and heating the mixture to an explosive condition. As discussed in Chapter 5, a detonation will develop under such conditions only if the test section is sufficiently long.
Ignition by compression is similar to the conditions that generate knock in a spark-ignited automotive engine. Thus, it would indeed appear that compression ignition and knock are chain-initiated explosions. Many have established the onset of ignition with a rapid temperature rise over and above that expected due to compression. Others have used the onset of some visible radiation or, in the case of shock tubes, a certain limit concentration of hydroxyl radical formation identified by spectroscopic absorption techniques. The observations and measurement techniques are interrelated. Ignition occurs in such systems in the 1000 K temperature range. However, it must be realized that in hydrocarbon–air systems, the rise in temperature due to exothermic energy release of the reacting mixture occurs most sharply when the carbon monoxide, which eventually forms, is converted to carbon dioxide. This step is the most exothermic of all the conversion steps of the fuel–air mixture to products [19]. Indeed, the early steps of the process are overall isoergic owing to the simultaneous oxidative pyrolysis of the fuel, which is endothermic, and the conversion of some of the hydrogen formed to water, which is an exothermic process [19].
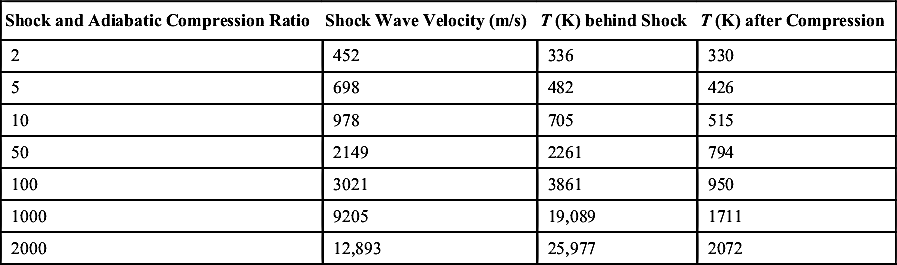
Shock waves are an ideal way of obtaining induction periods for high-temperature—high-pressure conditions. Since a shock system is nonisentropic, a system at some initial temperature and pressure condition brought to a final pressure by the shock wave will have a higher temperature than a system in which the same mixture at the same initial conditions is brought by adiabatic compression to the same pressure. Table 7.1 compares the final temperatures for the same ratios of shock and adiabatic compression for air.
7.5. Other Ignition Concepts
The examples that appeared in the section entitled Thermal Spontaneous Ignition were with regard to linseed and tung oils, damp leaves, and pulverized coal. In each case, a surface reaction occurred. To be noted is the fact that the analyses that set the parameters for determining the ignition condition do not contain a time scale. In essence then, the concept of spontaneity should not be considered in the same context as rapidity. Dictionaries [20] define spontaneous combustion as “the ignition of a substance or body from the rapid oxidation of its constituents, without heat from any external source.” This definition would be ideal if the word “rapid” were removed.
Oil spills on an ocean or oil on a beach also react with oxygen in air. Considering there is always moisture in the air, it is not surprising the coating one observes on fuels when one steps on an oil globule on the beach has been found to be an organic hydrocarbon peroxide (R–OOH, Chapter 3, Section 3.5). It is obvious during the oxidative process that the mass of fuel concerned in these cases can readily absorb the heat released in the peroxide formation so that any thermal rise is not sufficient to cause rapid reaction. One can then realize from the considerations in Sections 7.2–7.4 that for different substances, their configurations, ambient conditions, etc., can affect what causes an ignition process to take hold. These factors are considered extensively in the Ignition Handbook [21], which also contains many references.
Table 7.1
Compression versus Shock-Induced Temperaturea
| Shock and Adiabatic Compression Ratio | Shock Wave Velocity (m/s) | T (K) behind Shock | T (K) after Compression |
| 2 | 452 | 336 | 330 |
| 5 | 698 | 482 | 426 |
| 10 | 978 | 705 | 515 |
| 50 | 2149 | 2261 | 794 |
| 100 | 3021 | 3861 | 950 |
| 1000 | 9205 | 19,089 | 1711 |
| 2000 | 12,893 | 25,977 | 2072 |
7.5.1. Hypergolicity and Pyrophoricity
There are practical cases in which instantaneous ignition must occur or there would be a failure of the experimental objective. The best example would be the necessity to instantaneously ignite the injection of liquid oxygen and liquid hydrogen in a large booster rocket. Instantaneous in this case means in a time scale that a given amount of propellants that can accumulate and still be ignited would not destroy the rocket due to a pressure rise much greater than the pressure for which the chamber was designed. This effect, called delayed ignition, was the nemesis of early rocket research. One approach to the liquid H2–liquid O2 case has been to inject triethyl aluminum (TEA), a liquid, with the injection of the fuels. Because of the electronic structure of the aluminum atom, TEA instantaneously reacts with the oxygen. In general, those elements whose electronic structure show open d-orbitals [22,23] in their outer electron ring show an affinity for reaction, particularly with oxygen. In the rocket field, TEA is referred to as a hypergolic propellant. Many of the storable (noncryogenic) propellants are hypergolic, particularly when red fuming nitric acid, which is saturated with nitrogen tetroxide (N2O4), is mixed with unsymmetrical dimethyl hydrazine (UDMH). The acids attach to any weakly bound hydrogen atoms in the fuels, similar to an acid–base reaction, and initiate overall combustion.
In the case of supersonic combustion ramjet devices, instantaneous ignition must occur because the flow time in the constant area duct that comprises the ramjet chamber is short. As noted in Chapter 1, supersonic combustion simply refers to the flow condition and not to any difference in the chemical reaction mechanism from that in subsonic ramjet devices. What is unusual in supersonic combustion because of the typical flow condition is that the normal ignition time is usually longer than the reaction time. To assure rapid ignition in this case, many have proposed the injection of silane (SiH4), which is hypergolic with the oxygen in air. Since exposure of silane in a container to air causes an instant flame process, many refer to silane as pyrophoric. It is interesting to note that dictionaries define pyrophoric as “capable of igniting spontaneously in air” [20]. Notice the use of “spontaneously.”
The term pyrophoric has usually been applied to the ignition of very fine sizes of metal particles. Except for the noble metals, most metals when refined and exposed to air form an oxide coat. Generally, this coating thickness is of the order of 25 Å. If the oxide coat formed is of a size greater than that of the pure metal consumed, then the coat scales and the nascent metal are prone to continuously oxidize. Iron is a case in point and is the reason why pure iron rusts.
The ratio of the molar volume of oxide formed to the molar volume of metal consumed is called the Pilling and Bedworth number (or the Pilling–Bedworth ratio). When the number is >1, the metal rusts. Aluminum and magnesium are the best examples of metals that do not rust because a protective oxide coat forms, that is, they have a Pilling to Bedworth number of 1. Scratch an aluminum ladder and notice a bright fissure forms and quickly self-coats. The heat release in the sealing aluminum oxide is dissipated to the ladder structure.
Aluminum particles in solid propellant rockets do not burn in the same manner as do aluminum wires that carry electric currents. The question arises at what temperature do these materials burst into flames. First, the protective oxide coat must be weakened and permeated and second, the temperature must be sufficient to vaporize the exposed surface of the nascent metal. The metal vapor, which reacts with the oxidizer present, must reach a temperature that will retain the vaporization of the metal. As will be discussed more extensively in Chapter 9, it is known that the temperature created by the formation of the metal–oxidizer reaction has the unique property, if the oxidizer is pure oxygen, to be equal to the boiling point (really the vaporization point) of the metal oxide at the process pressure. The vaporization temperature of the oxide then must be greater than the vaporization temperature of the metal. Those metal particles that meet this criterion burn very much like a liquid hydrocarbon droplet. Some metals do not meet this criterion, and their transformation into an oxide is vastly different from those that meet the criterion, which many refer to as Glassman's Criterion for Vapor Phase Combustion of Metals. The temperature and conditions that lead to the ignition of those metals that burn in the vapor phase are given in the Ignition Handbook [21] where again numerous references can be found.
It is with the understanding of the above that one can give some insight into what establishes the pyrophoricity of small metal particles. The term pyrophoricity should pertain to the instantaneous combustibility of fine metal particles that have no oxide coat. This prevention of coating is achieved by keeping the particles formed and stored in an inert atmosphere such as argon. Nitrogen is not used because nitrides can be formed. When exposed to air, the fine metal particle cloud instantaneously bursts into a flame. Thus, it has been proposed [22] that a metal be considered pyrophoric when in its nascent state (no oxide coat) it is small enough that the initial oxide coat that forms due to heterogeneous reaction with air under ambient conditions generates sufficient heat to vaporize the remaining metal. Metal vapors thus exposed are extremely reactive with oxidizing media and are consumed rapidly.
Although pyrophoric metals can come in various shapes (spherical, porous spheres, or flakes), the calculation to be shown will be based on spherical particles. Since it is the surface area to volume ratio that determines the critical condition, it would be obvious for a metal flake (which would be pyrophoric) to have a smaller mass than a sphere of the same metal. Due to surface temperature, however, pyrophoric flakes will become spheres as the metal melts.
Stated physically, the critical condition for pyrophoricity under the proposed assumptions is that the heat release of the oxide coat formed on a nascent sphere at the ambient temperature must be sufficient to heat the metal to its vaporization point and supply enough heat to vaporize the remaining metal. In such an approach, one must take into account the energy necessary to raise the metal from the ambient temperature to the vaporization temperature. If r is assumed to be the radius of the metal particle and δ the thickness of the oxide coat [(r − δ) is the pure metal radius], then the critical heat balance for pyrophoricity contains three terms:
1. 
2. 
3. 
where  is the standard state heat of formation of the oxide at 298K, Ho is the standard state enthalpy at temperature T, “bpt” specifies the metal vaporization temperature, and the subscripts “m” and “ox” refer to the metal and oxide, respectively. At the critical condition, the term (1) must be equal to the sum of the terms (2) and (3). This equality can be rearranged and simplified to give the form

Considering the right-hand side of this equation as a simple mathematical function, it can be plotted versus (δ/r). The left-hand side is known for a given metal; it contains known thermochemical and thermophysical properties; thus, (δ/r) is determined. The mass of the oxide formed is greater than the mass of the metal consumed, and consequently the original size of the metal that would be pyrophoric (rm) can be calculated from δ, r, and the physical properties of the oxide and metal and their molecular weights. These results have been presented in the form as given in Figure 7.7 [22]. The important result is simply that the smaller the value of (δ/r), the greater the pyrophoric tendency of the metal. The general size of those particles that are pyrophoric is of the order 0.01 μm [22]. It is further interesting to note that all metals that have values of (δ/r) <0.2 meet Glassman's criterion for vapor phase combustion of metals regardless of size (see Chapter 9). Indeed, Figure 7.7 gives great insight into metal combustion and the type of metal dust explosions that have occurred. One can conclude that only those metals that have a (δ/r) value <0.2 are the ones prone to dust type explosions.

7.5.2. Catalytic Ignition
Consideration with respect to hydrazine ignition forms the basis of an approach to some understanding of catalytic ignition. Although hydrazine and its derivative UDMH are normally the fuels in storable liquid propellant rockets because they are hypergolic with nitric oxides as discussed in the last section, hydrazine is also frequently used as a monopropellant. To retain the simplicity of a monopropellant rocket to use for control purposes or a backpack lift for an astronaut, the ability to catalytically ignite the hydrazine becomes a necessity. Thus, small hydrazine monopropellant rockets contain in their chamber large surface area configurations in which iridium metal, molybdenum oxide, or platinum is supported. Injection of hydrazine in such a rocket chamber immediately initiates hydrazine decomposition, and the heat release then helps to sustain the decomposition.
The purpose here is not to consider the broad field of catalysis, but simply point out where ignition is important with regard to exothermic decomposition both with regard to sustained decomposition and consideration of safety in handling of such chemicals. Wolfe [23] found that copper, chromium, manganese, nickel, and iron enhanced hydrazine decomposition and that cadmium, zinc, magnesium, and aluminum did not. If one examines the electronic structure of these metals, one will note that noncatalysts have either no d subshells or complete d subshell orbitals [24]. In hydrazine decomposition ignition on the catalytic surfaces mentioned, one step seems to form bonds between the N atoms in hydrazine and incomplete d-orbitals of the metal. This bonding initiates dissociation of the hydrazine and subsequent decomposition and heat release.
It is generally believed then that with metals the electronic configuration in particular the d-band is an index of catalytic activity [24]. In this theory, it is believed that in the absorption of the gas on the metal surface, electrons are donated by the gas to the d-band of the metal, thus filling the fractional deficiencies or holes in the d-band. Obviously, noble metal surfaces are particularly best for catalytic initiation or ignition, as they do not have the surface oxide layer formation discussed in the previous sections.
In catalytic combustion or any exothermic decomposition, thermal aspects can dominate the continued reacting process particularly since the catalytic surface will also rise in temperature.
Problems
(Those with an asterisk require a numerical solution.)
1. The reported decomposition of ammonium nitrate indicates that the reaction is unimolecular and that the rate constant has an A factor of 1013.8 and an activation energy of 170 kJ/mol. Using this information, determine the critical storage radius at 160 °C. Report the calculation so that a plot of rcrit versus T0 can be obtained. Take a temperature range from 80 to 320 °C.
2. Concisely explain the difference between chain and thermal explosions.
3. Are liquid droplet ignition times appreciably affected by droplet size? Explain.
4. The critical size for the storage of a given solid propellant at a temperature of 325 K is 4.0 m. If the activation energy of the solid reacting mixture were 185 kJ/mol, what critical size would hold for 340 K?
5. A fuel–oxidizer mixture at a given temperature T0 = 550 K ignites. If the overall activation energy of the reaction is 240 kJ/mol, what is the true ignition temperature Ti? How much faster is the reaction at Ti compared to that at T0? What can you say about the difference between Ti and T0 for a very large activation energy process?
6. Verify the result in Table 7.1 for the condition in which the shock and compression ratio is 5. Consider the gas to be air in which the ratio of specific heats is 1.385.
7. ∗Calculate the ignition delays of a dilute H2/O2 mixture in Ar as a function of initial mixture temperature at a pressure of 5 atm for a constant pressure adiabatic system. The initial mixture consists of H2 with a mole fraction of 0.01 and O2 with a mole fraction of 0.005. The balance of the mixture is argon. Make a plot of temperature versus time for a mixture initially at 1100 K and determine a criterion for determining ignition delays. Also plot the species moles fractions of H2, O2, H2O, OH, H, O, HO2, and H2O2 as a function of time for this condition. Discuss the behavior of the species profiles. Plot the sensitivities of the temperature profile to variations in the A-factors of each of the reactions and identify the two most important reactions during the induction period and reaction. Determine the ignition delays at temperatures of 850, 900, 950, 1000, 1050, 1100, 1200, 1400, and 1600 K and make a plot of ignition delay versus inverse temperature. Describe the trend observed in the ignition delay profile. How is it related to the H2/O2 explosion limits? What is the overall activation energy?
..................Content has been hidden....................
You can't read the all page of ebook, please click here login for view all page.