
4.4. Stability Limits of Laminar Flames
There are two types of stability criteria associated with laminar flames. The first is concerned with the ability of the combustible fuel–oxidizer mixture to support flame propagation and is strongly related to the chemical rates in the system. In this case, a point can be reached for a given limit mixture ratio in which the rate of reaction and its subsequent heat release are not sufficient to sustain reaction and thus propagation. This type of stability limit includes (1) flammability limits in which gas-phase losses of heat from limit mixtures reduce the temperature, rate of heat release, and the heat feedback, so that the flame is not permitted to propagate; and (2) quenching distances in which the loss of heat to a wall and radical quenching at the wall reduce the reaction rate so that it cannot sustain a flame in a confined situation such as propagation in a tube.
The other type of stability limit is associated with the mixture flow and its relationship to the laminar flame itself. This stability limit, which includes the phenomena of flashback, blowoff, and the onset of turbulence, describes the limitations of stabilizing a laminar flame in a real experimental situation.
4.4.1. Flammability Limits
The explosion limit curves presented earlier and most of those that appear in the open literature are for a definite fuel–oxidizer mixture ratio, usually stoichiometric. For the stoichiometric case, if an ignition source is introduced into the mixture even at a very low temperature and at reasonable pressures (e.g., ∼1 atm), the gases about the ignition source reach a sufficient temperature so that the local mixture moves into the explosive region and a flame propagates. This flame, of course, continues to propagate even after the ignition source is removed. There are mixture ratios, however, that will not self-support the flame after the ignition source is removed. These mixture ratios fall at the lean and rich end of the concentration spectrum. The leanest and richest concentrations that will just self-support a flame are called the lean and rich flammability limits, respectively. The primary factor that determines the flammability limit is the competition between the rate of heat generation, which is controlled by the rate of reaction and the heat of reaction for the limit mixture, and the external rate of heat loss by the flame.
Table 4.3
Flammability Limits of Some Fuels in Aira
| Lean (lower) | Rich (Upper) | Stoichiometric | |
| Methane | 5 | 15 | 9.47 |
| Heptane | 1 | 6.7 | 1.87 |
| Hydrogen | 4 | 75 | 29.2 |
| Carbon monoxide | 12.5 | 74.2 | 29.5 |
| Acetaldehyde | 4.0 | 60 | 7.7 |
| Acetylene | 2.5 | 100 | 7.7 |
| Carbon disulfide | 1.3 | 50 | 7.7 |
| Ethylene oxide | 3.6 | 100 | 7.7 |

Some attempts to standardize the determination of flammability limits have been made. Coward and Jones [29] recommended that a 2-inch glass tube about 4 feet long be employed; such a tube should be ignited by a spark a few millimeters long or by a small naked flame. The high-energy starting conditions are such that weak mixtures will be sure to ignite. The large tube diameter is selected because it gives the most consistent results. Quenching effects may interfere in tubes of small diameter. Large diameters create some disadvantages since the quantity of gas is a hazard and the possibility of cool flames exists. The 4-foot length is chosen to allow an observer to truly judge whether the flame will propagate indefinitely.
It is important to specify the direction of flame propagation. Since it may be assumed as an approximation that a flame cannot propagate downward in a mixture contained within a vertical tube if the convection current it produces is faster than the speed of the flame, the limits for upward propagation are usually slightly wider than those for downward propagation or those for which the containing tube is in a horizontal position.
Table 4.3 lists some upper and lower flammability limits (in air) taken from Refs [24,25] for some typical combustible compounds. Data for other fuels are given in Appendix E including flammability limits in both air and oxygen.
In view of the accelerating effect of temperature on chemical reactions, it is reasonable to expect that limits of flammability should be broadened if the temperature is increased. This trend is confirmed experimentally. The increase is slight and it appears to give a linear variation for hydrocarbons.
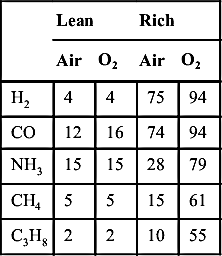
As noted from the data in Appendix E, the upper limit for many fuels is about three times stoichiometric and the lower limit is about 50% of stoichiometric. Generally, the upper limit is higher than that for detonation. The lower (lean) limit of a gas is the same in oxygen as in air owing to the fact that the excess oxygen has the same heat capacity as nitrogen. The higher (rich) limit of all flammable gases is much greater in oxygen than in air, owing to higher temperature, which comes about from the absence of any nitrogen. Hence, the range of flammability is always greater in oxygen. Table 4.4 shows this effect.
Table 4.4
Comparison of Oxygen and Air Flammability Limitsa
| Lean | Rich | |||
| Air | O2 | Air | O2 | |
| H2 | 4 | 4 | 75 | 94 |
| CO | 12 | 16 | 74 | 94 |
| NH3 | 15 | 15 | 28 | 79 |
| CH4 | 5 | 5 | 15 | 61 |
| C3H8 | 2 | 2 | 10 | 55 |
As increasing amounts of an incombustible gas or vapor are added to the atmosphere, the flammability limits of a gaseous fuel in the atmosphere approach one another and finally meet. Inert diluents such as CO2, N2, or Ar merely replace part of the O2 in the mixture, but these inert gases do not have the same extinction power. It is found that the order of efficiency is the same as that of the heat capacities of these three gases:
![]()
For example, the minimum percentage of oxygen that will permit flame propagation in mixtures of CH4, O2, and CO2 is 14.6%; if N2 is the diluent, the minimum percentage of oxygen is less and equals 12.1%. In the case of Ar, the value is 9.8%. As discussed, when a gas of higher specific heat is present in sufficient quantities, it will reduce the final temperature, thereby reducing the rate of energy release that must sustain the rate of propagation over other losses.
It is interesting to examine in more detail the effect of additives as shown in Figure 4.24 [25]. As discussed, the general effect of the nonhalogenated additives follows the variation in the molar specific heat; that is, the greater the specific heat of an inert additive, the greater the effectiveness. Again, this effect is strictly one of lowering the temperature to a greater extent; this was verified as well by flammability measurements in air where the nitrogen was replaced by carbon dioxide and argon. Figure 4.24, however, represents the condition in which additional species were added to the air in the fuel–air mixture. As noted in Figure 4.24, rich limits are more sensitive to inert diluents than lean limits; however, species such as halogenated compounds affect both limits, and this effect is greater than that expected from heat capacity alone. Helium addition extends the lean limit somewhat because it increases the thermal diffusivity and thus the flame speed.
That additives affect the rich limit more than the lean limit can be explained by the important competing steps for possible chain branching. When the system is rich (Chapter 3, reaction (3.27)),

![]() (4.66)
(4.66)
![]() (4.64)
(4.64)
The recombination (reaction (4.66)) increases with decreasing temperature and increasing concentration of the third body M. Thus, the more diluent added, the faster this reaction is compared to the chain branching step (reaction (4.64)). This aspect is also reflected in the overall activation energy found for rich systems compared with lean systems. Rich systems have a much higher overall activation energy and therefore a greater temperature sensitivity.
The effect of all halogen compounds on flammability limits is substantial. The addition of only a few percent can make some systems nonflammable. These observed results support the premise that the effect of halogen additions is not one of dilution alone, but rather one in which the halogens act as catalysts in reducing the H atom concentration necessary for the chain branching reaction sequence. Any halogen added—whether in elemental form, as hydrogen halide, or bound in an organic compound—will act in the same manner. Halogenated hydrocarbons have weak carbon–halogen bonds that are readily broken in flames of any respectable temperature, thereby placing a halogen atom in the reacting system. This halogen atom rapidly abstracts a hydrogen from the hydrocarbon fuel to form the hydrogen halide; then the following reaction system, in which X represents any of the halogens F, Cl, Br, or I, occurs:
![]() (4.67)
(4.67)
![]() (4.68)
(4.68)
![]() (4.69)
(4.69)
![]()
and thus it is seen that X is a homogeneous catalyst for recombination of the important H atoms. What is significant in the present context is that the halide reactions above are fast compared with the other important H atom reactions such as
![]() (4.64)
(4.64)
or
![]() (4.70)
(4.70)
This competition for H atoms reduces the rate of chain branching in the important H + O2 reaction. The real key to this type of inhibition is the regeneration of X2, which permits the entire cycle to be catalytic.
Because sulfur dioxide (SO2) essentially removes O atoms catalytically by the mechanism
![]() (4.71)
(4.71)
![]() (4.72)
(4.72)
and also by H radical removal by the system
![]() (4.73)
(4.73)
![]() (4.74)
(4.74)
and by
![]() (4.75)
(4.75)
![]() (4.76)
(4.76)
![]() (4.77)
(4.77)
SO2 is similarly a known inhibitor that affects flammability limits. These catalytic cycles (reactions (4.71) and (4.72), reactions (4.73) and (4.74), and reactions (4.75)–(4.77)) are equivalent to
![]()
![]()
![]()
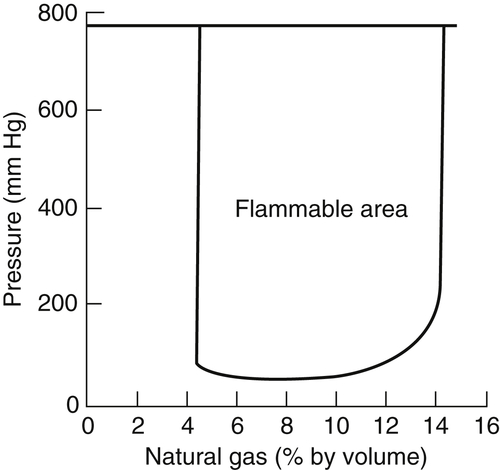
The behavior of flammability limits at elevated pressures can be explained satisfactorily. For simple hydrocarbons (ethane, propane, …, pentane), it appears that the rich limits extend almost linearly with increasing pressure at a rate of about 0.13 vol%/atm; the lean limits, on the other hand, are at first extended slightly and thereafter narrowed as pressure is increased to 6 atm. In all, the lean limit appears not to be affected appreciably by the pressure. Figure 4.25 for natural gas in air shows the pressure effect for conditions above atmospheric.
Most early studies of flammability limits at reduced pressures indicated that the rich and lean limits converge as the pressure is reduced until a pressure is reached below which no flame will propagate. However, this behavior appears to be due to wall quenching by the tube in which the experiments were performed. As shown in Figure 4.26, the limits are actually as wide at low pressure as at 1 atm, provided the tube is sufficiently wide and an ignition source can be found to ignite the mixtures. Consequently, the limits obtained at reduced pressures are not generally true limits of flammability, since they are influenced by the tube diameter. Therefore, these limits are not physicochemical constants of a given fuel. Rather, they are limits of flame propagation in a tube of specified diameter.
In examining the effect of high pressures on flammability limits, it has been assumed that the limit is determined by a critical value of the rate of heat loss to the rate of heat development. Consider, for example, a flame anchored on a Bunsen tube. The loss to the anchoring position is small, and thus the radiation loss must be assumed to be the major heat loss condition. This radiative loss is in the infrared, owing primarily to the band radiation systems of CO2, H2O, and CO. The amount of product composition changes owing to dissociation at the flammability limits is indeed small, so there is essentially no increase in temperature with pressure. Even so, with temperatures near the limits and wavelengths of the gaseous radiation, the radiation bands lie near or at the maximum of the energy density radiation distribution given by Planck's law. If λ is the wavelength, λmaxT equals a constant, by Wien’s law. Thus, the radiant loss varies as T5. But for most hydrocarbon systems the activation energy of the reaction media and temperature are such that the variation of exp(−E/RT) as a function of temperature is much like a T5 variation [30]. Thus, any effect of pressure on temperature shows a balance of these loss and gain terms, except that the actual radiation contains an emissivity term. Because of band system broadening and emitting gas concentration, this emissivity is approximately proportional to the total pressure for gaseous systems. Then, as the pressure increases, the emissivity and heat loss increase monotonically. On the fuel-rich side the reaction rate is second-order and the energy release increases with P2 as compared with the heat loss that increases with P. Thus, the richness of the system can be increased as the pressure increases before extinction occurs [30]. For the methane flammability results reported in Figure 4.25, the rich limit clearly broadens extensively and then begins to level off as the pressure is increased over a range of about 150 atm. The leveling-off happens when soot formation occurs. The soot increases the radiative loss. The lean limit appears not to change with pressure, but indeed broadens by about 25% over the same pressure range. Note that over a span of 28 atm, the rich limit broadens about 300% and the lean limit only about 1%. There is no definitive explanation of this difference; but considering the size, it could possibly be related to the temperature because of its exponential effect on the energy release rate and the emissive power of the product gases. The rule of thumb quoted earlier that the rich limit is about three times the stoichiometric value and the lean limit half the stoichiometric value can be rationalized from the temperature effect. Burning near the rich limit generates mostly diatomic products—CO and H2—and some H2O. Burning near the lean limit produces CO2 and H2O exclusively. Thus, for the same percentage composition change, regardless of the energy effect, the fuel-rich side temperature will be higher than the lean side temperature. As was emphasized in Chapter 1, for hydrocarbons the maximum flame temperature occurs on the fuel-rich side of stoichiometric owing to the presence of diatomics, particularly H2. Considering percentage changes due to temperature, the fuel side flammability limit can broaden more extensively as one increases the pressure to account for the reaction rate compensation necessary to create the new limit. Furthermore, the radiative power of the fuel-rich side products is substantially less than that of the lean side because the rich side contains only one diatomic radiator and a little water, whereas the lean side contains exclusively triatomic radiators.

The fact that flammability limits have been found [29] to be different for upward and downward propagation of a flame in a cylindrical tube if the tube is large enough could be an indication that heat losses [30,31] are not the dominant extinction mechanism specifying the limit. Directly following a discourse by Ronney [32], it is well first to emphasize that buoyancy effects are an important factor in the flammability limits measured in large cylindrical tubes. Extinction of upward-propagating flames for a given fuel–oxidizer mixture ratio is thought to be due to flame stretch at the tip of the rising hemispherical flame [33,34]. For downward propagation, extinction is thought to be caused by a cooling, sinking layer of burned gases near the tube wall that overtakes the weakly propagating flame front whose dilution leads to extinction [35,36]. For small tubes, heat loss to walls can be the primary cause for extinction; indeed, such wall effects can quench the flames regardless of mixture ratio. Thus, as a generalization, flammability limits in tubes are probably caused by the combined influences of heat (and radical) losses to the tube wall, buoyancy-induced curvature and strain, and even Lewis number effects. Because of the difference in these mechanisms, it has been found that the downward propagation limits can sometimes be wider than the upward limits, depending upon the degree of buoyancy and Lewis number.
It is interesting that experiments under microgravity conditions [37,38] reveal that the flammability limits are different from those measured for either upward or downward propagation in tubes at normal gravity. Upon comparing theoretical predictions [30] to such experimental measurements as the propagation rate at the limit and the rate of thermal decay in the burned gases, Ronney [39] suggested that radiant heat loss is probably the dominant process leading to flame extinction at microgravity.
Ronney [39] concludes that, although surprising, the completely different processes dominating flammability limits at normal gravity and microgravity are readily understandable in light of the time scales of the processes involved. He showed that the characteristic loss rate time scale for upward-propagating flames in tubes (τu), downward-propagating flames (τd), radiative losses (τr), and conductive heat losses to the wall (τc) scale as (d/g)1/2, α/g2, ρcpTf/E, and d2/α, respectively. The symbols not previously defined are d, the tube diameter; g, the gravitational acceleration; α, the thermal diffusivity, and E, the radiative heat loss per unit volume. Comparison of these time scales indicates that for any practical gas mixture, pressure, and tube diameter, it is difficult to obtain τr < τu or τr < τd at normal gravity; thus, radiative losses are not as important as buoyancy-induced effects under this condition. At microgravity, τu and τd are large, but still τr must be less than τc, so radiant effects are dominant. In this situation, large tube diameters are required.
4.4.2. Quenching Distance
Wall quenching affects not only flammability limits but also ignition phenomena (see Chapter 7). The quenching diameter, dT, which is the parameter given the greatest consideration, is generally determined experimentally in the following manner. A premixed flame is established on a burner port and the gas flow is suddenly stopped. If the flame propagates down the tube into the gas supply source, a smaller tube is substituted. The tube diameter is progressively decreased until the flame cannot propagate back to the source. Thus, the quenching distance, or diameter dT, is the diameter of the tube that just prevents flashback.
A flame is quenched in a tube when the two mechanisms that permit flame propagation—diffusion of species and of heat—are affected. Tube walls extract heat: the smaller the tube, the greater is the surface area to volume ratio within the tube and hence the greater is the volumetric heat loss. Similarly, the smaller the tube, the greater the number of collisions of the active radical species that are destroyed. Since the condition and the material composition of the tube wall affect the rate of destruction of the active species [5], a specific analytical determination of the quenching distance is not feasible.
Intuition would suggest that an inverse correlation would be obtained between flame speed and quenching diameter. Since flame speed SL varies with equivalence ratio ϕ, so dT should vary with ϕ; however, the curve of dT would be inverted compared with that of SL, as shown in Figure 4.27.
One would also expect, and it is found experimentally, that increasing the temperature would decrease the quenching distance. This trend arises because the heat losses are reduced with respect to heat release, and species are not as readily deactivated. However, sufficient data are not available to develop any specific correlation.
It has been concretely established and derived theoretically [30] that quenching distance increases as pressure decreases; in fact, the correlation is almost exactly
![]()
for many compounds. For various fuels, P sometimes has an exponent less than 1. An exponent close to one in the dT ∼ 1/P relationship can be explained as follows. The mean free path of gases increases as pressure decreases; thus, there are more collisions with the walls and more species are deactivated. Pressure results are generally represented in the form given in Figure 4.28, which also shows that when measuring flammability limits as a function of subatmospheric pressures, one must choose a tube diameter that is greater than the dT given for the pressure. The horizontal dot-dash line in Figure 4.28 specifies the various flammability limits that would be obtained at a given subatmospheric pressure in tubes of different diameters.


4.4.3. Flame Stabilization (Low Velocity)
In the introduction to this chapter a combustion wave was considered to be propagating in a tube. When the cold premixed gases flow in a direction opposite the wave propagation and travel at a velocity equal to the propagation velocity (i.e., the laminar flame speed), the wave (flame) becomes stationary with respect to the containing tube. Such a flame would possess only neutral stability, and its actual position would drift [1]. If the velocity of the unburned mixture is increased, the flame will leave the tube and, in most cases, fix itself in some form at the tube exit. If the tube is in a vertical position, a simple burner configuration, as shown in Figure 4.29, is obtained. In essence, such burners stabilize the flame. As described earlier, these burners are so configured that the fuel and air become a homogeneous mixture before they exit the tube. The length of the tube and physical characteristics of the system are such that the gas flow is laminar in nature. In the context to be discussed here, an important aspect of the burner is that it acts as a heat and radical sink, which stabilizes the flame at its exit under many conditions. In fact, the burner rim and the area close to the tube provide the stabilization position.
When the flow velocity is increased to a value greater than the flame speed, the flame becomes conical in shape. The greater the flow velocity, the smaller is the cone angle of the flame. This angle decreases so that the velocity component of the flow normal to the flame is equal to the flame speed. However, near the burner rim the flow velocity is lower than that in the center of the tube; at some point in this area the flame speed and flow velocity equalize and the flame is anchored by this point. The flame is close to the burner rim and its actual speed is controlled by heat and radical loss to the wall. As the flow velocity is increased, the flame edge moves further from the burner, losses to the rim decrease, and the flame speed increases so that another stabilization point is reached. When the flow is such that the flame edge moves far from the rim, outside air is entrained, a lean mixture is diluted, the flame speed drops, and the flame reaches its blowoff limit.
If, however, the flow velocity is gradually reduced, this configuration reaches a condition in which the flame speed is greater than the flow velocity at some point across the burner. The flame will then propagate down into the burner so that the flashback limit is reached. Slightly before the flashback limit is reached, tilted flames may occur. This situation occurs because the back pressure of the flame causes a disturbance in the flow so that the flame can enter the burner only in the region where the flow velocity is reduced. Because of the constraint provided by the burner tube, the flow there is less prone to distortion; therefore, further propagation is prevented and a tilted flame such as that shown in Figure 4.30 is established [1].
Thus, it is seen that the laminar flame is stabilized on burners only within certain flow velocity limits. The following subsections treat the physical picture just given in more detail.
4.4.3.1. Flashback and blowoff
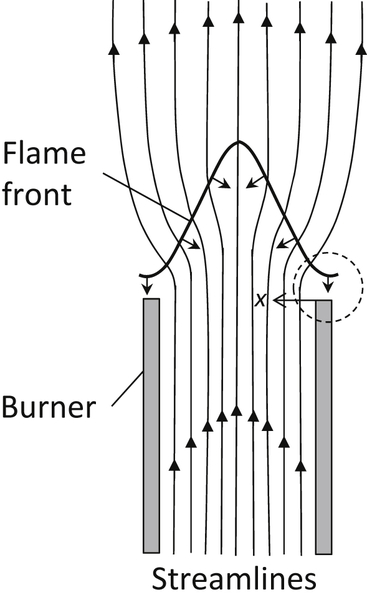
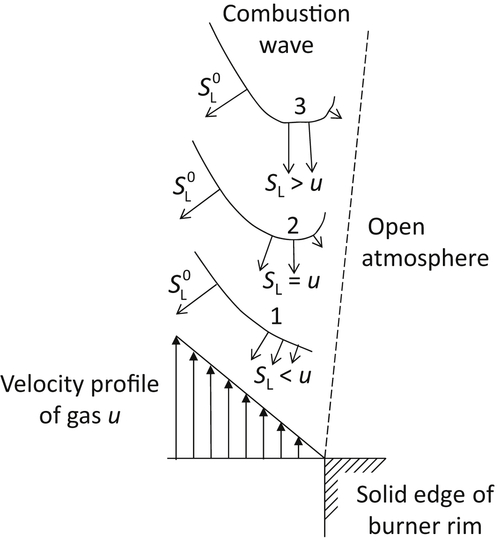
Assume Poiseuille flow in the burner tube. The gas velocity is zero at the stream boundary (wall) and increases to a maximum in the center of the stream. The linear dimensions of the wall region of interest are usually small; In slow-burning mixtures such as methane and air, they are of the order of 1 mm. Since the burner tube diameter is usually large in comparison, as shown in Figure 4.31, the gas velocity near the wall can be represented by an approximately linear vector profile. Figure 4.31 represents the conditions in the area where the flame is anchored by the burner rim. Further assume that the flow lines of the fuel jet are parallel to the tube axis, that a combustion wave is formed in the stream, and that the fringe of the wave approaches the burner rim closely. Along the flame wave profile, the burning velocity attains its maximum value  . Toward the fringe, the burning velocity decreases as heat and chain carriers are lost to the rim. If the wave fringe is close to the rim (position 1 in Figure 4.31), the burning velocity in any flow streamline is smaller than the gas velocity and the wave is driven farther away by gas flow. As the distance from the rim increases, the loss of heat and chain carriers decreases and the burning velocity becomes larger. Eventually, a position is reached (position 2 in Figure 4.31) in which the burning velocity is equal to the gas velocity at some point of the wave profile. The wave is now in equilibrium with respect to the solid rim. If the wave is displaced to a larger distance (position 3 in Figure 4.31), the burning velocity at the indicated point becomes larger than the gas velocity, and the wave moves back to the equilibrium position.
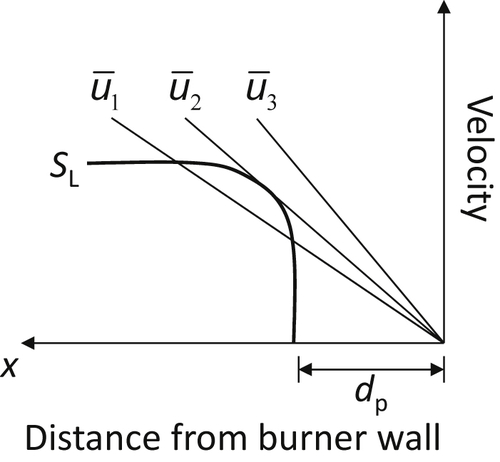
Consider Figure 4.32, a graph of flame velocity SL as a function of distance, for a wave inside a tube. In this case, the flame has entered the tube. The distance from the burner wall is called the penetration distance dp (half the quenching diameter dT). If  is the mean velocity of the gas flow in the tube and the line labeled is the graph of the velocity profile near the tube wall, the local flame velocity is not greater than the local gas velocity at any point; therefore, any flame that finds itself inside the tube will then blow out of the tube. At a lower velocity
  , which is just tangent to the SL curve, a stable point is reached. Then is the minimum mean velocity before flashback occurs. The line for the mean velocity
  indicates a region where the flame speed is greater than the velocity in the tube represented by ; in this case, the flame does flash back. The gradient for flashback, gF, is SL/dp. Analytical developments [30] show that
![]()
Similar reasoning can apply to blowoff, but the arguments are different and less exact because nothing similar to a boundary layer exists. However, a free boundary does exist.
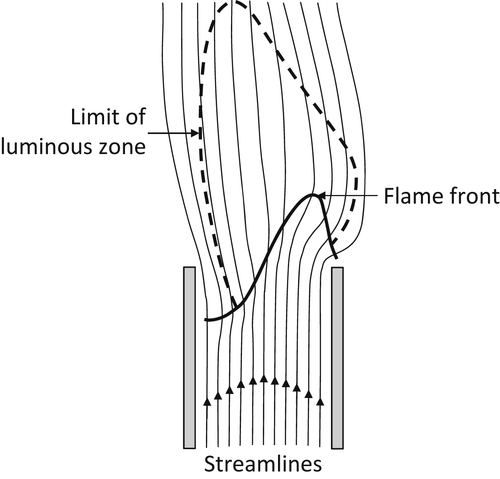
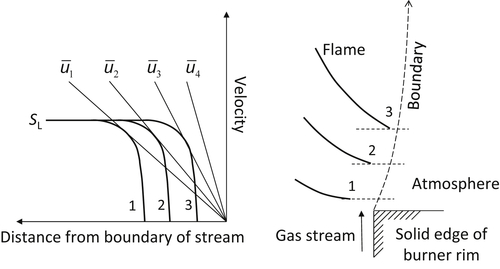
When the gas flow in the tube is increased, the equilibrium position shifts farther away from the rim. With increasing distance from the rim, a lean gas mixture becomes progressively diluted by interdiffusion with the surrounding atmosphere, and the burning velocity in the outermost streamlines decreases correspondingly. This effect is indicated by the increasing retraction of the wave fringe for flame positions 1–3 in Figure 4.33. But as the wave moves farther from the rim, it loses less heat and fewer radicals to the rim, so it can extend closer to the hypothetical edge. However, an ultimate equilibrium position of the wave exists beyond which the effect of dilution overbalances the effect of increased distance from the burner rim everywhere on the burning velocity. If the boundary layer velocity gradient is so large that the combustion wave is driven beyond this position, the gas velocity exceeds the burning velocity along every streamline, and the combustion wave blows off.
These trends are represented diagrammatically in Figure 4.33. The diagram follows the postulated trends in which  is the flame velocity after the gas has been diluted because the flame front has moved slightly past . Thus, there is blowoff, and is the blowoff velocity.
4.4.3.2. Analysis and results
The topic of concern here is the stability of laminar flames fixed to burner tubes. The flow profile of the premixed gases flowing up the tube in such a system must be parabolic; that is, Poiseuille flow exists. The gas velocity along any streamline is given by
![]()
where R is the tube radius. Since the volumetric flow rate, Q (cm3/s) is given by

then n must equal
![]()
The gradient for blowoff or flashback is defined as
![]()
then
![]()
where d is the diameter of the tube.
Most experimental data on flashback are plotted as a function of the average flashback velocity, uav,F, as shown in Figure 4.34. It is possible to estimate penetration distance (quenching thickness) from the burner wall in graphs such as Figure 4.34 by observing the cut-off radius for each mixture.
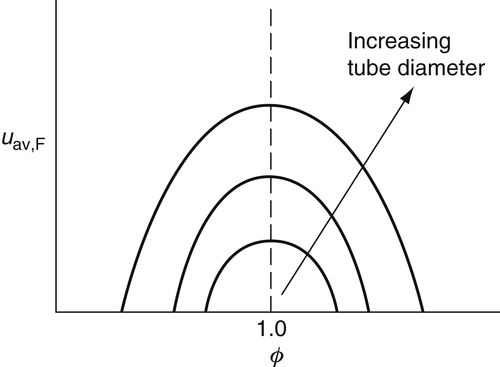

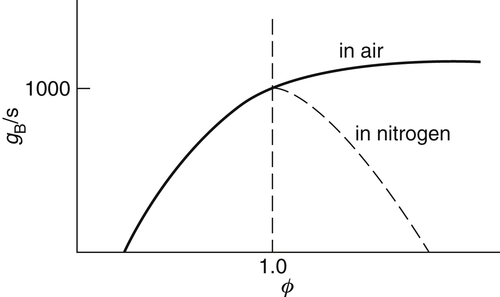
The development for the gradients of flashback and blowoff suggests a more appropriate plot of gF,B versus ϕ, as shown in Figures. 4.35 and 4.36. Examination of these figures reveals that the blowoff curve is much steeper than that for flashback. For rich mixtures the blowoff curves continue to rise instead of decreasing after the stoichiometric value is reached. The reason for this trend is that experiments are performed in air, and the diffusion of air into the mixture as the flame lifts off the burner wall increases the local flame speed of the initially fuel-rich mixture. Experiments in which the surrounding atmosphere was not air, but nitrogen, verify this explanation and show that the gB peaks at stoichiometric in this case.
The characteristics of the lifted flame are noteworthy as well. Indeed, there are limits similar to those of the seated flame [1]. When a flame is in the lifted position, a dropback takes place when the gas velocity is reduced, and the flame takes up its normal position on the burner rim. When the gas velocity is increased instead, the flame will blow out. The instability requirements of both the seated and lifted flames are shown in Figure 4.37.

4.4.4. Stability Limits and Design
The practicality of understanding stability limits is uniquely obvious when one considers the design of Bunsen tubes and cooking stoves using gaseous fuels.
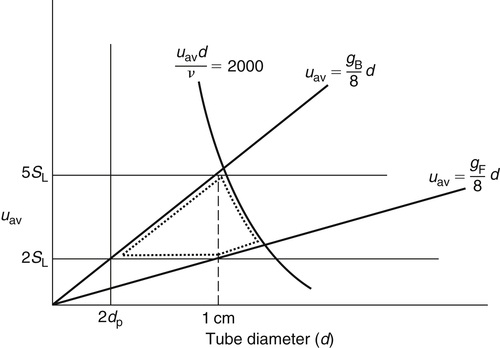
In the design of a Bunsen burner, it is desirable to have the maximum range of volumetric flow without encountering stability problems. What, then, is the optimum size tube for maximum flexibility? First, the diameter of the tube must be at least twice the penetration distance: that is, greater than the quenching distance. Second, the average velocity must be at least twice SL; otherwise, a precise Bunsen cone would not form. Experimental evidence shows further that if the average velocity is five times SL, the fuel penetrates the Bunsen cone tip. If the Reynolds number of the combustible gases in the tube exceeds 2000, the flow can become turbulent, destroying the laminar characteristics of the flame. Of course, there are the limitations of the gradients of flashback and blowoff. If one graphs uav versus d for these various limitations, one obtains a plot similar to that shown in Figure 4.38. In this figure, the dotted area represents the region that has the greatest flow variability without some stabilization problem. Note that this region d maximizes at about 1 cm; consequently, the tube diameter of Bunsen burners is always about 1 cm.
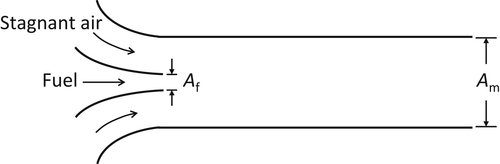
The burners on cooking stoves are much like Bunsen tubes. The fuel induces air and the two gases premix prior to reaching the burner ring with its flame holes. It is possible to idealize this situation as an ejector. For an ejector, the total gas mixture flow rate can be related to the rate of fuel admitted to the system through continuity of momentum
![]()
![]()
where the subscript m represents the conditions for the mixture (Am is the total area) and the subscript f represents conditions for the fuel. The ejector is depicted in Figure 4.39. The momentum expression can written as
![]()
where a is the area ratio.
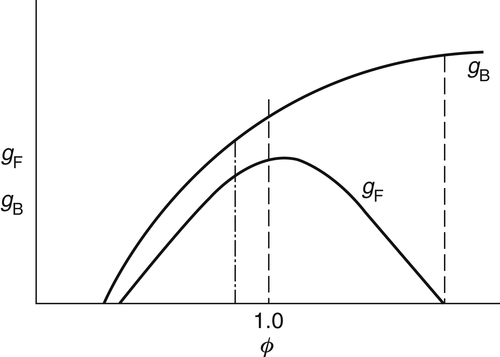
If one examines the gF and gB on the graph shown in Figure 4.40, one can make some interesting observations. The burner port diameter is fixed such that a rich-mixture ratio is obtained at a value represented by the dashed line on Figure 4.40. When the mixture ratio is set at this value, the flame can never flash back into the stove and burn without the operator's noticing the situation. If the fuel is changed, difficulties may arise. Such difficulties arose many decades ago when the gas industry switched from manufacturer's gas to natural gas, and could arise again if the industry is ever compelled to switch to synthetic gas or to use synthetic or petroleum gas as an additive to natural gas.
The volumetric fuel–air ratio in the ejector is given by
![]()
It is assumed here that the fuel–air (F/A) mixture is essentially air; that is, the density of the mixture does not change as the amount of fuel changes. From the momentum equation, this fuel–air mixture ratio becomes
![]()
The stoichiometric molar (volumetric) fuel–air ratio is strictly proportional to the molecular weight of the fuel for two common hydrocarbon fuels; that is
![]()
The equivalence ratio then is
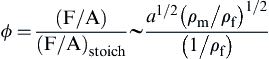
Examining Figure 4.40, one observes that in converting from a heavier fuel to a lighter fuel, the equivalence ratio drops, as indicated by the new dot-dash operating line. Someone adjusting the same burner with the new lighter fuel would have a consistent flashback-blowoff problem. Thus, when the gas industry switched to natural gas, it was required that every fuel port in every burner on every stove be drilled open, thereby increasing a to compensate for the decreased ρf. Synthetic gases of the future will certainly be heavier than methane (natural gas). They will probably be mostly methane with some heavier components, particularly ethane. Consequently, today's burners will not present a stability problem; however, they will operate more fuel-rich and thus be more wasteful of energy. It would be logical to make the fuel ports smaller by inserting caps so that the operating line would be moved next to the rich flashback cut-off line.
..................Content has been hidden....................
You can't read the all page of ebook, please click here login for view all page.