
Chapter Ten
The Hybrid Solar Power/Wind System for Energy Production, Observation, Application, and Simulation
Abstract
This study illustrates a crossbreed arrangement of the sun-oriented and wind innovation that uses the sun-powered photovoltaic cells and the wind turbine frameworks, which can be most advantageously understood through momentous researches. The sunlight-based photovoltaic, wind turbine, and the related advancements are being updated step by step. These innovations will be controlled by distinctive strategies and will be fully described in this chapter. The use of both the renewable sources of energy will also be adequately mentioned. The use of a crossbreed controller for renewable energy system will likewise be discussed in this chapter. This perception will be in contrast with the diverse variations of crossover frameworks which can help to decide on a better innovation later on. As a consequence, this section can bring about an experience of a flow pattern of examination around the globe.
Keywords
Application; Hybrid system; Simulation; Solar PV energy; Wind energy
10.1. Introduction
The sunlight-based photovoltaic (PV) and wind turbine frameworks are being used in a few applications of solid renewable energy (RE) advancements that have been perceived by many nations for a long time [1]. These advancements have the most critical contributions in ensuring the ecological and environmental conservations of the earth. In other words, it is a safe and free process by collecting the free radiant energy from the sun and free kinetic energy from the wind. There are numerous applications from these sources of renewable energies being innovated by individuals as additional usages as and when required. In future, renewable energies are the only dependable energy sources that can satisfy the global ever rising energy need. The combination of PV and wind turbine framework stands out among the most efficient means to deliver energy from RE sources [2]. In this procedure, partial tests and repeat tests are being performed to determine the best method to fully exploit those sources.
Hybrid power systems are a combination of two or more energy conversion devices (e.g., electricity generators or storage devices), or two or more energizes for the same gadget that, when incorporated, will form the hybrid power system. Framework efficiencies are normally higher than those of the individual systems independently operated and a better dependability can be obtained with the energy stockpiling advances. Some crossbreed frameworks incorporate both the hybrid power systems and the energy stockpiling advances, which can gainfully enhance the quality and accessibility of the available power so obtained [3,4].
Samples of hybrid power systems include:
1. wind energy consolidated with diesel energy,
2. PV energy consolidated with battery stockpiling or diesel energy, and
3. energy components consolidated with smaller scale turbine energy.
In the case of the wind power energy, variable wind velocities are ever present inconveniences as a result of which energy from the wind ventures cannot generate a constant flow of power for 24 h; subsequently they are viewed as “irregular” power sources [5]. In this case the preferred arrangement is to have the crossbreed framework, such as, the consolidated seaward wind and sun-oriented frameworks, otherwise called the half PV and half wind framework, which can produce constant sustainable energy when the wind and PV advancements have been properly established. Then, the sun-based energy may make up for the discontinuity of the seaward wind energy while the economies of scale created from the seaward wind energy and sun-based energy can both create a sizable cost reduction for the exploitation of available renewable power. Hybrid power plants that have been constructed economically are sunlight-based battery-diesel framework and wind-battery-diesel framework [6].
Al-Ashwal and Moghram displayed a strategy for appraisal on the premise of Loss of Load Probability for choice of an exploratory ideal extent of PV and wind generator limits in the hybrid PV/wind energy system as a result of which an optimal system blend was chosen on the premise of capital expense and yearly independence level [7]. Hennet and Samarakou examined ways to deal with the improvement on the half breed PV/wind/battery framework with the traditional power plant and computed ideal framework design on the premise of Life-Cycle Cost. The month-to-month blends of sun-oriented/wind assets lead to one-sided sunlight-based month; one-sided wind month, and months with even sun-based/wind asset. The absolute framework cost and the unit cost of power produced for a lifetime from the framework may be investigated on a yearly framework execution basis [8]. Celik presented technoeconomic analysis based on the solar/wind-based months for autonomous hybrid PV/wind energy system. The author has observed that an optimum combination of the hybrid PV/wind energy system provides a higher system performance than either of the single system individually operated, for the same system cost and battery storage capacity [9]. A decisive support model for a hybrid PV/wind energy system was discussed by Chedid et al. [10] based on the political, social, technical, and economic issues.
This study will discuss the existing model used in different countries on the solar/wind hybrid system and their applications on the power production. To identify PV/wind technology annual power production in Malaysia, the RETScreen software can be used. Finally, using LabView to simulate some PV panels maximum power point tracking (MPPT)/wind turbine for maximum power can also be performed through calculation.
10.2. Hybrid Solar/Wind Energy Systems
A hybrid renewable energy system (HRES) is a mix of low carbon energy advances that are consolidated to produce a higher energy. Hybrid energy systems are regularly utilized in smaller scale matrices, comprising renewables, for example, wind turbines, sun-based PV, and low carbon plant, such as, consolidated warmth and force frameworks to provide power. The vision behind the utilization of hybrid energy frameworks is the production of energy which is more than the aggregate of its parts [11]. The mix of distinctive power sources takes into consideration a more noteworthy efficiency of supply because of the way that they all create energy from diverse sources and this implies that the mix can invalidate any constraints brought about by a faulty gadget [12].
The HRES consists of three sections:
1. wind energy transformation framework with changeless magnet synchronous wind turbine generator, uncontrolled full extension rectifier, and proportional–integral (PI)-controlled buck converter,
2. solar energy conversion system containing solar panels, MPPT, and PI-controlled buck converter, and
3. interphase transformers (IPTs), sinusoidal pulse width modulation–controlled full bridge inverter, and three-phase transformer.
The output of those energy conversion systems are combined through the IPT to fixed DC link voltage for required input voltage of a full bridge inverter. The HRES is illustrated in Fig. 10.1 [13].
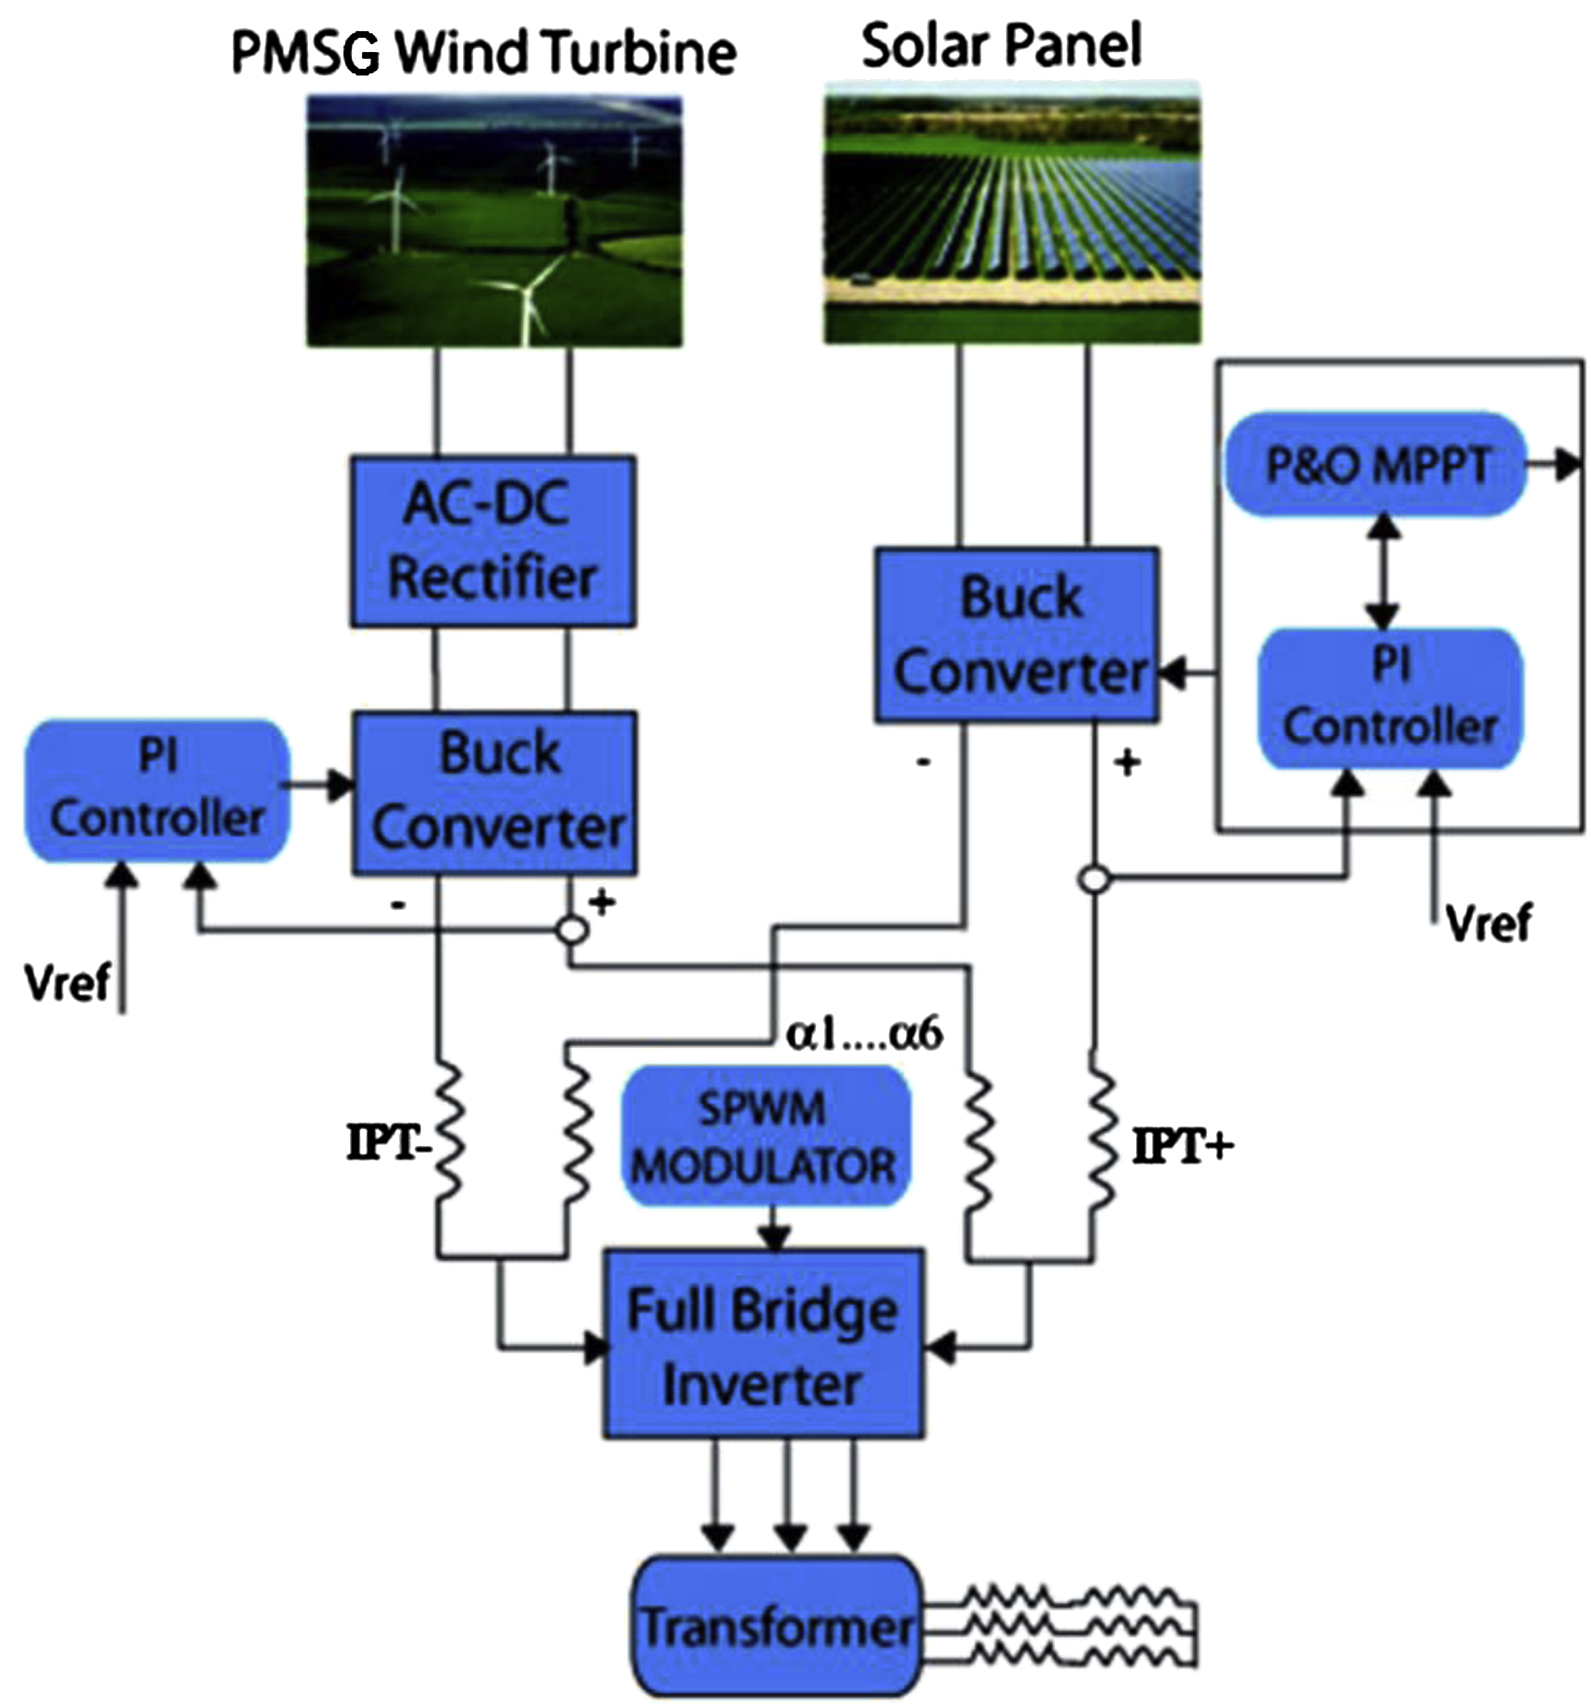
Figure 10.1 Graphical representation of the hybrid renewable energy system. MPPT, maximum power point tracking; PI, proportional–integral; PMSG, permanent-magnetic synchronous generator; SPWM, sinusoidal pulse width modulation. Reprinted from Kabalci E. Design and analysis of a hybrid renewable energy plant with solar and wind power. Journal of Energy Conversion and Management 2013;72(0):51–9 with permission from Elsevier.
10.2.1. Wind Energy Conversion System
A wind turbine framework produces energy by changing over the streaming wind speed into mechanical energy after which it is converted into power. The force contained in the wind dynamic energy is communicated by Refs. [13,14]:
![]() (10.1)
(10.1)
where A is the area traversed by the wind (m2), ρ is the air density (1.225 kg/m3), and V the wind speed (m/s).
The electrical power is given by:
![]() (10.2)
(10.2)
where Ce is the coefficient of the wind turbine's performance, according to Bertz Ce-Limit = 0593.
Therefore the energy produced by the wind turbine is given by:
![]() (10.3)
(10.3)
10.2.2. Photovoltaic System
The PV generator contains modules which are composed of many interconnected solar cells in series/parallel to form a solar array. The energy created by the PV generator is given by the mathematical statement [15]:
![]() (10.4)
(10.4)
where A is the total area of the PV generator (m2), ηm is the module efficiency (0.111), Pf is the packing factor (0.9), ηPC is the power conditioning efficiency (0.86), and I is the hourly irradiance (kWh/m2).
10.2.3. Sizing of the Hybrid Power System
There are a few strategies for estimating the crossover PV/wind frameworks, for example, the yearly month-to-month normal system [16]; the most unfavorable month system [17], or the Loss of Power Supply Probability method [18]. Alternative techniques for the estimation can also use the programming bundles, for instance, the information of the most unfavorable months. From Table 10.1, the unfavorable light month and unfavorable wind speed month are December and January, respectively. Thus we can apply the most unfavorable strategy for our crossover framework measurement as shown by [17].
Table 10.1
| Generator Loading (%) | Fuel Consumption (L/h) | Fuel Consumption (L/kWh) |
| 75 | 1.98 | 0.26 |
| 50 | 1.56 | 0.31 |
| 30 | 1.04 | 0.52 |
Reprinted from Kanzumba K, Jacobus V. Hybrid renewable power systems for mobile telephony base stations in developing countries. Journal of Renewable Energy 2013;51:419–25 with permission from Elsevier.
The month-to-month energy delivered by the framework per unit territory is
EPV,m (kWh/m2) for PV,
EW,m (kWh/m2) for wind energy, and
EH,m (kWh/m2) (where m = 1, …, 12 refers to the month of the year).
The most noticeably bad month is an element of the month-to-month burden request, the RE assets and the framework parts' execution. The size (m2) of the generator expected to guarantee full scope (100%) load (ELoad) amid a month is given by Ref. [19]:
![]() (10.5)
(10.5)
where Ai represents the size in square meters of the PV or wind component.
The total energy produced by the PV or wind generators and supplied to the load is expressed as [19]:
![]() (10.6)
(10.6)
with:
![]() (10.7)
(10.7)
where fi is the part of the stock pile supplied by the PV or wind sources.
At each minute, the whole of the divisions of energy commitment from every segment supplied to the stock pile must be equivalent to 1.
![]() (10.8)
(10.8)
with 0 ≤ fi ≤ 1.
The genuine size is figured by the surface unit of the part (SPV,u = 0.3 m2 and SW,u = 0.65 m2). The span of the stockpiling battery is resolved from the month-to-month most extreme burden request EL,max, and it can be communicated by Ref. [20] as:
![]() (10.9)
(10.9)
where Vsys is the voltage of the framework; Nm the quantity of days in the most exceedingly bad month; Δt the time in days of independence required, which is characterized by the fashioner (for basic loads, for example, information transfers, this quality may be set to 5 days).
With respect to the PV and wind parts, the genuine size of the battery is resolved from the limit of a battery unit CBat,u.
From the site details, the capacity of the accessible RE assets and the stock pile estimation can be computed to measure the mixed power framework. It is made of two 7.5-kW wind generators, 8-kW PV model, 7.5-kW inverter (48 V DC data, 220 V air conditioning yield), and 114 batteries (6 V, 360 Ah) for a 48-V framework voltage [19].
10.2.4. Microgrid System
A microgrid is a system where energy is produced locally to supply local demands that are connected to the microgrid [21], which is often connected to the low carbon and RE systems that generate energy to meet the local energy demands [22]. A microgrid can be applied to a small level of energy demand, a single building, for example, providing energy up to large communities, such as, towns, villages, and islands [23]. As microgrids produce energy on-site, it is possible for heating demands to be met through the by-product of electricity generation when using cogeneration plant, such as combined heat and power [24].
Microgrids are decentralized from the traditionally centralized grid and can be considered as a single entity apart. However, microgrids can be connected to the centralized grid to allow for import and export of energy [25], which allows the microgrids to be considered as a source of highly reliable power as they can produce energy locally when it is possible while selling the surplus energy to the grid and draw from the grid when there is a deficit in the local supply. Furthermore, microgrids can take advantage of storage technologies, such as batteries and hot water storage systems to increase the efficiency of the energy produced [20]. It is for this reason that microgrids are being considered as one of the most important developments in future energy production.
10.2.4.1. Microgrid Feasibility Framework
The steps taken to locate a decent microgrid for a given plan are vital as they will choose whether or not a plan is going to address the issues of the considerable number of partners or just to figure out how to meet some of their requests. The necessities of partners in hybrid energy system microgrids fluctuate and differ with one another. The approach taken in carrying out a feasibility study of potential microgrids cannot just focus on meeting the demands alone, as expressed some time recently, because the plan must also be feasible monetarily with the goal that it can be viewed as a sound speculation and has more chances of being actualized in the pragmatic sense of economy. Fig. 10.2 shows a structural procedure in a small-scale framework [12].

There is a need to establish the central acceptable parameters of the considerable number of requests of the partners, a signed up way to deal with the way that plans are envisioned from the initial plausibility for arrangement of onward actions. To this point, the accompanying signed up approach enumerates important steps to be attended to guarantee that a partner in a plan settles on an appropriately powerful choice. This procedure has been created to work in conjunction with the Legitimacy Energy Programming and the monetary related choice as a guiding apparatus to get the best choice [12].
There are a few models that are now available for the retrial, reconstruction, and examination of small-scale network frameworks that strictly consider variables, for example, magnitude of request, atmospheric conditions, site geographical conditions and accessibility, safety from seasonal floods, and availability of fund.
Some products from the above examples are [12]:
1. Energy generation device created by the College of Strathclyde, which permits the client to complete examination of RE plans through the utilization of interested profiles.
2. RETScreen created by the Canadian Government that permits clients to do examination on low carbon energy framework ventures. RETScreen permits the client to survey the possibility of a plan fiscally utilizing manufactured product as a part of monetary investigation.
3. Homer developed by National Renewable Energy Laboratory has been used to carry out examination on any framework to be mixed with low carbon energy frameworks. It permits the client to break down the electrical attributes of executing renewables into pragmatic structures and miniaturized scale lattices.
The subsequent stage in applying the system is to use a possibility instrument, for example, Legitimacy to locate various conceivable situations that could be connected to meet the association's requests. This examination ought to concentrate on the designing qualities that are required for the miniaturized scale lattice to be gainfully feasible, good competitive rate, low energy shortage, diminished CO2, and so forth. There must be investigation of the monetary possibilities of a task to permit a financial specialist to judge the advantages and pitfalls of putting resources into such a plan. This is accomplished through the utilization of an Exceed expectations monetary choice guide instrument that has been created to permit the client to analyze the intricacy of the venture through the designing advantages in the Legitimacy concept [26].
10.3. Hybrid Controllers for Solar and Wind Energy Systems
The controller is the main part of any hybrid RE system. The hybrid controller is an appropriate apparatus to control the proper production of energy from RE sources. The controller may be developed in many methods in tandem with the reason for using it. The advanced system of hybrid controller is developed for a comfortable interface between two or more systems at a time. The solar/wind hybrid controller main advantages are the increased power output; better interaction between wind turbine, solar PV, and battery or any necessary equipment monitoring the system; longer battery life; breaking routine, etc.
In China, the renewable solar/wind energy industry is developing rapidly but the problem is hard to sell the electricity to the power grid because of the instability and discontinuity in the electricity supply. To solve this problem, they used a hybrid power generator to break the development of bottleneck of the RE generation, especially, the unstable RE. For the hybrid control, the Ideal Matter-Element Extension method was used and it included the Fuzzy Comprehensive Judgment Method, the Analytic Hierarchy Process, Gray Clustering Method, and Geographic Information Systems. The hybrid control was applied on three different sites that were good for power generation and distribution [27]. Table 10.2 shows a comparative result of different sites and their power production capacities.
Applying different methods for improvising the energy level from the hybrid system can be quite costly with the resultant uncertainty of the energy availability. To solve this problem, it needs a proper guidance of power management, which includes a storage system or backup sources to provide the necessary power supply with the reliability of the RE system the total sum of which can reduce the cost of energy production by the hybrid RE system. Fig. 10.3 shows a management of renewable hybrid system strategy [28].
Table 10.2
Different Sites Power Production by Using Ideal Matter-Element Extension Method
| Districts or Site | Solar Installed Capacity (MW) | Wind Installed Capacity (MW) | Extension Method | Ideal Extension Methods |
| Inner Mongolia (site 1) | 230 | 1590 | Great | 1 |
| Qinghai (site 2) | 1003 | 770 | Good | 2 |
| Tibet (site 3) | 90 | 15 | Good | 3 |

Reprinted from Xiangjun L, Yong L, Xiaojuan H, Dong H. Application of fuzzy wavelet transform to smooth wind/PV hybrid power system output with battery energy storage system. Energy Procedia 2011;12:994–1001 with permission from Elsevier.
This is the basic configuration but different configurations can also be applied. It depends on the energy utilization, available RE sources, and the customer loads. The hybrid system can combine more than one energy source and the size optimization can be taken to reduce its capital cost [28].
10.3.1. Fuzzy Base Controller
The method of fuzzy controller is based on a logic control. It is applicable in the RE technology. Many traditional methods are already used in this RE field but fuzzy logic is a powerful controller to solve easily the energy management system problem. The researchers have developed many methods based on the artificial neural network for solving optimum operation, forecasting the meteorological data for energy performance and demand for the user of local energy generation. The development of unoptimized fuzzy logic controller (FLC) uses the optimal power flow and the optimal FLC is used for the Hopfield neural network control. From the researchers' report, the optimal FLC is better than the unoptimized FLC and the PI controller. Fig. 10.4 shows an example of using the FLC in hybrid solar/wind system [29].
As can be seen in Fig. 10.4, the system contains a PV array, wind turbine, an electrolyzer, a stack of batteries, a fuel cell, and a hydrogen storage tank that are connected to a DC bus and an inverter, where the power flow is regulated by using an optimized FLC. The wind turbine power production (kW) equation has been given by Ref. [30].
 (10.10)
where Pmax,wind is a nameplate rating of wind turbine; V(t) is wind speed defined at time t (m/s); Vc, VR, and VF are the characteristic parameters determined (m/s).

Figure 10.3 Flowchart guiding the management renewable energy hybrid system. Reprinted from Ismail M, Moghavvemi M, Mahlia T, Muttaqi K, Moghavvemi S. Effective utilization of excess energy in standalone hybrid renewable energy systems for improving comfort ability and reducing cost of energy: a review and analysis. Journal of Renewable and Sustainable Energy Reviews 2015;42:726–34 with permission from Elsevier.

Figure 10.4 Block diagram of hybrid system using fuzzy logic controller (FLC). Reprinted from Safari S, Ardehali M, Sirizi M. Particle swarm optimization based fuzzy logic controller for autonomous green power energy system with hydrogen storage. Journal of Energy Conversion and Management 2013;65:41–9 with permission from Elsevier.
The solar PV power generated (kW) with NS modules is produced in series, whereas the NP modules are in parallel. The effects of temperature are accounted for from the given equation [18]:
 (10.11)
where VOC and ISC are the open circuit voltage (V); ηMPP is the ideality factor (1 < ηMPP < 2); K is the Boltzmann constant (1.38 × 10⁻²³ J/K); T, T0 are the temperatures (K); q is the magnitude of the electron charge (1.6 × 10⁻¹⁹°C); Rs is the series resistance (Ω); α is the exponent nonlinear effects; β is a PV module coefficient and l is the exponent of nonliner temperature voltage effects; G0, G are two different solar irradiance; ηMPPT is the MPPT; and ηoth is the factor reprinting other losses.
The electrical charge is stored by the battery stack and the battery current (A) is given by this equation [31]:
![]() (10.12)
(10.12)
where Ipv, Iwind, IBo, IBU, and ILOAD are currents (A) of PV array, wind turbine boost converter, Buck converter, and load respectively.
The battery voltage (V) equation is as shown below:
![]() (10.13)
(10.13)
where a is the self-discharge rate (S−1), UB,0 is the open circuit voltage (V), Ri is the internal resistance (Ω), Ki is the polarization coefficient (Ω/h), and QR(t) is the accumulated charge (Ah).
The battery energy storage is given by this equation (Ah):
![]() (10.14)
(10.14)
where EB,0 is the battery initial stored energy (Ah) and the battery state of charge (SOC) (%) is defined in the following equation:
![]() (10.15)
(10.15)
where EB,max is the total capacity of the battery stack (Ah).
A practical process of fuzzy control system takes a given value after which the value is passed through a fuzzification process and it is then processed by an inference engine. Finally, that value is obtained through a defuzzification process [32]. Fig. 10.4 shows a fuzzy logic control process that can maintain the equations from (10.10) to (10.15). Here the input values of fuzzy logic control are the net power flow and the batteries, where the net power flow is the difference between the power productions and power consumed. The FLC input and output values are the optimized and the unoptimized results as shown in Fig. 10.5, where the (A) and (B) are the inputs and (C) is the output. As can be seen in Fig. 10.5, N is the Negative fuzzy set, Z is the Zero, P is the Positive, L is the Low, M is the Medium, and H is the High, respectively [31].
The fuzzy logic control base overall energy management system is as shown in Fig. 10.6. This management system is based on the initial control by using a battery or an electrolyzer, which is used to maintain the overall utilization costs. Fig. 10.6 shows on the right side the utilization costs by using FLC.
This controller is used for computing the net force (Pnet). To start with, first obtain the net force and then subtract the net force from the renewable wind/sunlight-based boards. If the net force is correct, it implies that the force requested by the stock pile is higher than the force generated by the renewable sources and the fuzzy control or battery will work. If the net force is negative it implies that the force generated by the renewable wind/sunlight-based sources is higher than the force requested by the stock pile. This is the idea of the fuzzy logic base controller application [33].

Figure 10.5 (A, B) Input and (C) output value of fuzzy logic controller. Reprinted from Safari S, Ardehali M, Sirizi M. Particle swarm optimization based fuzzy logic controller for autonomous green power energy system with hydrogen storage. Journal of Energy Conversion and Management 2013;65:41–9 with permission from Elsevier.

Figure 10.6 Overall energy management and utilization cost optimization system. SOC, state of charge. Reprinted from García P, Torreglosa J, Fernández L, Jurado F. Optimal energy management system for stand-alone wind turbine/photovoltaic/hydrogen/battery hybrid system with supervisory control based on fuzzy logic. International Journal of Hydrogen Energy 2013;38(33):14146–58 with permission from Elsevier.
10.3.2. Fuzzy-PID Base Controller
The fuzzy-PID (proportional–integral–derivative) hybrid controller in the hybrid solar radiation/wind system is a powerful controller in the electric power management system. The traditional control theories may not solve all the controlling problems. The combined fuzzy and PID control is presented to solve the problem of battery management models of wind turbine generator and PV array.
Most of the hybrid wind/solar radiation systems are using batteries for storing the electric charge. The DC rectified by three-phase form wind and PV charge the batteries via a controller which then controls the functions of electric charge storage and adjustment. When the sources (wind/solar radiation) supply electrical energy, the batteries store it and discharge it to the load side. The fuzzy intelligence controller is used to switch and regulate the working state of batteries or float charge after which the continuity of power generation and supply system are activated. Fig. 10.7 shows a combined system using the fuzzy and PID controller.
The controlling method of the combined system is using a double-closed loop, which is used for battery charge and discharge of renewable solar radiation/wind power plants. Fig. 10.8 shows a combined controller fuzzy and PID system.

Figure 10.7 Wind–solar hybrid system by using combined fuzzy-PID controller. PID, proportional–integral–derivative; PPT, power point tracking. Reprinted from Zhang F, Shi Q, Wang Y, Wang F. Simulation research on wind solar hybrid power system based on fuzzy-PID control Proceeding of international conference on electrical machines and systems 2007:338–42 (IEEE Xplore).

Figure 10.8 Diagram of fuzzy-PID combined control system. PID, proportional–integral–derivative; PWM, pulse width modulation. Reprinted from Zhang F, Shi Q, Wang Y, Wang F. Simulation research on wind solar hybrid power system based on fuzzy-PID control Proceeding of international conference on electrical machines and systems 2007:338–42 (IEEE Xplore).
The inner circle is controlled by the PI control for charged current circle and the outer circle is for the charged voltage circle. The MPPT is used to control the PID. The entire framework is controlled by the fluffy PID control individually by an exchanging structure. At the point when the battery needs a quick charge, the PID controls the huge current; however, when the charge is around 80–90% full, it will then switch to a charge mode control by using the fluffy control and the charge voltage becomes constant. These sorts of controllers have a great impact on the battery charging process and in the administration of renewable solar energy/wind hybrid system [34].
10.3.3. PID, Virtual Instrument and National Instrument Controller
Other consolidated controls are the PID and virtual instrument and national instrument (NI) controls. These blends are a development framework for controlling purposes in the sunlight-based wind half breed framework. The National Instrument is controlled by the microcontrollers that can be used for diverse examination reasons. The LabView is programmed for interfacing between the PC and the NI with different gadgets. It is used to decide on MPPT, I–V, P–V, most extreme current, voltage, force point, fill element (FF), and so on in the sunlight-based PV board and wind turbine for demonstration, force ascertainment and test by utilizing the LabView programming, and the NI gadget. In power reproduction cases, a few specialists have utilized the MATLAB. However, power reproduction utilizing the LabView in which the graphical programming has replaced the routine programming systems and viable client interface has become all the more simple to utilize. The sunlight-based PV cell circuit model and the mathematical statement relating to the current and voltage of the cell is as shown in Fig. 10.9.
The basic equation of the current from the circuit is defined by Kirehhoff's current law [35]:
![]() (10.16)
(10.16)
The diode current and voltage are defined by this equation:
![]() (10.17)
(10.17)

Figure 10.9 Single-diode equivalent circuit for photovoltaic cell, where Iph is the solar cell photocurrent, D is the diode, Id is the diode current, Rsh and Rs are the series and shunt resistances, Ish is the shunt current, and R is the load (V). Reprinted from Chouder A, Silvestre S, Taghezouit B, Karatepe E. Monitoring, modelling and simulation of PV systems using LabVIEW. Journal of Solar Energy 2013;91:337–49 and Jaleel J, Nazar A, Omega A. Simulation on maximum power point tracking of the photovoltaic module using LabVIEW. International Journal of Advanced Research in Electrical, Electronics and Instrumentation Engineering 2012;1(3):190–9 (International conference).
![]() (10.18)
(10.18)
where Io is reverse saturation current at Tc (A) and Vd is diode voltage.
The single-diode equivalent circuit for the PV cell and I–V equation can be represented by:
![]() (10.19)
(10.19)
when the PV cell is open circuited, the maximum voltage is produced. That is called Voc.
![]() (10.20)
(10.20)
The reverse saturation current is represented by this equation:
 (10.21)
where the fill variable of the PV cell is the proportion between the maximum force and the open circuit voltage and the short out current. The I–V bend of PV cell is made due to resistive losses. This is an important component to decide on the nature of the PV cell. The fill element is represented by this comparison:
![]() (10.22)
(10.22)
where Vm and Im are defined as the voltage and current values at the maximum power point.
![]() (10.23)
(10.23)
where R′ is the load resistance for operating the power point of the PV and the efficiency is given by this equation:
![]() (10.24)
(10.24)
The mathematical statements from (10.16) to (10.24) are expressions to the regular I–V and P–V portrayal utilizing the LabView programming, which are the same portrayal of the PV cell that appears in Fig. 10.10A. Fig. 10.10B illustrates diverse temperatures I–V and P–V focuses in which it can be seen that the most extreme force focuses are additionally distinctive. It is possible to estimate the MPPT utilizing the LabView and the National Instrument [36].

Figure 10.10 (A, B) I–V and P–V characterization of photovoltaic cell. Reprinted from Jaleel J, Nazar A, Omega A. Simulation on maximum power point tracking of the photovoltaic module using LabVIEW. International Journal of Advanced Research in Electrical, Electronics and Instrumentation Engineering 2012;1(3):190–9 (International conference).
The characteristic of the PV cell is most affected in an open circuit voltage (Voc) because of its dependence on the saturation current (Ic) as given by the following equation:
 (10.25)
where Ior is the saturation current at Tr and Eg is the energy band gap.
The PV cell power output is dependent on the solar irradiation because the light generates the current Iph, which is dependent on the solar irradiation and for this reason Isc increases with the increase in the incident irradiation.
![]() (10.26)
(10.26)
where G is the incident solar irradiation in W/m2, Iscr is the short circuit current, Tr is the reference current, Ki is the temperature coefficient, and Tc is the cell temperature.
The LabView for wind turbine control outline and reproduction model, including the mechanical drive train, generator, and power framework are highly sophisticated parts in the control framework that can interface with the principle turbine and that can then get the continuous information from the framework. The control outline and reproduction module to break down the communications between the hybrid mechanical–electrical systems also appears in Fig. 10.11A and B.
It is possible to enhance the existing models through innovative investigations and other controlling procedures for more sophisticated generators and similarly for more intricate drive train modules. The essential mathematical statement for the wind turbine generator model and power generated can be clearly understood by comparing Eqs.(10.1) and (10.2). The tip-speed proportion of wind turbine is given by this comparison [37]:
![]() (10.27)
(10.27)
where ω is the wind turbine angular speed and the aerodynamic torque can be developed as:
![]() (10.28)
(10.28)
where CT(λ,β) is the torque coefficient, which can be expressed as:
![]() (10.29)
(10.29)
The fitting functions of CP(λ,β) is written as:
![]() (10.30)
(10.30)
![]() (10.31)
(10.31)
where C1, …, C6 are the undetermined coefficients according to the characteristics of the wind turbine.
10.4. Hybrid Solar/Wind Energy Application
The technology of a hybrid system has been visualized concerning the distinctive national desire on getting information on the climatic conditions of the world due to the importance for diverse nations on the energy administration technique that uses a mix of wind turbine, PV, energy unit, or hitter. The blend of the two energies (wind turbine and PV) is also used to produce hydrogen. Presently hydrogen generation is viewed as a piece of RE. In Fig. 10.12, this is a case of a mix of PV and wind turbine framework to obtain hydrogen through electrolysis [38].
This is a 10-kW electrolyzer framework that can be used to get much hydrogen. The PV board slope is equivalent to the edge of the latitudinal position of Sahand (37.2°N). The sun-powered radiation of this site is expected to be 1000 W/m2. The attributes of PV modules are PV range 0.85 m2, Voc is 22.2 V, Isc is 5.45 A, Vmpp is 17.2 V, and Impp is 4.9 A. The wind turbine qualities are as shown in Fig. 10.13.

Figure 10.11 (A) Wind turbine power control system with LabVIEW Simulink. (B) Wind turbine parameters control system with LabVIEW Simulink. Reprinted from LabVIEW. Simulating a wind turbine. National Instruments 2011 and Beula S, Arivuselvam B. Online conditional monitoring for solar and wind energy system. Proceeding of 5th national conference on VLSI 2014 (LabVIEW Website and International conference).

Figure 10.12 Combined hybrid wind and solar system. PV, photovoltaic. Reprinted from Khalilnejad A, Riahy G. A hybrid wind-PV system performance investigation for the purpose of maximum hydrogen production and storage using advanced alkaline electrolyzer. Journal of Energy Conversion and Management 2014;80:398–406 with permission from Elsevier.
Fig. 10.14A and B illustrates the force generation structure of hybrid sources and power utilization in the electrolyzer. The energy generation from RE sources can be found in Fig. 10.14A, where the energy generation is initiated from the stock pile before being supplied to the electrolyzer [38]. This unused energy is highly needed for hydrogen generation. Fig. 10.14B illustrates the energy utilization by the electrolyzer where the energy generation and utilization do not have a large difference.

Figure 10.13 Characteristic of wind turbine. Reprinted from Khalilnejad A, Riahy G. A hybrid wind-PV system performance investigation for the purpose of maximum hydrogen production and storage using advanced alkaline electrolyzer. Journal of Energy Conversion and Management 2014;80:398–406 with permission from Elsevier.

Figure 10.14 (A, B) Combined power production of renewable energy sources. PV, photovoltaic. Reprinted from Khalilnejad A, Riahy G. A hybrid wind-PV system performance investigation for the purpose of maximum hydrogen production and storage using advanced alkaline electrolyzer. Journal of Energy Conversion and Management 2014;80:398–406 with permission from Elsevier.
In the process, the normal rate of hydrogen generation from a hybrid system is 0.00173 mol/s and the energy generation from a wind turbine is (49.8%) higher than the PV in a mixed framework.
Another examination on utilizing the solar radiant energy and wind hybrid system for hydrogen generation has been done in the areas of Kopaonik National Park, Novi Sad, and Belgrade city. This undertaking used the PV module BP SX3200 (200 W). Fig. 10.15 shows a fundamental schematic outline of a mixed solar-powered wind framework that can replace any PV board module and it can also replace the wind turbine suitable for the climate condition and request.
The board is combined with a 50-cell module and the aggregate range is 1.406 m2. This task used distinctive wind turbine limits and the wind turbine centers had three individual sizes of 10, 15, and 20 m, respectively. Table 10.3 illustrates the diverse WT limits and the electrical energy yield. The most extreme wind speeds for the three wind turbines were 3.85, 4.48, and 5.21 m/s, respectively, at 20 m height in Novi Tragic, Belgrade, and Kopaonik [39].
Table 10.3 clearly shows the 5-kW wind turbine that can generate more electrical energy. The investigation on the above set used the alkaline electrolyzer (HySTAT). The sun-oriented irradiance was found to be from 800 to 1000 W/m2 and the cell temperature was 25°C. The photocopy of the solar-based electrical energy PV module is as shown in Fig. 10.16. The electrical energy from the PV for the three spots were not all confirmed. The normal, most extreme, and least energy generation were recorded in July and December (40.6 and 10.4 kWh) at Belgrade city.

Figure 10.15 Basic schematic design of hybrid wind–solar system. PV, photovoltaic. Reprinted from Chong W, Naghavi M, Poh S, Mahlia T, Pan K. Techno-economic analysis of a wind–solar hybrid renewable energy system with rainwater collection feature for urban high-rise application. Journal of Applied Energy 2011;88(11):4067–77 with permission from Elsevier.
Table 10.3
Various Wind Turbine Capacities and Their Output Electrical Energy
| Wind Turbine Capacities (kW) | Novi Sad | Belgrade | Kopaonik | |
| Bergey wind power | 1 | 767.7 | 983.0 | 1550.2 |
| West wind power | 3 | 1472.1 | 1840.0 | 2890.6 |
| West wind power | 5 | 3086.2 | 3930.0 | 6179.2 |
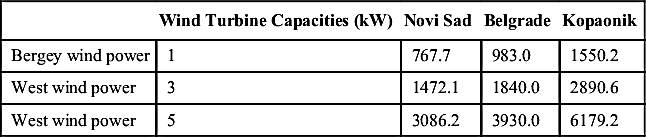
Reprinted from Vukman V, Milada L, Marina P, Valentina M, Biljana S, Nikola S. Technical analysis of photovoltaic/wind systems with hydrogen storage. Journal of Thermal Science 2012;16:865–75.
The aggregate electrical energy of crossover framework and hydrogen generation from diverse sources in Kopaonik park are shown in Table 10.4. It is additionally specified that the rate of renewable energy standard in three better places also vary between one and another.
The hydrogen generation and application use the crossbreed wind-close solar radiant energy system, which itself is a RE source. The blend of three sources, namely, wind, sun-oriented, and hydroelectric crossbreed framework, is material for open matrix or miniaturized scale network that is shown in Fig. 10.17 [40]. The use of half and half framework can permit the generation of energy from different sources while giving a nonstop supply. The solar radiation-based PV applications and uses are exceptionally acceptable innovations in the RE generation field. In any country, particularly which does not have any electrical power supply, it is prudent to mobilize the implementation of power source from half wind energy and half renewable solar energy (PV). It is to be noted that even now we have electric automobiles that use the hybrid system to charge their batteries.

Table 10.4
Electrical Energy and Hydrogen Production
| PV With 1-kW Wind Turbine | PV With 3-kW Wind Turbine | PV With 5-kW Wind Turbine | ||
| Novi Sad city | Electrical energy output (kWh) | 6728 | 7430 | 9050 |
| Hydrogen production (Nm3) | 141 | 162 | 228 | |
| Renewable energy annually (RES %) | 64 | 71 | 86 | |
| Belgrade city | Electrical energy output (kWh) | 7185 | 8040 | 10,130 |
| Hydrogen production (Nm3) | 156 | 182 | 264 | |
| Renewable energy annually (RES %) | 68 | 76 | 96 | |
| Kopaonik park | Electrical energy output (kWh) | 7950 | 9290 | 12,500 |
| Hydrogen production (Nm3) | 172 | 219 | 361 | |
| Renewable energy annually (RES %) | 75 | 88 | 119 | |

10.4.1. Advanced Hybrid System
The development of half and half solar radiation-oriented energy and wind energy framework has supplied enormous amount of energy to the electric network through the use of half and half board sunlight-based PV, wind turbine, and electrolyzer. The controlling mechanism is in the middle of the boards using an electric matrix to apply some sort of control on the corresponding (PI) where the electrolyzer is joined with the DC side of the multilevel current source inverter, which supplies electric energy to the electrolyzer to produce hydrogen, which then goes to the energy component to convert the electric energy for storage in the stock pile. The entire framework is as shown in Fig. 10.18 [41].

Figure 10.17 An application of hybrid solar and wind power system, vehicle charging. Reprinted from Valigra L. Turbine maker links wind and solar with new technology. Pika Energy 2013; pika-energy.com (Internet).
The first proposed ideas to utilize the wind energy in engineering structures were mooted in Germany in the 1930s and 1940s. The outline of this framework is created by Chong et al. to join a half and half solar radiant energy and wind energy framework at the highest point of an elevated structure. This framework can keep running with a low wind speed and can also take advantage of a rainy downpour to speed up the fan velocity as well as a water tank to store the rain water [42]. The graphical course of action is as shown in Fig. 10.19.

Figure 10.18 Renewable sources, electric grid, and hydrogen system. MCSI, multilevel current source inverter. Reprinted from Aguirre M, Couto H, Valla M. Analysis and simulation of a hydrogen based electric system to improve power quality in distributed grids. International Journal of Hydrogen Energy 2012;37(19):14959–65 with permission from Elsevier.

Figure 10.19 Basic arrangement of the hybrid solar–wind energy system with rain water collection. PAGV, power augmentation guide vane; WT, wind turbine. Reprinted from Chong W, Naghavi M, Poh S, Mahlia T, Pan K. Techno-economic analysis of a wind–solar hybrid renewable energy system with rainwater collection feature for urban high-rise application. Journal of Applied Energy 2011;88(11):4067–77 and Zhou W, Lou C, Li Z, Lu L, Yang H. Current status of research on optimum sizing of stand-alone hybrid solar–wind power generation systems. Journal of Applied Energy 2010;87:380–9 with permission from Elsevier.
The above system is a cylindrical shape or different shape of design can be fixed up of the building roof design as well. A power augmentation guide vane (PAGV) is placed in the middle of the wind turbine together with the safety guide and a rudder, which is fixed to the PAGV, all of which can also be connected to an upper wall duct or a lower wall duct. The generator and a mechanical driver are then connected together to the lower wall duct below which is a water storage tank with a thermal insulation. This design is a combined system so that a few numbers of battery banks can be used to store the solar energy through the solar panel. A mesh or filter can help to filter the rain water. The simulation technology was applied in Kuala Lumpur, Malaysia. Fig. 10.20 shows a graphical 3D idea, the wind/solar power hybrid system with rain water storage tank on top of high-rise buildings (PAGV). The generator and a mechanical driver are placed together below the lower divider pipe under which is a water storage tank to set a warm protection. This outline is a consolidated framework in which a few numbers of battery banks are shown to store the sun-based energy system. A channel can discharge the downpour water. The reconstructed version of the innovation was done in Kuala Lumpur, Malaysia. Fig. 10.20 demonstrates a graphical 3D concept, the wind/sunlight-based half breed framework with rain water discharge pipe on top of tall structures [43].

Figure 10.20 Graphical 3D design of the hybrid renewable system with storing rain water on top of high-rise buildings. Reprinted from Chong W, Naghavi M, Poh S, Mahlia T, Pan K. Techno-economic analysis of a wind–solar hybrid renewable energy system with rainwater collection feature for urban high-rise application. Journal of Applied Energy 2011;88(11):4067–77 with permission from Elsevier.
This sort of exploratory innovation is an ongoing process at present. All inquiries about the tests, where the tests are conducted for purposes of examination, controlling, and observing are appropriately recorded for reference. This is highly relevant and useful for remote correspondence to check or obtain information. We can call the half and half framework as a crossbreed unit framework that may generate energy from two or more sources of RE. Every unit exchanges information with the principle collector unit, whereas the collector unit can control the source unit and this simple procedure could be made possible by any technique. Fig. 10.21 illustrates a case that utilizes the LabView and the National Instrument programming and equipment.
The reasons of utilizing LabView and National Instrument programming and equipment are to examine the energy quality and to install the air conditioning and DC computerized board meters that can record and screen the energy values [44].
Solar power/wind hybrid systems have been seriously considered for further extensive and sophisticated developments as these two sources of RE supplement one another wherein if one is insufficient or inert the other framework becomes effective. Improvement of the framework is performed by examining the behavior of the sun-oriented/wind energy, which has been the fundamental focus of the specialists in this subject, and in view of this consideration further expansion on the sun-oriented energy needs the relevant information based on the multigenerational frameworks, thus, more researches are being directed on these frameworks consistently. Ultimately, this ought to bring about finding new better systems, increment in the efficiencies, and a decline in working expenses.

Figure 10.21 Hybrid wind–solar system data recovering, monitoring, and controlling using software and hardware. Reprinted from Pecen R, Nayir A. Design and implementation of a 12 kW wind-solar distributed power and instrumentation system as an educational testbed for electrical engineering technology students. IEEE conference 2010:1–6 (IEEE conference).

10.5. Current Trends
Fig. 10.22 shows the number of articles published between the years 2001 and 2016 on the application of hybrid solar power/wind system in the renewable energies sphere including all the articles published in solar PV, wind, and hybrid energy; from the year 2001 onward, the number of research articles continuously increase reflecting the interest of researchers around the world in this particular area, and especially, in recent years there is a significant growth in the number of research articles, which makes this topic the thrust area of research.
10.6. Conclusion
This hybrid technology will eventually lead to generation of energy for 24 h with resultant potential of less polluted environment. Hybrid systems are most suitable for small electric grids and isolated or stand-alone systems as hybrid power generation is, by definition, a solution for getting around problems where one energy source is not sufficient. The most suitable location for the hybrid solar power/wind system will have been identified first for the development of the most reliable and economic hybrid systems that can significantly contribute toward the future sustainable and better ecological and environmental conservations, improving healthy living and social services and reducing transmission costs.
Nomenclature
A Area traversed by the wind, m2
A Area of the photovoltaic generator, m2
Ai Size of the PV or wind component, m2
D Diode
Eg Energy band gap
EB,0 Battery initial stored energy, Ah
EB,max Total capacity of the battery stack, Ah
G Incident solar irradiation, W/m2
I Hourly irradiance, kWh/m2
Im Maximum current, A
Ipv, Iwind Currents, A
IBo, IBU, ILOAD Currents, A
Id Diode current, A
Ish Shunt current, A
ISC Short circuit current, A
Io Reverse saturation current, A
Ior Saturation current, A
Iscr Short circuit current, A
K Boltzmann constant (1.38 × 10⁻²³), J/K
Ki Polarization coefficient, Ω/h
MMPT Maximum power point tracking
QR(t) Accumulated charge, Ah
R Load, V
Ri Internal resistance, Ω
Rs Series resistance, Ω
Rsh and Rs Series and shunt resistances, Ω
R′ Load resistance for operating the power point of the PV, Ω
T, T0 Temperatures, K
UB,0 Open circuit voltage, V
V Wind speed, m/s
Vd Diode voltage, V
Vm Maximum voltage, V
Vsys Voltage of the framework, V
V(t) Wind speed defined at the time t, m/s
Vc, VR, VF Characteristic parameters determined, m/s
VOC Open circuit voltage, V
Greek symbols
ρ Air density (1.225), kg/m3
Δt Time in days of independence required
q Magnitude of the electron charge (1.6 × 10⁻¹⁹), °C
Ω Wind turbine angular speed, S−1
Acknowledgments
The authors are thankful to the University of Malaya, the Ministry of Higher Education of Malaysia (MOHE) (UM.C/HIR/MOHE/ENG/32), and UM Power Energy Dedicated Advanced Centre (UMPEDAC) for supporting this research project, which made the publication of this book chapter to be academically possible.
..................Content has been hidden....................
You can't read the all page of ebook, please click here login for view all page.