
So far, we have mostly done manual configuration of Zabbix by adding hosts, items, triggers, and other entities. With the exception of templates, discussed in Chapter 8, Simplifying Complex Configuration with Templates, we haven't looked at ways to accommodate larger and more dynamic environments. In this chapter, we will discover ways to automatically find out about resources such as network interfaces or filesystems on hosts by using low-level discovery, scanning a subnet using network discovery, and allowing hosts to register themselves using active agent autoregistration.
While learning about these methods, we will also explore related features, such as global regular expressions, and find out more details about the features we already know of—including context for user macros.
As Zabbix has several ways to manage automatic entity configuration and they all operate in a different fashion, it is highly suggested to never use the term auto-discovery when talking about Zabbix—nobody would know for sure which functionality is meant. Instead, it is suggested to always specify whether it's low-level discovery, network discovery, or active agent autoregistration.
Currently, we are monitoring several parameters on our hosts, including network traffic. We configured those items by finding out the interface name and then manually specifying it for all of the relevant items. Interface names could be different from system to system, and there could be a different number of interfaces on each system. The same could happen with filesystems, CPUs, and other entities. They could also change—a filesystem could get mounted or unmounted. Zabbix offers a way to deal with such different and potentially dynamic configurations with a feature called low-level discovery. In the Zabbix documentation and community, it it usually known as LLD, and that is how we will refer to it in this book, too.
Low-level discovery normally enables us to discover entities on existing hosts (we will discuss more advanced functionality related to discovering hosts with LLD in Chapter 18, Monitoring VMware). LLD is an extremely widely used feature, and there are few Zabbix users who do not benefit from it. There are several LLD methods that are built in, and it is fairly easy to create new ones, too. The available LLD methods are:
- Network interfaces (Zabbix agent)
- Filesystems (Zabbix agent)
- CPUs (Zabbix agent)
- SNMP tables
- ODBC queries
- Custom LLD
We'll discuss Windows service discovery in Chapter 14, Monitoring Windows. ODBC monitoring can be a bit cumbersome in the case of many databases being monitored, so we won't spend much time on it and won't be covering ODBC LLD in this book. See the official documentation on it at https://www.zabbix.com/documentation/3.0/manual/discovery/low_level_discovery#discovery_using_odbc_sql_queries.
Network interfaces on servers seem simple to monitor, but they tend to get more complicated as the environment size increases and time goes by. Back in the day, we had eth0 and everybody was happy. Well, not everybody—people needed more interfaces, so it was eth1, eth2, and so on. It would already be a challenge to manually match the existing interfaces to Zabbix items so that all interfaces are properly monitored. Then Linux-based systems changed the interface naming scheme, and now, one could have enp0s25 or something similar, or a totally different interface name. That would not be easy to manage on a large number of different systems. Interface names on Windows are even more fun—they could include the name of the vendor, driver, antivirus software, firewall software, and a bunch of other things. In the past, people have even written VB scripts to sort of create fake eth0 interfaces on Windows systems.
Luckily, LLD should solve all that by providing a built-in way to automatically discover all the interfaces and monitor the desired items on each interface. This is supported on the majority of the platforms that the Zabbix agent runs on, including Linux, Windows, FreeBSD, OpenBSD, NetBSD, Solaris, AIX, and HP-UX. Let's see how we can discover all the interfaces automatically on our monitored systems. Navigate to Configuration | Templates and click on Discovery next to C_Template_Linux. This is the section that lists the LLD rules—currently, we have none. Before we create a rule, it might be helpful to understand what an LLD rule is and what other entities supplement it.
A Discovery rule is a configuration entity that tells Zabbix what it should discover. In the case of network interfaces, an LLD rule would return a list of all interfaces. Assuming our system has interfaces called eth0 and eth1, the LLD rule would just return a list of them:

Then, the LLD rule contains prototypes. In the first place, prototypes for items would be required, although LLD allows us to add trigger and custom graph prototypes as well. What actually are prototypes? We discussed templates in Chapter 8, Simplifying Complex Configuration with Templates. You can think of LLD prototypes as mini-templates. Instead of affecting the whole host, they affect items or triggers, or custom graphs on a host. For example, an item prototype for network interface discovery could tell Zabbix to monitor incoming network traffic on all discovered interfaces the same way.
Getting back to creating an LLD rule, in the empty list of LLD rules, click on Create discovery rule in the upper-right corner. Fill in the following:
- Name:
Interface discovery - Key:
net.if.discovery - Update interval:
120
When done, click on Add. The Discovery rule is added, although it won't do much useful work for now. The key we used, net.if.discovery, is supposed to return all the interfaces on the system. As you probably spotted, the properties of an LLD rule look quite similar to item properties: there's an update interval, and there are flexible intervals. Overall, the built-in agent LLD rules actually are items. We will later look at the details of how they operate.
A discovery rule returns macros. The same as before, it might be safer to think about them as variables, although we will refer to them as macros again. These macros return various properties of the discovered entities. In the case of the network interface discovery by the Zabbix agent, these macros return interface names. LLD macros always use the syntax of {#NAME}, that is, the name wrapped in curly braces and prefixed with a hash mark. The macros can be later used in prototypes to create items for each discovered interface. The built-in LLD rule keys return a fixed set of such macros, and we will discuss each set whenever we look at the specific discovery method, such as network interfaces first, filesystems and others later. We have an LLD rule now, but it just discovers the interfaces. Nothing is done about them without the prototypes. To have any benefit from the previous step, let's create some prototypes. Still in the LLD rule list, click on Item prototypes in the ITEMS column next to Interface discovery. Then, click on the Create item prototype button, and fill in the following:
- Name:
Incoming traffic on $1 - Key:
net.if.in[{#IFNAME}] - Units:
Bps - Store value: Delta (speed per second)
Our prototype here uses a discovery macro in the item key parameters. Actually, this is required. These macros will be replaced with different values when creating the final items, so the resulting item keys will be different. We could create item prototypes without using LLD macros in the key parameters, but the resulting discovery would fail as it would attempt to create one item per LLD macro.
When done with the configuration, click on the Add button at the bottom. Let's see whether this item prototype now works as intended. We set the interval in our LLD rule to a low value—120 seconds. As we cannot force items and discovery rules to run manually, this will allow us to play with various configuration changes and see the results much sooner. Wait for a few minutes, and go to Configuration | Hosts. Then, click on Discovery next to A test host. Something's not right—in the INFO column, there's a red error icon. Move your mouse cursor over it to see what the error message is:

It's complaining that an item that would have to be created based on the LLD item prototype already exists. That is correct; we created an item exactly like that earlier, when we manually added items for interface monitoring.
The same as always, item uniqueness is determined by the item key, including all the parameters. Unfortunately, there is no way to merge manually configured items with LLD-generated ones. There is also no easy way to keep the collected history. We could change the item key either for the existing item or for the item prototype slightly and keep the manually added item for historic purposes and then remove it later when the new, LLD-generated item has collected enough historical data. In this case, we could apply a small hack to the existing item key. Navigate to Configuration | Templates, and click on Items next to C_Template_Linux. Click on Incoming traffic on interface eth0 in the NAME column. In the properties, make these changes:
- Name:
Incoming traffic on interface $1 (manual) - Key:
net.if.in[enp0s8,]
That is, add (manual) to the name and a trailing comma inside the square brackets. The first change was not strictly required, but it will allow us to identify these items. The second change does not change anything functionally—the item will still collect exactly the same information. We changed the item key, though. Even a small change like this results in the key being different, and the discovery rule should be able to create those items now. When done, click on Update. Now, make the same changes to the outgoing network traffic item and the loopback interface item.
With the item keys changed, we could also monitor outgoing traffic automatically. Let's go to Configuration | Templates, click on Discovery next to C_Template_Linux, and then Item prototypes next to Interface discovery. Click on Incoming traffic on {#IFNAME} and then on the Clone button. Change Incoming to Outgoing in the Name field, and change the Key field to read net.if.out[{#IFNAME}]. When done, click on the Add button at the bottom.
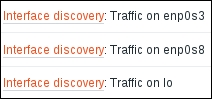
Let a few minutes pass, and head back to Configuration | Hosts. Click on Discovery next to A test host. The error icon should be gone—if not, track down any other items mentioned here and make the same changes to them. Once there are no errors listed in this section, navigate to Configuration | Hosts and click on Items next to A test host. There should be several new items, and they should all be prefixed with the LLD rule name—Interface discovery:

Clicking on the discovery rule name will open the list of prototypes in the LLD rule.
Our first discovery rule seems to be working nicely now; all interfaces on the system have been discovered and network traffic is being monitored on them. If we wanted to monitor other parameters on each interface, we would add more prototypes, using the discovery macro in the item key parameters so that the created items have unique keys.
For our manually created network traffic items, we created calculated items to collect the total incoming and outgoing traffic in Chapter 11, Advanced Item Monitoring. While we could go ahead and create such calculated items manually for all LLD-created items, too, that would be a huge amount of manual work.
Let's try to create a calculated item per interface by the LLD rule instead—go to Configuration | Templates, click on Discovery next to C_Template_Linux, and click on Item prototypes next to Interface discovery. Then, click on Create item prototype. Fill in the following values:
- Name:
Total traffic on $1 - Type: Calculated
- Key:
calc.net.if.total[{#IFNAME}] - Formula:
last(net.if.in[{#IFNAME}])+last(net.if.out[{#IFNAME}]) - Units:
B
Tip
We did not change Type of information as we intentionally left it at Numeric (unsigned) for the network traffic items we referenced here. To remind yourself why, refer to Chapter 3, Monitoring with Zabbix Agents and Basic Protocols.
When done, click on the Add button at the bottom. If you check the latest data page, this item should start gathering data in a couple of minutes.
But let's say we're not that interested in very detailed statistics on the total traffic, but more in a longer-term trend. We could modify the item we just created to collect the sum of average incoming and outgoing traffic over the past 10 minutes and do so every 10 minutes. Let's go back to Configuration | Templates, click on Discovery next to C_Template_Linux, and click on Item prototypes next to Interface discovery. Then, click on Total traffic on {#IFNAME}. Change these four fields:
- Name:
Total traffic on $1 over last 10 minutes - Key:
calc.net.if.total.10m[{#IFNAME}] - Formula:
avg(net.if.in[{#IFNAME}],10m)+avg(net.if.out[{#IFNAME}],10m) - Update interval:
600
When done, click on the Update button at the bottom. We now have to allow a couple of minutes for the discovery rule to run again and then up to 10 minutes for this item to get the new value.
Let's discuss the changes we made. The most important one was the Formula update. We changed the last() function for both item references to avg(). We can use any trigger function in calculated items. We also supplied a parameter for this function after a comma, and that was the reason we had to double-quote item keys in the disk space item. The referenced keys contained a comma, and that comma would be misunderstood by Zabbix to separate the item key from the function parameters.
Tip
Additional parameters can be specified by adding more commas. For example, in avg(net.if.in[{#IFNAME}],10m,1d), 1d would be a time shift as that's the second parameter for the avg() trigger function. See more on trigger functions in Chapter 6, Detecting Problems with Triggers.
If we only want to display the total on a graph, there is no need to create an item—stacked graphs allow us to do that. We discussed stacked graphs in Chapter 9, Visualizing the Data with Graphs and Maps.
The total traffic item (or items) should be updated in the latest data to display the average total traffic over the past 10 minutes. Normally, we would probably use an even longer interval for these averages, such as an hour, but 10 minutes are a bit faster in supplying us with the data. This approach could also be used to configure a floating average for some item. For example, a formula like this would calculate the floating average for 6 hours for the CPU load:
avg(system.cpu.load,6h)
Calculated items do not have to reference multiple items; they can also reference a single item to perform some calculation on it. Such a floating average could be used for better trend prediction or writing relative triggers by comparing current CPU load values to the floating average.
Creating items for all discovered entities is useful, but even looking through them would be quite a task. Luckily, LLD allows us to create triggers automatically as well. The same as with items, this is done by creating prototypes first; actual triggers will be created by the discovery process later.
To create the prototypes, navigate to Configuration | Templates, click on Discovery next to C_Template_Linux, and then click on Trigger prototypes. In the upper-right corner, click on Create trigger prototype, and configure it like this:
- Name:
Incoming traffic too high for {#IFNAME} on {HOST.NAME}. - Expression: Click on Add next to this field. In the popup, click on Select prototype, and then click on Incoming traffic on {#IFNAME} in the NAME column. Click on Insert and modify the generated expression. Change
=0to>5K. This would alert you whenever the incoming traffic exceeded 5,000 bytes per second, as the item is collecting in bytes per second. - Severity: Select Warning.
When done, click on the Add button at the bottom. That was for incoming traffic; now, let's create a prototype for outgoing traffic. Click on the name of the prototype we just created, and then click on Clone. In the new form, change Incoming in the NAME field to Outgoing and net.if.in in the Expression field to net.if.out, and then click on the Add button at the bottom. With both prototypes in place, let's go to Configuration | Hosts and click on Triggers next to A test host. It is likely that there are several new triggers here already, for the incoming traffic—we created that prototype first, so discovery might have had a chance to process it already. Nevertheless, it should not take longer than a few minutes for all of the LLD-created triggers to show up. Make sure to refresh the page manually to see any changes—configuration pages do not get automatically refreshed like monitoring ones do:

The same as with items, triggers are prefixed with the LLD rule name. Notice how we got one trigger from each prototype for each interface, the same as with the items. The {#IFNAME} LLD macro was replaced by the interface name as well. Note that we did not have to worry about making the created triggers unique—we must reference an item key in a trigger, and that already includes the appropriate LLD macros in item key parameters.
The threshold we chose here is very low—it is likely to fire even on our small test systems. What if we had various systems and we wanted to have a different threshold on each of them? The concept we discussed earlier, user macros, would help here. Instead of a hardcoded value, we would use a user macro in the trigger expression and override it on specific hosts as needed. We discussed user macros in Chapter 8, Simplifying Complex Configuration with Templates.
We have items and triggers automatically created for all interfaces, and we could also have a graph created for each interface, combining incoming and outgoing traffic. The same as before, this is done with the help of prototypes. Go to Configuration | Templates, click on Discovery next to C_Template_Linux, and then click on Graph prototypes. Click on Create graph prototype, and enter Traffic on {#IFNAME} in the Name field.
Click on Add prototype in the Items section, and mark the checkboxes next to the incoming and outgoing network traffic items. Then, click on Select. Choose Gradient line for both items in the DRAW STYLE dropdown:

When done, click on the Add button at the bottom. Note that we had to specify the LLD macro in the graph name—otherwise, Zabbix would be unable to create graphs, as they would have had the same name. With the prototype in place, let's go to Configuration | Hosts and click on Graphs next to A test host. If you see no graphs, wait a couple of minutes and refresh the page—the graphs should show up, one for each interface, again prefixed with the LLD rule name:
Navigating to Monitoring | Graphs and selecting A test host in the Host dropdown will show all of these graphs in the Graph dropdown. This way, traffic on a specific interface can be easily reviewed by selecting the appropriate graph—and without configuring those graphs manually first.
Looking at the items, triggers, and graphs that were created, besides real interfaces, the loopback interface also got discovered, and all of those entities got created for it. In some cases, it would be useful to monitor that interface as well, but for most systems, such data would not be useful.
If we look at the list of items in the configuration, the LLD-generated items have the checkbox next to them disabled, and we can't click on them to edit properties directly either. The controls in the STATUS column allow us to enable or disable them individually, though. LLD-generated items on a host cannot be edited, except for being disabled or enabled. Note that in the frontend, this can only be done one by one for each item—we cannot use mass update as the checkboxes are disabled.
Disabling an LLD-generated item on many hosts could be a massive manual task. We could think about disabling the prototype, but that would not work for two reasons. Firstly, we only want to disable items for the loopback interface, but the same prototype is used for items on all interfaces. Secondly, state changes in the prototype are not propagated to the generated items. The initial state in which these items are created—enabled or disabled—will be kept for them.
What about other changes to these items, such as changing the item key or some other property? Those would get propagated downstream, but only when the discovery itself was run by the Zabbix server, not when we made the changes to the prototype in the frontend. In practice, this means that we would have to wait for up to the LLD rule interval to see these changes applied downstream.
Luckily, there's a way to easily avoid creating items for some of the discovered entities, such as in our case: not creating items for the loopback interface. This is possible by filtering the entities' LLD returns on the LLD rule level. Let's change our existing rule to ignore interfaces with the name lo.
Tip
If we wanted to keep LLD-generated items but disable or enable several of them, in some cases, that might be worth doing via the Zabbix API—we will have a brief introduction to the API in Chapter 21, Working Closely with Data.
Navigate to Configuration | Templates, and click on Discovery next to C_Template_Linux. Then, click on Interface discovery in the NAME column. Notice how there's another tab here: Filters. Switch to that tab, and in the first and only Filters entry, fill in the following:
- MACRO:
{#IFNAME} - REGULAR EXPRESSION:
^([^l].*|l[^o]|lo.+)$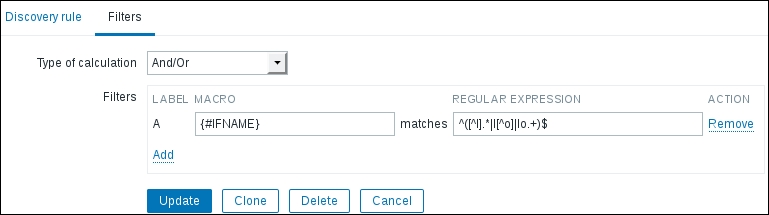
When done, click on Update. LLD filters work by only returning matching entries. In this case, we wanted to exclude the entry lo and keep everything else. Unfortunately, Zabbix daemons only support POSIX extended regular expressions—in this flavor, negating a string is fairly complicated. The filter we used will exclude lo but match everything else—including eth0, enp0s8, and loop.
To see whether this worked, navigate to Configuration | Hosts and click on Items next to A test host. In the list, notice how both lo interface items have an orange icon with an exclamation mark in the INFO column. If you move the mouse cursor over it, a message explains that this item is not discovered anymore and will be deleted at some later time:
In this case, the item is not discovered because it got excluded by the filter, but the reason does not matter that much—it could be an interface being removed or having its name changed as well. But why will it be removed after that specific amount of time, a bit more than 29 days? If we look at the properties of our LLD rule again, there's a field called Keep lost resources period:
Here, we may specify how long items will be kept for when they are not discovered again, and the default is 30 days. The tooltip helpfully told us how much time we have left before the item will be deleted and at what time exactly it will be deleted. Other entities, including triggers and custom graphs, are kept as long as the underlying items are kept.
Now, navigate to Monitoring | Latest data, and click on Graph for Incoming traffic on lo. Let some time pass, and notice that items that are scheduled for deletion still continue collecting data. This might be undesirable, when we had initially been monitoring a lot of things on a device, overloaded it, and then applied filtering, hoping to remedy the situation. There is no way to directly control this, but we may temporarily set the resource-keeping to 0, which would remove the items that are not discovered anymore next time the LLD rule runs. In the LLD rule properties, set the value of this field to 0 and click on Update. After a couple of minutes, check the item list for A test host in the configuration—both of the automatic lo interface items should be gone now.
What if we would like to have a different set of items for different discovered entities, for example, monitoring more things on interfaces with a specific name? That is not easily possible, unfortunately. One way would be by creating two different LLD rules with different item prototypes, then filtering for one set of entities in one LLD rule, and another set in the other LLD rule. Still, that is more complicated than one might expect. LLD rules have the same uniqueness criteria as items: the key. With some items, we can use a little trick and have an item with a key called key and another with key[]. Specifying empty square brackets will denote empty parameters, but functionally, the item will be exactly the same. Unfortunately, the agent LLD keys do not accept parameters, so this trick won't work. One workaround would be specifying an alias on an item key—we will discuss how that can be done in Chapter 22, Zabbix Maintenance.
We have found out that a Zabbix agent has built-in support for discovering network interfaces. It can also discover other things, one of the most popular being filesystems. Before we configure that, let's find out what we can expect from such a feature.
The discovery does not just look a bit like an item in the frontend; it also operates in the same way underneath. The magic happens based on the contents of a specific item value. All the found things are encoded in a JSON structure. The easiest way to see what's returned is to use zabbix_get and query a Zabbix agent. On A test host, run this command:
$ zabbix_get -s 127.0.0.1 -k net.if.discovery
Here, net.if.discovery is just an item key, not different from other item keys. This will return a small string, similar to the following:
{data:[{{#IFNAME}:enp0s3},{{#IFNAME}:enp0s8},{{#IFNAME}:lo}]}While it's mostly understandable, it would be even better with some formatting. The easiest way is to use Perl or Python tools. The Python method would be this:
$ zabbix_get -s 127.0.0.1 -k net.if.discovery | python -mjson.tool
The Perl method would be one of these:
$ zabbix_get -s 127.0.0.1 -k net.if.discovery | json_pp
$ zabbix_get -s 127.0.0.1 -k net.if.discovery | json_xs
The latter method should be faster but requires the JSON::XS Perl module. For our purposes, performance should not be a concern, so choose whichever method works for you. The output will be similar to this:
{
    data : [
       {
          {#IFNAME} : enp0s3
       },
       {
          {#IFNAME} : enp0s8
       },
       {
          {#IFNAME} : lo
       }
    ]
}
The number of interfaces and their names might differ, but we can see that for each found interface, we are returning one macro: the interface name. The key for filesystem discovery is similar: vfs.fs.discovery. We can now run this:
$ zabbix_get -s 127.0.0.1 -k vfs.fs.discovery | json_pp
This would most likely return lots and lots of entries. Here's a snippet:
{
    data : [
        {
            {#FSNAME} : /dev/pts,
            {#FSTYPE} : devpts
        },
        {
            {#FSNAME} : /,
            {#FSTYPE} : ext3
        },
        {
            {#FSNAME} : /proc,
            {#FSTYPE} : proc
        },
        {
            {#FSNAME} : /sys,
            {#FSTYPE} : sysfs
...
Two things can be seen here: one, it definitely returns way more than we would want to monitor. Two, it returns two values for each filesystem: name and type. While we could filter by the filesystem name, some monitored systems could have the root filesystem only, some could have separate /home, and so on. The best way would be to filter by filesystem type. In this example, we only want to monitor filesystems of type ext3. With this knowledge in hand, let's navigate to Configuration | Templates, click on Discovery next to C_Template_Linux, and then click on Create discovery rule. Fill in these values:
- Name:
Filesystem discovery - Key:
vfs.fs.discovery - Update interval:
120
The same as with network interface discovery, we set the update interval to 120. The default in the form, 30 seconds, is very low and should not be used. Discovery can be resource intensive, and, if possible, should be run hourly or so. Now, switch to the Filters tab, and fill in these values:
- Macro:
{#FSTYPE} - Regular expression:
^ext3$
When done, click on the Add button at the bottom. We have the discovery now, but no prototypes. Click on Item prototypes next to Filesystem discovery, and click on Create item prototype. Fill in the following:
- Name:
Free space on {#FSNAME} - Key:
vfs.fs.size[{#FSNAME},free]
When done, click on the Add button at the bottom. We now expect the discovery to get the list of all filesystems, discard most of those except the ones with the type exactly ext3, and then create a free disk space item for each of them. We filter by one LLD macro, {#FSTYPE}, but use another—{#FSNAME}—in the actual item configuration. After a couple of minutes have passed, navigate to Configuration | Hosts and click on Items next to A test host. For each filesystem of type ext3, there should be a free disk space item:
With more prototypes, we could also monitor total space, inode statistics, and other data. We could have triggers as needed on all of these filesystems.
As this discovery returns multiple macros, it might be desirable to filter by multiple macros at the same time. For example, we might want to exclude the /boot filesystem from monitoring. Similar to the type of calculation in action conditions, discussed in Chapter 7, Acting upon Monitored Conditions, we can choose between the automatic options of And, Or, and And/Or—and there's also the Custom expression option. This should allow us to create discovery logic of varying complexity.
When we configure screens with normal graphs, we just choose the graph that should be included in the screen. With LLD-generated graphs, it becomes more complicated—we never know for sure how many graphs could be there for each host. Luckily, Zabbix allows us to include LLD-generated graphs in a way that automatically figures out the number of the discovered entities. To try this feature out, let's go to Monitoring | Screens, go to the list of screens, and click on Constructor next to Local servers. Click on the + icon in the lower-left corner to add another row here, and then click on Change in the lower-left cell. In the Resource dropdown, select Graph prototype. Click on Select next to the Graph prototype field. In the popup, choose Linux servers in the Group dropdown and A test host in the Host dropdown, and then click on Traffic on {#IFNAME} in the NAME column. In the Width field, enter 400.

Click on Add. Notice how this cell does not seem that useful in the screen configuration—no data is displayed, and the title just says Traffic on {#IFNAME}. Let's check this screen in the monitoring view and see whether it's any better.
Depending on the number of network interfaces your system had, the lower-left corner of the screen will have a different number of graphs. If there's only one interface (excluding lo), the screen will look decent. If there are more, all of them will be displayed, but they will be stuffed in a single cell, making the screen layout less pleasing:

Note
We did not set Dynamic item for this screen element. When the host selection is changed in the monitoring section, these graphs always show data for A test host. We discussed screen configuration in more detail in Chapter 10, Visualizing the Data with Screens and Slideshows.
To improve this, return to the constructor of the Local servers screen and click on the Change link in the lower-left corner. Change Column span to 2. Our screen has two columns, so the network interface graphs will now use full screen width. Additionally, take a look at the Max columns field: by default, it is set to 3. If your system had three or more network interfaces discovered, the graphs would take the width of three columns, not two, breaking the screen layout again. Let's set it to 2. When done, click on Update, and then check the screen in the monitoring view again:

This looks better now; the network traffic graphs take full screen width, and any further traffic graphs will be placed below in two columns. This was a custom graph prototype that we added—let's see how it works for simple graphs now. Open the constructor of the Local servers screen again, and click on the + icon in the lower-left corner. Click on the Change link in the lower-left table cell, and select Simple graph prototype in the Resource dropdown. Then, click on Select next to the Item prototype field. Choose Linux servers in the Group dropdown and A test host in the Host dropdown, and then click on Free space on {#FSNAME} in the NAME column. Set both Max columns and Column span to 2 again, and click on Add. Check this screen in the monitoring view. All of the discovered filesystems should be shown in this screen, below the network traffic graphs.
It works the same way in templated screens (also known as host screens), except that we may only select item and graph prototypes from a single template:

The triggers we created from the network interface LLD prototypes always used the same threshold. We could use a user macro and customize the threshold for an individual host, but all interfaces would get the same threshold on that host. With filesystem monitoring, it could be desirable to have different thresholds on different filesystems. For example, we could use 80% warning on the root filesystem, 60% on the /boot filesystem, and 95% on the /home filesystem. This is possible using the user macro context.
Tip
Refer to Chapter 8, Simplifying Complex Configuration with Templates, for more details on user macros.
The normal syntax for user macros is {$MACRO}. The context is specified inside the curly braces, separated with a colon—{$MACRO:context}. A trigger prototype to check for the filesystem being 80% full in our LLD rule could have an expression like this:
{C_Template_Linux:vfs.fs.size[{#FSNAME},free].last()}<20Tip
It might be a good idea to use trigger functions such as avg() or max() to avoid trigger flapping, as discussed in Chapter 6, Detecting Problems with Triggers.
This would alert on any filesystem having less than 20% free disk space or being above 80% utilization. We could rewrite it to use the user macro as the threshold value:
{C_Template_Linux:vfs.fs.size[{#FSNAME},free].last()}<{$FS_FREE_THRESHOLD}This would allow us to customize the threshold per host but not per filesystem. Expanding on this, we would instruct the LLD rule to put the discovered filesystem as the macro context, like this:
{C_Template_Linux:vfs.fs.size[{#FSNAME},free].last()}<{$FS_FREE_THRESHOLD:{#FSNAME}}As the LLD prototypes are processed, the LLD macros are replaced with the discovered values in created items. The trigger for the root filesystem that would be created on the host would look like this:
{A test host:vfs.fs.size[{#FSNAME},free].last()}<{$FS_FREE_THRESHOLD:/}The trigger for the /home filesystem would look like this:
{A test host:vfs.fs.size[{#FSNAME},free].last()}<{$FS_FREE_THRESHOLD:/home}When Zabbix evaluates this trigger, it will first look for a macro with this context value on the host. If that is not found, it will look for this macro with this context in the linked templates. If it's not found there, it will look for a global macro with such a context. If it's still not found, it will revert to the macro without the context and evaluate that as a normal user macro. This means that we don't have to define user macros with all possible context values—only the ones where we want to modify the behavior. If there's a filesystem for which a specific user macro is not available, there's always the host, template, or global macro to fall back to.
This feature is really nice, but properly explaining it seems to be complicated, so here's a schematic. Without context, user macros were evaluated as in the right-hand column —that is, the host level was checked first, then template, and then global. With context, it is the same—just that the macro name with context is looked up in all three levels first, then we fall back to the macro name without context on all three levels. The first place where there's a match will determine the value for that macro.

When used in triggers like this, this feature allows us to have different thresholds for different filesystems—and that can also be customized per host. We could have a user macro {$FS_FREE_THRESHOLD:/home} set to 20 on one host, 30 on another, and so on.
Of course, this is not limited to triggers—it is supported in all the locations where user macros are supported, including item-key parameters and trigger-function parameters. A trigger could check the average temperature for 5 minutes on one system and 15 minutes on another.
Yet another discovery method supported by the Zabbix agent is CPU discovery. It returns all CPUs (or cores) present on a system. Now that we know how to get the LLD JSON, we only need to know which item key is used to return CPU information—that's system.cpu.discovery. Run this on A test host:
$ zabbix_get -s 127.0.0.1 -k system.cpu.discovery | json_pp
For a single-core system, it will return this:
{
   data : [
      {
         {#CPU.NUMBER} : 0,
         {#CPU.STATUS} : online
      }
   ]
}
The CPU discovery returns two macros for each discovered CPU:
{#CPU.NUMBER}is a CPU number, as assigned by the system{#CPU.STATUS}tells us the CPU's status—again, according to the host system
This can be used to monitor various states on individual CPUs and cores. If our application is supposed to utilize all cores evenly, it might be useful to know when the utilization is not even. Simple CPU utilization monitoring will return the average result across all CPUs, so a runaway process that consumes 100% of a single CPU on a quad-core system would only register as having 25% utilization. We might also want to know when a CPU is not online for some reason.
The discovery methods we examined before were all Zabbix-agent based. Zabbix also supports discovering entities over SNMP. This is different from the dynamic SNMP index support we discussed in Chapter 4, Monitoring SNMP Devices. The dynamic SNMP index allows us to monitor a specific entity by name—for example, a network interface by its name. SNMP support in LLD allows us to discover all entities and monitor them. Let's see how we could use it to discover all network interfaces.
Navigate to Configuration | Hosts, click on Discovery next to the host for which you created SNMP items before, and click on Create discovery rule. Populate these fields:
- Name:
SNMP interface discovery - Type: SNMPv2 agent (or choose another, supported SNMP version)
- Key:
snmp.interface.discovery - SNMP OID:
discovery[{#IFDESCR}, IF-MIB::ifDescr] - Update interval:
120
Note
Zabbix versions before 2.4 used a different SNMP OID syntax for LLD rules. While upgrading Zabbix would change the syntax to the current one, importing an older template would use the old syntax, which would fail in Zabbix 2.4 and later. At this time, it is not known which Zabbix version could fix this.
When done, click on the Add button at the bottom. The discovery itself was very similar to what we have created so far, with one exception: the SNMP OID value. For the SNMP LLD, we define the macro name and the OID table to be discovered. In this case, Zabbix would look at all the individual values in the IF-MIB::ifDescr table and assign them to the {#IFDESCR} macro, which is the name we just specified in the SNMP OID field. In addition to the macro we specified, Zabbix will also add one extra macro for each found entity: {#SNMPINDEX}. That, as we will see in a moment, will be useful when creating item prototypes.
To create some prototypes, next to the new discovery rule, click on Item prototypes, and then click on Create item prototype. Fill in the following:
- Name:
Incoming traffic on interface $1 (SNMP LLD) - Type: SNMPv2 agent
- Key:
lld.ifInOctets[{#IFDESCR}] - SNMP OID:
IF-MIB::ifInOctets.{#SNMPINDEX} - Units:
Bps - Store value: Delta (speed per second)
When done, click on the Add button at the bottom.
Notice how we prefixed lld to the item key—that way there is no chance it could clash with the items we created manually earlier. As for the SNMP OID, we used the built-in {#SNMPINDEX} macro, which should uniquely identify values in the SNMP table. If we add such an item manually, we would find out which is the correct index for the desired interface and use that number directly. That's for the incoming traffic—to make this more complete, click on Incoming traffic on interface {#IFDESCR} (SNMP LLD) in the NAME column, then click on the Clone button at the bottom. In the Name field, change Incoming to Outgoing. In both of the Key and SNMP OID fields, change In to Out so that the OID has ifOutOctets. When done, click on the Add button at the bottom. Navigate to Configuration | Hosts and click on Items next to the host we just worked on. After a couple of minutes, there should be new items here, according to those two prototypes. As this is a configuration page, make sure to refresh it every now and then, otherwise the changes will not be visible.
Most likely, the loopback interface will be in the list as well—we did not apply any filtering for this LLD rule:

Like before, let's create a graph prototype for these items. Click on Discovery rules in the navigation header above the item list, click on Graph prototypes next to SNMP interface discovery, and click on the Create graph prototype button. In the Name field, enter Traffic on {#IFDESCR} (SNMP). Click on Add prototype in the Items section, mark the checkboxes next to both of the prototypes, and click on Select. Click on the Add button at the bottom. If you look at the list of graphs in the configuration section for this host after a few minutes, a new graph should appear for each interface there.
The ifDescr OID usually is the interface name. It is quite common to use the ifAlias OID for a more user-friendly description. We could change our discovery to ifAlias instead of ifDescr, but not all systems will have a useful ifAlias value on all interfaces, and we might want to know the ifDescr value anyway. Zabbix can discover multiple OIDs in one LLD rule as well. Let's go back to the discovery rule configuration for this host and click on SNMP interface discovery in the NAME column. Modify the SNMP OID field to read:
discovery[{#IFDESCR}, IF-MIB::ifDescr, {#IFALIAS}, IF-MIB::ifAlias]Further OIDs are added as extra parameters, where the macro name is always followed by the OID. We could also add more OIDs, if needed:
key[{#MACRO1}, MIB::OID1, {#MACRO2}, MIB::OID2, {#MACROn}, MIB::OIDn]In this case, though, ifAlias should be enough. Click on the Update button at the bottom, and then click on Graph prototypes next to the SNMP interface discovery entry. Click on Traffic on {#IFDESCR} (SNMP) in the NAME column, and change the name for this graph prototype:
Traffic on {#IFDESCR} ({#IFALIAS}) (SNMP)This way, if an interface has ifAlias set, it will be included in the graph name. We still keep the ifDescr value, as that is a unique interface identifier, and some interfaces might have nothing to return for the ifAlias OID. Let's go to the graph configuration for this host. After a few minutes have passed, the graph names should be updated, with ifAlias included in the parentheses.
This approach also provides an easy way to monitor selected interfaces only. If you have a large number of network devices and only a few selected ports are to be monitored, the description for those ports could be changed on the device—for example, they could all be prefixed with zbx. This will show up in the ifAlias OID, and we would filter by the {#IFALIAS} macro in the LLD rule properties.
The built-in low-level discovery support is great for discovering filesystems, network interfaces, CPUs, and other entities. But what if we have some custom software that we would like to discover components with or perhaps are running an older Zabbix agent on some system that does not support a particular type of discovery yet? The great thing about LLD is that it is very easy to extend with our own discovery rules. Let's take a look at two examples:
- Re-implementing CPU discovery on Linux
- Discovering MySQL databases
First, let's try to do something that is already available in recent Zabbix agents—discovering CPUs. We do this both because it could be useful if you have some system running an old agent and because it shows how simple LLD can be sometimes. To do this, let's consider the following script:
for cpu in $(ls -d /sys/devices/system/cpu/cpu[0-9]*/); do
    cpui=${cpu#/sys/devices/system/cpu/cpu}
    [[ $(cat ${cpu}/online 2>/dev/null) ==1 || ! -f ${cpu}/online]] &&status=online || status=offline;cpulist=$cpulist,'{{#CPU.NUMBER}:'${cpui%/}',{#CPU.STATUS}:'$status'}'
done
echo '{data:['${cpulist#,}']}'
It relies on /sys/devices/system/cpu/ holding a directory for each CPU, named cpu, followed by the CPU number. In each of those directories, we look for the online file—if that file is there, we check the contents. If the contents are 1, the CPU is considered to be online; if something else—offline. In some cases, changing the online state for CPU0 will not be allowed—this file would then be missing, and we would interpret that as the CPU being online. We then append {#CPU.NUMBER} and {#CPU.STATUS} macros with proper values and eventually print it all out, wrapped in the LLD data array. Let's use this as a user parameter now.
Tip
We explored user parameters in Chapter 11, Advanced Item Monitoring.
We will concatenate it all in a single line, as we don't need a wrapper script for this command. In the Zabbix agent daemon configuration file on A test host, add the following:
UserParameter=reimplementing.cpu.discovery,for cpu in $(ls -d /sys/devices/system/cpu/cpu[0-9]*/); do cpui=${cpu#/sys/devices/system/cpu/cpu}; [[ $(cat ${cpu}/online 2>/dev/null) == 1 || ! -f ${cpu}/online ]] && status=online || status=offline; cpulist=$cpulist,'{{#CPU.NUMBER}:'${cpui%/}',{#CPU.STATUS}:'$status'}'; done; echo '{data:['${cpulist#,}']}'Restart the agent daemon, and on the same system, run this:
$ zabbix_get -s 127.0.0.1 -k reimplementing.cpu.discovery
On a quad-core system, it would return something similar to this:
{data:[{{#CPU.NUMBER}:0,{#CPU.STATUS}:online},{{#CPU.NUMBER}:1,{#CPU.STATUS}:online},{{#CPU.NUMBER}:2,{#CPU.STATUS}:offline},{{#CPU.NUMBER}:3,{#CPU.STATUS}:online}]}We can now use this item key for an LLD rule the same way as with the built-in item. The item prototypes would work exactly the same way, and we wouldn't even need to use different LLD macros.
On most Linux systems, you can test this by bringing some CPUs or cores offline—for example, the following will bring the second CPU offline:
# echo 0 > /sys/devices/system/cpu/cpu1/online
With the CPU discovery re-implemented, let's try to discover MySQL databases. Instead of user parameters, let's use a Zabbix trapper item, which we will populate with Zabbix Sender.
Tip
We explored Zabbix Sender in Chapter 11, Advanced Item Monitoring.
We will use a different item type now. This is completely normal—the item type used for LLD does not matter as long as we can get the correct JSON into the Zabbix server. Let's start by creating the LLD rule with some item prototypes and proceed with generating JSON after that. With this rule, we could discover all MySQL databases and monitor their sizes using a user parameter. The following assumes that your Zabbix database is on A test host. Navigate to Configuration | Hosts, click on Discovery next to A test host, and click on Create discovery rule. Fill in the following:
- Name:
MySQL database discovery - Type: Zabbix trapper
- Key:
mysql.db.discovery
When done, click on Add. Now, click on Item prototypes next to MySQL database discovery, and click on Create item prototype. Here, fill in the following:
- Name:
Database $1 size - Type: Zabbix agent (active)
- Key:
mysql.db.size[{#MYSQL.DBNAME}] - Units:
B - Update interval:
300 - Applications: MySQL
When done, click on the Add button at the bottom. For this item, we used an active agent as this is suggested for user parameters, and we also set the update interval to 5 minutes—usually, the database size won't change that quickly, and we will be interested in more long-term trends. We now have the item, which will be a UserParameter variable, and that item in turn will be created by an LLD rule that is populated by Zabbix sender. Let's set up the UserParameter variable now. In the Zabbix agent daemon configuration file for A test host, add the following:
UserParameter=mysql.db.size[*],HOME=/home/zabbix mysql -Ne select sum(data_length+index_length) from information_schema.tables where table_schema='$1';
This UserParameter variable will query the total database size, including both actual data and all indexes. Notice how we are setting the HOME variable again. Don't forget to save the file and restart the agent daemon afterwards. It's also a good idea to test it right away:
$ zabbix_get -s 127.0.0.1 -k mysql.db.size[zabbix]
This will most likely return some number:
147865600
If it fails, double-check the MySQL parameter configuration we used in Chapter 11, Advanced Item Monitoring.
With the LLD rule and item prototype in place, let's get to sending the JSON for discovery. The following should discover all databases that are accessible to the current user and generate the LLD JSON for Zabbix:
for db in $(mysql -u zabbix -Ne show databases;); do
    dblist=$dblist,'{{#MYSQL.DBNAME}:'$db'}'
done
echo '{data:['${dblist#,}']}'The principle here is similar to the CPU discovery reimplementation from earlier: we find all the databases and list them in the JSON after the proper macro name. It should return a line similar to this:
{data:[{{#MYSQL.DBNAME}:information_schema},{{#MYSQL.DBNAME}:zabbix}]}And now on to actually sending this to our LLD rule—we will use Zabbix Sender for that.
If you tested this and thus modified the dblist variable, run unset dblist before running the following command:
$ zabbix_sender -z 127.0.0.1 -s A test host -k mysql.db.discovery -o $(for db in $(mysql -u zabbix -Ne show databases;); do dblist=$dblist,'{{#MYSQL.DBNAME}:'$db'}'; done; echo '{data:['${dblist#,}']}')
Visiting the item list for A test host in the configuration should reveal one item created for each database:

It might take up to 3 minutes for the first value to appear in the Latest data page—first, up to a minute for the configuration cache to refresh and then, up to 2 minutes for the active agent to update its configuration from the server.
After some time, the values should be visible in the Monitoring | Latest data page:

LLD rules cannot be nested—for example, we cannot discover tables in the databases we discovered. If the tables had to be discovered, it would required a separate, independent LLD rule.