
In this chapter we will look at the built-in capability of Zabbix to monitor web pages. We will check different sections of a web page and monitor it for failures as well as monitoring download speed and response time. We'll also find out how Zabbix can extract a value from some page and then reuse that value. Besides the more advanced scenarios and step-based solution, we will also explore web monitoring-related items that are available for the Zabbix agent.
The Internet is important in every aspect of modern life: socializing, business, entertainment, and everything else happens over the wire. With all the resources devoted to this network, many are tasked with maintaining websites—no matter whether it's an internally hosted site or one trusted to an external hosting provider, we will want to know at least its basic health status. We could start by monitoring a few simple things on a real-life website.
Web monitoring in Zabbix happens through scenarios that in turn have steps. Each step consists of a URL and things to check on it. This allows both checking a single page and verifying that several pages work properly in a succession. The web-monitoring scenarios in Zabbix are still assigned to hosts, and they can also be templated. To see how this works, we could monitor a couple of pages from the open mapping project OpenStreetMap.
While we could attach a web-monitoring scenario to any of the existing hosts, that wouldn't correctly depict what the scenario is monitoring, so we will create a dedicated host. As there's only one OpenStreetMap website, we won't use templates for this. Navigate to Configuration | Hosts, click on Create host, and fill in these values:
- Name:
OpenStreetMap - Groups: If there are any groups in the In Groups box, mark them and click on the
 button
- New group:
Web pages
We don't have to change any other values here, so click on the Add button at the bottom. We're now ready to create the scenario itself—in the list of hosts, click on Web next to OpenStreetMap and click on Create web scenario. In the scenario properties, enter these values:
- Name:
Main page - New application:
Webpage - Update interval:
300
Now on to the individual steps. Steps for web monitoring are the actual queries performed on the web server; each step has a URL. Switch to the Steps tab and click on Add in the Steps section. Fill in these values in the new popup:
- Name:
First page - URL: http://www.openstreetmap.org/
- Required string: Enter
OpenStreetMap is a map of the world, created by people like you. This field will search for a particular string in the returned page, and this step will fail if such a string is not found. We can use POSIX regular expressions here, but not global regular expressions, as discussed in Chapter 12, Automating Configuration. - Required status codes: Enter
200. Here, acceptable HTTP return codes can be specified, separated with commas. Again, if the return code doesn't match, this step will be considered a failure. A status code of200means OK.
This form should look like this:
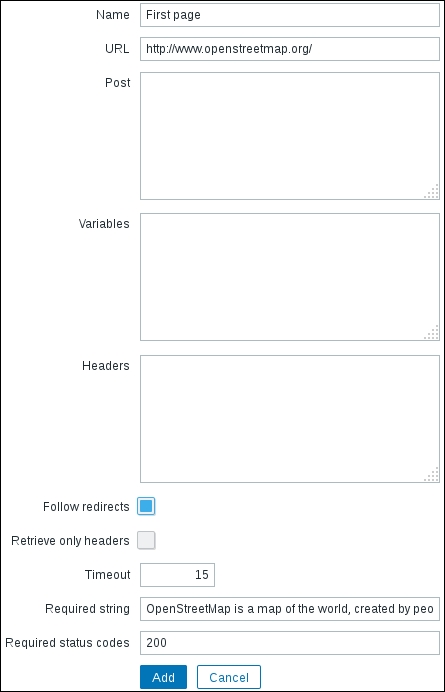
If it does, click on the Add button. Let's also check whether the GPS traces page can be accessed. Again, click on Add in the Steps section, and enter these values:
- Name:
Traces - URL: http://www.openstreetmap.org/traces/
- Required string:
Public GPS traces - Required status codes:
200
In the Required string field, we entered the text that should be present on the traces page. When done, click on Add.
The final step of the configuration should look like this:
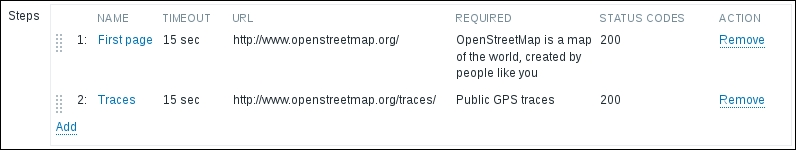
If everything looks fine, click on the Add button at the bottom. Let's see what web monitoring visually looks like. Open Monitoring | Web and click on Main page next to OpenStreetMap. It looks as if all the steps were completed successfully, so we can consider the monitored website to be operating correctly as the STATUS column happily says OK—or at least the parts that we are monitoring. As with plain items, we can see when the last check was performed:
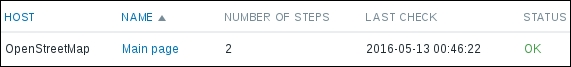
We also have an overview of how many steps each scenario contains, but that's all very vague. Click on Main page in the NAME column—maybe there's more information. Indeed, there is! Here, we can see statistics for each step, such as SPEED, RESPONSE TIME, and RESPONSE CODE. And, if that's not enough, there are nice predefined and pretty graphs for SPEED and RESPONSE TIME. Note that these are stacked graphs, so we can identify moments when all steps together take more time. Above the graphs, we can notice those familiar timescale controls—the scrollbar, zoom, and calendar controls—so these graphs provide the same functionality as anywhere else, including clicking and dragging to zoom in:
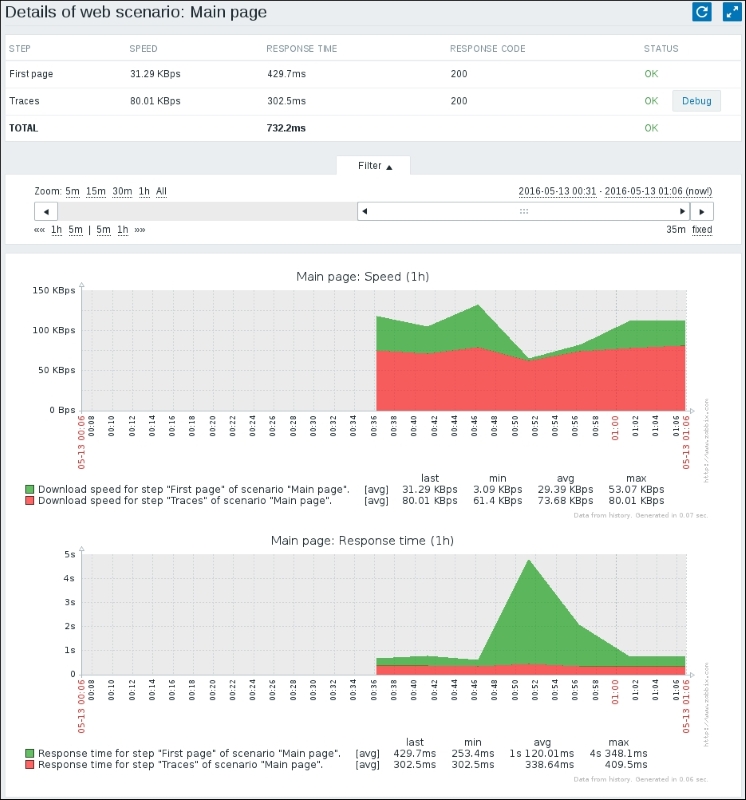
We can see the relative time each step took and how fast it was compared to the others. In this case, both operations together on average take slightly less than a second, although there has been a spike of almost 5 seconds.
While this view is very nice, it isn't too flexible. Can we have direct access to underlying data, perhaps? Let's visit Monitoring | Latest data to find out. Choose Webpages in the Host groups field, and click on Filter. Items within the Webpage application will show up. Take a look at the data—all of the collected values are accessible as individual items, including download SPEED, RESPONSE TIME, RESPONSE CODE, and even the last error message per scenario. We may reuse these items, thus creating whatever graphs we please—maybe we want a pie chart of response times for each step or a non-stacked graph of download speeds. Of course, as with all items, we get simple graphs without any additional configuration.

There's also a failed step item, which returns 0 if none of the steps failed. As that value is 0 when everything is fine, we can check for this value not being 0 in a trigger, and alert based on that.
Before we continue with alerting, let's review the other options on the scenario level:
- Attempts: Web pages are funny beasts. They mostly work, but that single time when the monitoring system checks it, it fails. Or is it just that users reload a page that fails to load once and never complain? No matter what, this field allows us to specify how many times Zabbix tries to download a web page. For pages that experience an occasional hiccup, a value of
2or3could be appropriate. - Agent: When a web browser connects to a web server, it usually sends along a string identifying itself. This string includes the browser name, version, operating system, and often other information. This information is used for purposes such as gathering statistics, making a specific portion of a site work better in some browser, denying access, or limiting experience on the site. Zabbix web monitoring checks also send user agent strings to web servers. By default, it identifies as
Zabbix, but one may also choose from a list of predefined browser strings or enter a completely custom string by choosing other...:
- HTTP proxy: If needed, an HTTP proxy can be set per scenario. A username, password, and port may be specified as well:

Tip
The default HTTP proxy can be set with the http_proxy and https_proxy environment variables for the Zabbix Server process—these variables would be picked up by libcurl, which is used underneath for the web monitoring. If a proxy is specified on the scenario level, it overrides such a default proxy setting. There is no way to set a proxy on the step level.
We'll discuss the remaining fields, Variables and Headers, a bit later.
Let's create a trigger that warns us when any one of the steps in the scenario fails. As discovered previously, the failed step item holds 0 when all is good. Anything else is a sequential number of the step that failed. As a web scenario stops at any failure, a failed step number of 3 means that the first two steps were executed successfully, and then the third step failed. If there are any further steps, we don't know about their state—they were not processed.
To create a trigger, we always need an item key. We could try to find it in the item list. Go to Configuration | Hosts and click on Items next to OpenStreetMap host—no items. The reason is that these items are special—they are items that are internal to Zabbix web scenarios (not to be confused with the internal monitoring items, discussed in Chapter 22, Zabbix Maintenance), and thus are not available for manual configuration. We should be able to select them when creating a trigger, though. Click on Triggers in the navigation header, and then click on Create trigger. In the trigger-editing form, enter these values:
- Name:
{HOST.NAME} website problem - Expression: Click on Add, and then click on Select next to the Item field in the resulting pop up. Select Web pages in the Group dropdown and OpenStreetMap in the Host dropdown, and then click on Failed step of scenario Main page in the NAME column. We have to find out when this item is not returning zero. In the Function dropdown, choose Last (most recent) T value is NOT N and click on Insert. The final trigger expression should be like this:
{OpenStreetMap:web.test.fail[Main page].last()}<>0
When you are done, click on the Add button at the bottom. We can see how the item key web.test.fail[Main page] was used; thus, web scenario items are very much like normal items. They have names and keys, even though they can't be seen in the item configuration view. This way, we can create triggers for all web scenario items, such as response time and download speed, to also spot performance issues or for return codes to spot exact steps that fail. The same items are available for custom graphs, too.
The trigger we created would alert upon the first failure in this web scenario. One might want to make this monitoring less sensitive, and there are at least two ways to achieve that:
- Set Attempts in the scenario properties to some larger value.
- Check item values over a longer period of time. We discussed such a strategy in Chapter 6, Detecting Problems with Triggers.
If a web-monitoring step fails, Zabbix stops and does not proceed to the next step. If the website you are monitoring has multiple sections that can work independently of one another, you should create a separate scenario for each.
Tip
When web monitoring fails, it could be very useful to know what exactly we received from the web server. Unfortunately, Zabbix does not store retrieved content anywhere by default. We'll discuss a way to temporarily view all the retrieved web pages in the Controlling running daemons section of Appendix A, Troubleshooting.