
Zabbix provides a powerful element to visualize data and a topological view in Zabbix, which will help you to create maps. Maps are a graphical representation of your physical infrastructure, where you can display your server, network components, and the interconnection between them.
The great thing is that maps on Zabbix are completely dynamic, which means that you will see your active warnings, issues, and triggers represented on the map, with different icons, colors, and labels. This is a powerful representation of your data center or of the service that you're representing. The elements that you can put in a map are as follows:
- Host
- Host groups
- Triggers
- Images
- Maps
All those elements are dynamically updated by triggers or using macros, thus providing a complete status of the maps and their elements.
Note
To enable a user to create, configure, or customize maps, the user needs to be of the Zabbix administrator type. This means that there isn't a role dedicated to map creation. Also, the user needs to have a read/write permission on all the hosts that he needs to put into a map. This means that there isn't a way to restrict the privileges to map creation only, but you can limit the administration to a certain number of hosts included in a group.
An example of a map that you can easily produce with Zabbix is shown in the following screenshot:
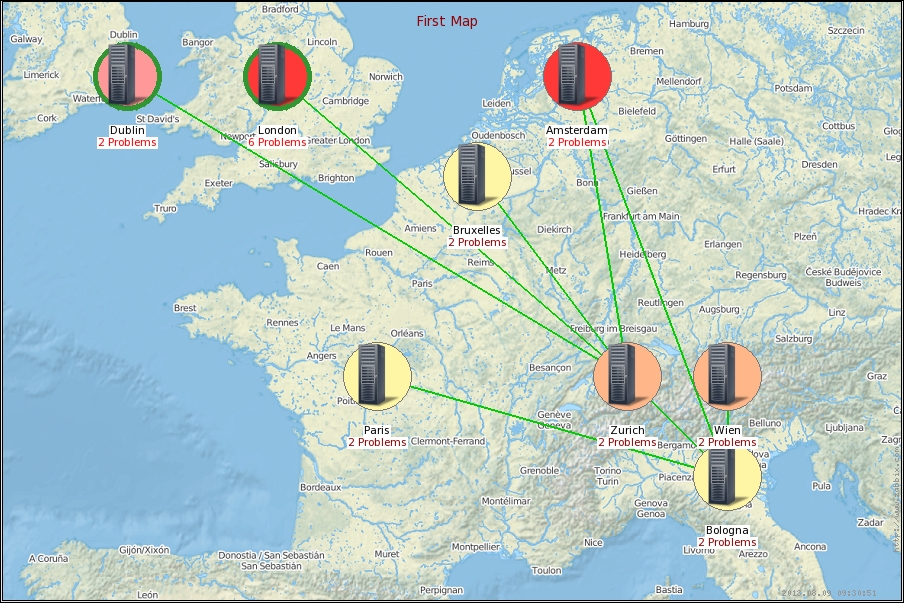
In the preceding screenshot, you can see that there are a lot of graphical combinations of icons, round backgrounds, and information. To better understand what this map represents, it is important to see how Zabbix treats hosts and triggers in a map. In the following screenshot, you can see all the possible combinations of trigger severity and status change:

The preceding screenshot illustrates, from left to right, the following:
- A host that doesn't have a trigger on fire
- A host with the trigger severity that is shown as Not classified in the alarm
- A host with the trigger severity Information in the alarm
- A host with the trigger severity Warning in the alarm
- A host with the trigger severity Average in the alarm
- A host with the trigger severity High in the alarm
- A host with the trigger severity Disaster in the alarm
The trigger line follows the same classification.
Note
The trigger severity is expressed with the background color and not with the name that you see under the HOST label. The label in red color is the name of the trigger. In the preceding screenshot, triggers are callers, just as their classification says, to simply make the picture more verbose. Please notice that in the case of TRIGGER representation, right after the TRIGGER label is displayed, the trigger status is displayed and not the trigger name that is on fire, as in the case of HOST.
Now if a trigger changed recently, its status will be displayed as shown in the following diagram:

Now if a host has issues and a trigger is on fire, this will be represented with the following icons:

Please note that, in this case, the icon is shown with arrows because it just changed the status. The following screenshot shows that there are six problems:
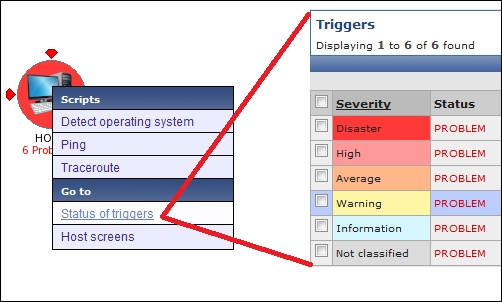
As you can see, there are different triggers with problems. The one that has the most critical severity is the one that gives the color to the circle around the icon. Once all the triggers are acknowledged, the icon will show a green circle around it, as shown in the following screenshot:
The second icon displays details of all the problems that your host is facing and the number of unacknowledged ones, so you have an immediate status of how many issues are under control and how many are new.
The third icon with the square background is a host that has been disabled, represented in gray; it will be in red once it becomes unreachable.
Map configuration can be easily reached by navigating to Configuration | Maps | Create map. The resulting window that you will see is shown in the following screenshot:

Most of the properties are quite intuitive; the Name field needs to be a unique name, and Width and Height are expressed in pixels.
Note
If you define a large size, and the second time, you want to reduce it, it is possible that some of your hosts will fall outside the map and are no more visible. Don't be scared; nothing is lost. They are still inside the map, only not displayed. You can restore them to their original size, and they will appear again.
Now we will take a look at all the other parameters:
- Background image: In the background image field, you can define your map's background, choosing between loaded backgrounds.
Note
Zabbix, by default, doesn't have any backgrounds defined. To add your own background, you need to go to go to Administration | General, and select Images from the listbox. Please check to add your image as Background and not Icon. A good source for royalty-free maps is www.openstreetmap.org.
- Automatic icon mapping: This flag enables user-defined icon mapping for a certain host inventory field. This can be defined by navigating to Administration | General | Icon mapping.
- Icon highlight: This is the flag responsible for generating the round background around the icon with the same color as that of the most critical severity trigger.
- Mark elements on trigger status change: This flag is responsible for highlighting a trigger status change (with the red triangle shown earlier in the screenshot displaying the status change).
- Advanced labels: This check enables you to customize the label's type for all the elements that you can put in a map. So, for each one of those items—host, host group, trigger, map, and image—you can customize the label type. The possible label types are as follows:
- Label: This is the icon label
- IP Address: This is the IP address (available only on the host)
- Element name: This is the element name, such as
hostname - Status only: This is only for the status, so it will be
OK/PROBLEM - Nothing: This means that there is no label at all
- Custom label: A free test area (macros are allowed)
- Icon label location: This field defines where you will see all the labels by default. This can be selected among the following values: Bottom, Left, Right, and Top.
- Problem display: This listbox permits you to choose between the following:
- All: A complete problem count will be displayed
- Separated: This displays the unacknowledged problem count separated as a number of the total problem count
- Unacknowledged only: With this selected, only the unacknowledged problem count will be displayed
- URLs: Here, a URL for each kind of element can be used with a label. This label is a link, and here you can use macros, for example,
{MAP.ID},{HOSTGROUP.ID},{HOST.ID}, and{TRIGGER.ID}.
Starting with Zabbix 2.2, a new feature has been introduced. The map configuration feature provides you with the option of defining the lowest trigger severity.
With this configuration, only the triggers at the defined level or more will still be displayed in the map; this will reduce the number of triggers displayed, and all the triggers with a severity below the defined one will not be displayed. This section is highlighted in the previous screenshot within a green rectangle.
The level that you have selected within the map configuration can be overwritten when viewing maps in Monitoring | Maps by selecting the desired Minimum severity, as shown in the following screenshot:

The URL section is powerful, but here an example is needed because the usage is not intuitive and simple.
Now, if you see a trigger on fire or an alarm that is escalating, most probably the next action that you will take is to check the latest data of your host or jump to a screen that will group the graphs, triggers, and data that you need to check to have an idea of what is happening and do a first-level analysis. In a practical case of first-level support, once a server is highlighted and shows triggers with problems, it can be useful to have a link that will go straight ahead to the latest data of that host and also the screen. To automate this and reduce the number of clicks, you can simply copy the link of the desired page; for instance, the link to the latest data would be something similar to http://<YOUR-ZABBIX-SERVER>/zabbix/latest.php?sid=eec82e6bdf51145f&form_refresh=1&groupid=2&hostid=10095.
Now, looking into the URL to automate the jump to the latest data, you need to replace the variant part of the URL with the macros wherever available.
The sid value in the URL represents the session ID; it is passed to avoid the one-click attack, also known as session riding. This field can be removed. The groupid value in the specific latest data example can be omitted, so the URL can be reduced to http://<YOUR-ZABBIX-SERVER>/zabbix/latest.php?form_refresh=1&hostid=10095.
Now, the link is easy to generate. You can simply replace the hostid value with the macro {HOST.ID} as http://<YOUR-ZABBIX-SERVER>/zabbix/latest.php?form_refresh=1&hostid={HOST.ID}.
And configure the URL as shown in the following screenshot:
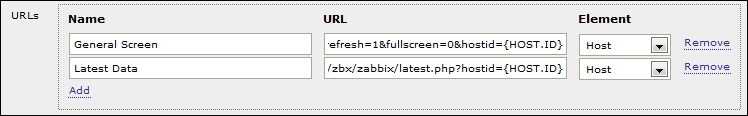
In the preceding screenshot, you can see that there is a link configured to General Screen that collects the most important graphs. The http://<ZABBIX-SERVER>/zabbix/screens.php?sid=eec82e6bdf51145f&form_refresh=1&fullscreen=0&elementid=17&groupid=2&hostid=10094&period=3600&stime=20140807161304 URL is generated from the screen page of a particular host.
This time again, you can omit the sid value in the preceding URL since it specifies a period. If this parameter is absent, you will be taken to a screen that displays the last hour of data. You can also remove the stime, groupid, and elementid values. The reduced URL will be http://<ZABBIX-SERVER>/zabbix/screens.php?form_refresh=1&fullscreen=0&hostid=10094& groupid=2.
Now, to make it dynamic, you need to replace the values of hostid and groupid with the macros, such as http://<ZABBIX-SERVER>/zabbix/screens.php?form_refresh=1&fullscreen=0&hostid={HOST.ID}&groupid={HOSTGROUP.ID}.
The result of this customization is shown in the following screenshot:

As you can see, by clicking on the host that has issues you have two new shortcuts other than Latest Data and General Screen, with a link that is dynamically created for each host.
This kind of behavior allows you to create a master-detail view. In this case, the master is your map, and the detail can be, for instance, the screen or the latest data window. You can create custom menus that can run a script or bring you directly to the trigger status or the Host screens.
Once you have completed this setup, you can begin the nice part of the configuration. Once inside the map, the options that you will find is quite simple and user friendly, as shown in the following screenshot:

In the map, you can add an element by clicking on the + sign and remove it by clicking on the - sign. The element will appear in the upper-left corner of the map. By clicking on that icon, a configuration panel will appear, as shown in the following screenshot:

The element type, by default, is Icon. In the preceding screenshot, it is marked as Host, but it can be any one of the following:
- Host: This icon will represent the status of all the triggers of the selected host
- Map: This icon will represent the status of all the elements of the map
- Trigger: This icon will represent the status of the single trigger selected
- Host group: This icon will represent the status of all the triggers of all the hosts that belong to the selected group
- Image: This icon will just be an image not linked to any source (trigger host and so on)
The Label section is another strong point of the element. Here, you can freely write normal text or use macros.
The next field may vary depending on what you choose as the element type and can be one of the following:
Host: This selects the hostMap: This selects the mapTrigger: This selects the triggerHost group: This selects the host groupIcon(default): This selects the icon to be used
Hosts and triggers have already been covered and are quite intuitive to understand. Probably, it is not immediately understood why we should insert a map inside a map. An efficient use of this scenario is that you can produce a nice drilldown with a general map view that gathers together all the submaps detailed per location or nation. This helps you to produce a drilldown until the final destination; for instance, try to think about a drilldown that comes from nations, down to the city, and deep into the data center, ending on the rack where your server is contained.
The Icon element inside a map is an image that can have a URL associated with. Their function is to add a graphic element to your map that contains the URL, and have the shortcuts directly on your own map.
Right after that, there is the Icons section. Here, if you checked the Automatic icon selection checkbox, icon mapping (defined in the map configuration) would be used to choose the icons to be used.
If you haven't defined an icon mapping or if you want to use an item different from the previous choice, you can specify the icons that will be used in those cases, which can be one of the following:
- Default
- Problem
- Maintenance
- Disable
The Coordinates section expresses the exact location of the element in pixels and, as the previous item, you can configure a dedicated URL for this kind of host too.
Imagine that you have produced different kinds of screens (the screens will be discussed later in this chapter): one that collects all the metric graphs and triggers used to monitor an application server and another one with all the metrics needed to monitor the status of your database. Well, here, if your host is a DBMS, you can create a URL to jump directly to the RDBMS screen. If it is an application server, you can create a custom URL that will take you directly to the application server screens, and so on.
As you can see, this is an interesting feature and will make your map useful to your support team.
In the map configuration, you can select multiple elements by selecting the first one, and then, keeping the Ctrl (or Shift) key pressed, selecting the other elements. For a multiple selection, you can drag a rectangle area, which will then select all the elements in the drawn rectangle.
Once you have selected more than one element, the element form switches to the Mass update elements window, as shown in the following screenshot:
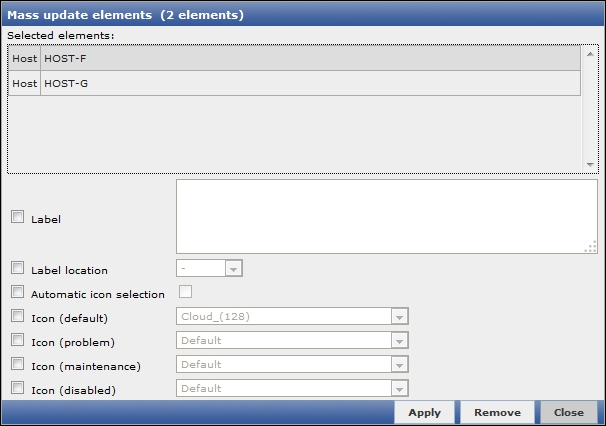
Here, you can update the icons, labels, and label locations for all the selected hosts in bulk.
To have an efficient update of all the labels, it is strongly advised that you use macros.
Now, it's time to inter link your servers in exactly the way that they are physically connected. To create a link between two hosts, you only need to select the hosts that need to be linked together and click on the + symbol in the Link section of the map.
The links section will appear right below the Mass update elements form, as shown in the following screenshot:
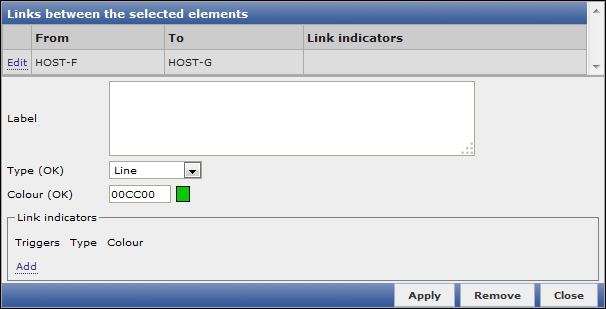
You can customize your link with labels and also change the representation type and color. You can choose between Line, Bold line, Dot, and Dashed line.
An option to keep in mind here is the possibility of connecting the link indicator to a trigger, so basically, the link will change its color once a trigger is on fire.
Previously, we discussed the Label section where you can customize the label in your graphs. Here, I think an example can clarify a lot the power of this section and how this can improve and introduce benefits in your maps. As an example, you can play with macros inside the map. Now, you have certain requirements for this, such as you need to show the hostname, IP address, the status of triggers events (the number of acknowledged events and the number of unacknowledged ones), and the network traffic of your network interfaces, directly in the map.
This seems challenging work and, in fact it, is, but if you have a bit of knowledge about macros, this becomes an easy task. The request can be satisfied with the following code:
{HOSTNAME}
{HOST.CONN}
trigger events ack: {TRIGGER.EVENTS.ACK}
trigger events unack: {TRIGGER.EVENTS.UNACK}
Incoming traffic: {{HOSTNAME}:net.if.in[eth0].last(0)}
Outgoing traffic: {{HOSTNAME}:net.if.out[eth0].last(0)}
The first macro, {HOSTNAME}, will display the hostname of your selected host. The second macro, {HOST.CONN}, will display the IP address. The information about the triggers events, whether acknowledged or unacknowledged, is expressed in the next two lines using the macros {TRIGGERS.EVENTS.ACK} and {TRIGGER.EVENTS.UNACK}. The last two lines are more interesting because they are a composition of two nested macros.
In particular, to display the incoming traffic of your first network interface, you can ask Zabbix to retrieve the last value of the net.if.in[eth0] item. This kind of expression needs the hostname to be evaluated, so you need to write your hostname, that is, HOST-A (in this example) or use macros.
The last piece of information that Zabbix needs to produce as the requested output is the hostname. As mentioned earlier, this can be replaced with the {HOSTNAME} macro. So, the complete expression will be as follows:
Incoming traffic: {{HOSTNAME}:net.if.in[eth0].last(0)}Obviously, for outgoing traffic, the expression is more or less the same, except that you need to retrieve the net.if.out[eth0] item of the network card. The result is shown in the following image:
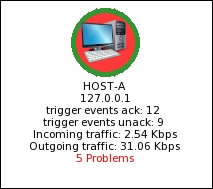
This is a comprehensive and charming output, wherein, without any clicks, you have your needed information directly in your map. In this example, you used the last() value of your item, but the other functions are also supported here such as last(), min(), max(), and avg().
Macros can be used in the same manner on links; an example is shown in the following screenshot:
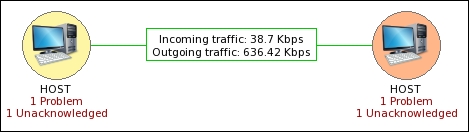
In the preceding screenshot, the traffic data on the link is generated using the same method that was previously explained. All those macro usages make your maps a lot more dynamic and appealing.