
Version 2.0 of Zabbix has a native support to monitor applications using JMX. The actor that monitors the JMX application is a Java daemon called the Zabbix Java gateway. Basically, it works like a gateway. When Zabbix wishes to know the value of a JMX counter, it simply asks the Java gateway, and the gateway will do all the work for Zabbix. All the queries are done using the JMX management API from Oracle.
The Zabbix Java gateway is in the early stages of development, thus providing great functionality but still experiencing some challenges.
The distinguishing characteristic of this method is that the application only needs to be started with the JMX remote console enabled and doesn't need to implement or extend the class or write new code to handle the Zabbix request because the entire request is a standard JMX.
The default way to enable the JMX console is to start the Java application with the following parameters:
-Dcom.sun.management.jmxremote
-Dcom.sun.management.jmxremote.port=<put-your-port-number-here>
-Dcom.sun.management.jmxremote.authenticate=false
-Dcom.sun.management.jmxremote.ssl=false
With these parameters, you are going to configure the JMX interface on the application's side. As usual, you need to define a port, the authentication method, and the encryption.
This basic setup is the simplest and easiest way, but unfortunately, it is not the safest and most secure configuration.
Now, as you are going to open a door in your application, you are basically exposing your application to a security attack. The JMX console, on most of the widely diffused application servers, is not only an entry point to get values from the counter, but also something that is a lot more sophisticated. Basically, with a JMX console open in an application server, you can deploy an application. Start it, stop it, and so on, as you can figure out what a hacker can deploy, and start an application, or cause an issue on the running one. The JMX console can be called from the application server looping itself, using the post and get methods. Adding malicious content in the HEAD section of a web page results in the server that has a JMX console that is not secured and is easily hackable, which is the weakest point of your infrastructure. Once an application server is compromised, your entire network is potentially exposed, and you need to prevent all this. This can be done through the following steps:
- The first thing to do is enable the authentication as follows:
-Dcom.sun.management.jmxremote.authenticate=true
- Now you need to specify a file that will contain your password, as follows:
-Dcom.sun.management.jmxremote.password.file=/etc/java-6-penjdk/management/jmxremote.password
Tip
There are potential security issues with password authentication for JMX remote connectors. Once the client obtains the remote connector from an insecure RMI registry (the default), such as for all the man-in-the-middle attacks, an attacker can start a bogus RMI registry on the target server right before the valid original one is started and can then steal the client's passwords.
- Another good thing to do is to profile the users, specifying the following parameter:
-Dcom.sun.management.jmxremote.access.file=/etc/java-6-penjdk/management/jmxremote.access
- The
accessfile, for instance, should contain something similar to the following:monitorRole readonly controlRole readwrite
- The password file should be as follows:
monitorRole <monitor-password-here>
controlRole <control-password-here>
- Now, to avoid password stealing, you should enable the SSL as follows:
-Dcom.sun.management.jmxremote.ssl=true
- This parameter is consequently tied with the following ones:
-Djavax.net.ssl.keyStore=<Keystore-location-here>
-Djavax.net.ssl.keyStorePassword=<Default-keystore-password>
-Djavax.net.ssl.trustStore=<Trustore-location-here>
-Djavax.net.ssl.trustStorePassword=<Trustore-password-here>
-Dcom.sun.management.jmxremote.ssl.need.client.auth=true
Note
The -D parameter will be written in the startup file of your application or application server as, after this configuration, your startup file will contain sensitive data (your keyStore and trustStore passwords) that needs to be protected and not be readable from other accounts in the same group or by other users.
To compile the Java gateway, perform the following steps:
- First of all, you need to install the required packages:
$ yum install java-devel - Then, you need to run the following command:
$ ./configure --enable-java - You should get an output as follows:
  Enable Java gateway:   yes
  Java gateway details:
    Java compiler:         javac
    Java archiver:         jar
- This shows that the Java gateway is going to be enabled and compiled after the following command is used:
$ make && make install - The Zabbix Java gateway will be installed at the following location:
$PREFIX/sbin/zabbix_java - Basically, the directory structure will contain the following file—the Java gateway:
bin/zabbix-java-gateway-2.0.5.jar - The libraries needed by the gateway are as follows:
lib/logback-classic-0.9.27.jar
lib/logback-core-0.9.27.jar
lib/android-json-4.3_r3.1.jar
lib/slf4j-api-1.6.1.jar
- Here are two configuration files:
lib/logback-console.xml
lib/logback.xml
- The scripts to start and stop the gateway are as follows:
shutdown.sh
startup.sh
- This is a common script sourced from the start and stop scripts that contain the following configuration:
settings.sh - Now, if you have enabled the SSL communication, you need to enable the same security level on the Zabbix Java gateway. To do this, you need to add the following parameter in the startup script:
-Djavax.net.ssl.*
- Once all this is set, you need to specify the following inside the Zabbix server configuration:
JavaGateway=<ip-address-here>
JavaGatewayPort=10052
- Since, by default, Zabbix doesn't start any Java poller, you need to specify that too, as follows:
StartJavaPollers=5
- Restart the Zabbix server or proxy once that is done.
- Now you can finally start the Zabbix Java gateway by running the
startup.shcommand.
The logs will be available at /tmp/zabbix_java.log with the verbosity "info".
Tip
As the Zabbix Java gateway uses the logback library, you can change the log level or the log file location by simply changing the lib/logback.xml file. In particular, the following XML tags need to be changed:
<fileNamePattern>/tmp/zabbix_java.log.%i</fileNamePattern><root level="info">
Here, you can change all the logrotation parameters as well.
If you need to debug a Zabbix Java Gateway issue, another useful thing to know is that you can start the Java gateway in console mode. To do that, you simply need to comment out the PID_FILE variable contained in settings.sh. If the startup.sh script doesn't find the PID_FILE parameter, it starts the Java gateway as a console application, and Logback uses the lib/logback-console.xml file instead. This configuration file, other than enabling the log on console, changes even the log level to debug. Anyway, if you're looking for more details about logging on the Zabbix Java gateway, you can refer directly to the SLF4J user manual available at http://www.slf4j.org/manual.html.
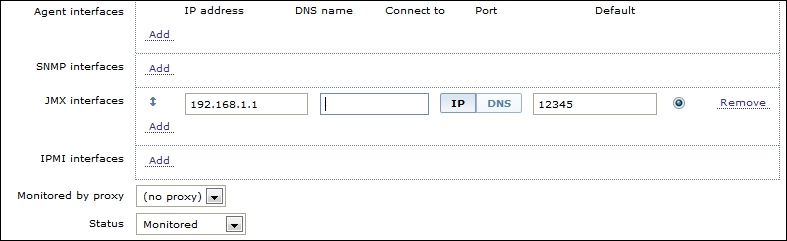
Now it is time to create a JMX monitored host with its relatively monitored JMX items. To do that, inside the host configuration, you need to add a JMX interface and address, as shown in the following screenshot:
Once you have done that for each of the JMX counters you want to acquire, you need to define an item of the JMX agent type. Inside the definition of the JMX agent, you need to specify the username, password, and the JMX query string. The JMX key is composed of the following:
- Object name of MBean
- Attribute name, that is, the attribute name of MBean
The following screenshot shows the Item configuration window:
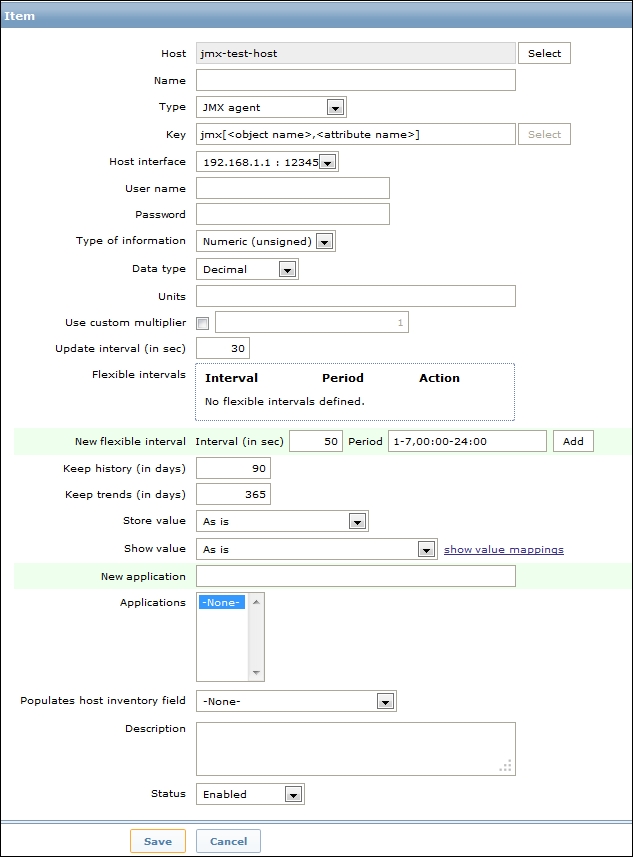
Data type in this configuration window permits us to store the unsigned integer values (such as 0 and 1) as numbers or as Boolean values (such as true or false).
MBean is quite a simple string defined in your Java application. The other component is a bit more complex indeed; the attribute can return primitive data types or composite data.
The primitive data types are simple types, such as integers and strings. For instance, you can have a query such as the following:
jmx[com.example:Type=Test,weight]
This will return the weight expressed as a numerical floating point value.
If the attribute returns composite data, it is a bit more complicated but is handled since dots are supported. For instance, you can have a pen that can have two values that represent color and the remaining ink, usually dot separated, as shown in the following code:
jmx[com.example:Type=Test,pen.remainink]
jmx[com.example:Type=Test,pen.color]
Now, if you have an attribute name that includes a dot in its name, such as all.pen, you need to escape the dot, as shown in the following code:
jmx[com.example:Type=Test,all.pen.color]
If your attribute name also contains a backslash (), this needs to be escaped twice, as shown in the following code:
jmx[com.example:Type=Test,c:\utility]
If the object name or attribute name contains spaces or commas, it needs to be double-quoted:
jmx[com.example:type=Hello,""c:\documents and settings""]
Unfortunately, JMX support is not as flexible and customizable as it should be; at least at the time of writing this book, JMX still had some problems.
For instance, from my personal experience, I know that JBoss, which is one of the most widely used application servers, can't be successfully enquired. The JMX endpoint is currently hardcoded into JMXItemChecker.java as follows:
service:jmx:rmi:///jndi/rmi://" + conn + ":" + port + "/jmxrmi"
Some applications use different endpoints for their JMX management console. JBoss is one of them. The endpoint is not configurable as per the host or frontend, and you can't add a parameter to specify this endpoint on the host's configuration window.
Anyway, the development is really active and things are getting better and are improving every day. At the moment, the status is that the Zabbix Java gateway needs some improvement. Also, the current implementation of the Zabbix Java gateway suffers because of the workload; if you have more than 100 JMX items per host, the gateway needs to be restarted periodically. It is possible that you face some errors of the following kind:
failed: another network error, wait for 15 seconds
This is followed by:
connection restored
Also, there is another aspect to consider: in a real-word scenario, it might happen that you have multiple JVMs running on the same hosts. In this case, you need to configure each JMX port creating multiple items and host aliases, one for each network interface; well, this scenario can't be resolved with low-level discovery and requires a lot of manually redundant configuration work. It is fundamental that the implementer of the Zabbix monitoring infrastructure knows not only all the strong points of the product but also the cons and limitations. The implementer can then choose whether they want to develop something in-house, use an open source alternative, try to fix the possible issues, or ask the Zabbix team for a new functionality or fix.