
What would monitoring be like if there was no support for the SNMP? SNMP is a well-known and widely used standard in lots of devices. Therefore, we will see in this topic, how to configure our Zabbix server to be able to retrieve data provided by SNMP.
Make sure that you have setup your Zabbix server properly. For this recipe we also need a host configured in our Zabbix server that supports SNMP (don't forget to add the snmp interface). If you have compiled your server from source (this you should only do for non-production systems), then don't forget to compile it with the option –with-net-snmp. To be able to make use of the SNMP tools, we need to make sure the net-snmp-utils package is installed.
- First thing to do is add a new Host in our Zabbix server and fill in all settings for the SNMP interfaces.
- Install the
net-snmp-utilspackage.# yum install net-snmp-utils - Then create a new Item on our host or better still, add a new Item to a template.
- Next we find out the Object Identifier (OID) of the item that we want to monitor from our device. This can be done with a tool such as: snmpwalk.
snmpwalk -v 2c -c public 192.168.10.1 | more
- Where 2c is the supported version and public is the community string. Zabbix supports SNMP v1, 2c and 3.
- Now if all goes well when we used the correct version and community string, we should get a lot of information back from snmpwalk. If we wanted to monitor the number of
inOctetson port 1 we would filter out this line:IF-MIB::ifInOctets.1 = Counter32: 1362407 - Now that we have found the correct OID for our item, we can also look for the numeric OID if we want. This can be done with a tool called : snmpget.
snmpget -v 2c -c public 192.168.10.1 -On IF-MIB::ifInOctets.1 - We would get back from our device some output like the following line:
.1.3.6.1.2.1.2.2.1.10.1 = Counter32: 1494804 - If we want to make use of the full OID, then we can look this up with the following command:
snmpget -v 2c -c public 192.168.10.1 -Of IF-MIB::ifInOctets.1 - Our output would then look like this:
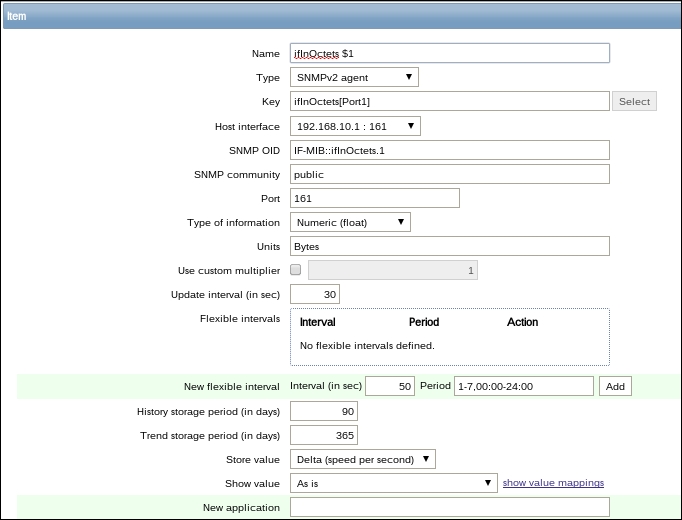
.iso.org.dod.internet.mgmt.mib-2.interfaces.ifTable.ifEntry.ifInOctets.1 = Counter32: 1566936 - Now finally we have enough data to create our Item, so fill in the item details where you select for Type the correct SNMP version. Both short, long or numeric OID's can be used in Zabbix.
- Key can be anything you like that makes sense.
- Host Interface has to be the correct SNMP interface from our host.
- In SNMP OID we put the correct OID that we got back from
snmpget. - Next we fill in the SNMP community. This is our community string.
- Port is the port on our host to communicate with. This should standardly be
161. - Type of information in our case is
Numeric (float). - Units is where we fill in Bytes as Zabbix monitors in bytes.
- Store value should be
Delta(speed per seconds)this will calculate the delta speed per second and is what we need for our network data. - The other parameters such as custom multiplier, store value and so on depends on the kind of data you want to monitor.
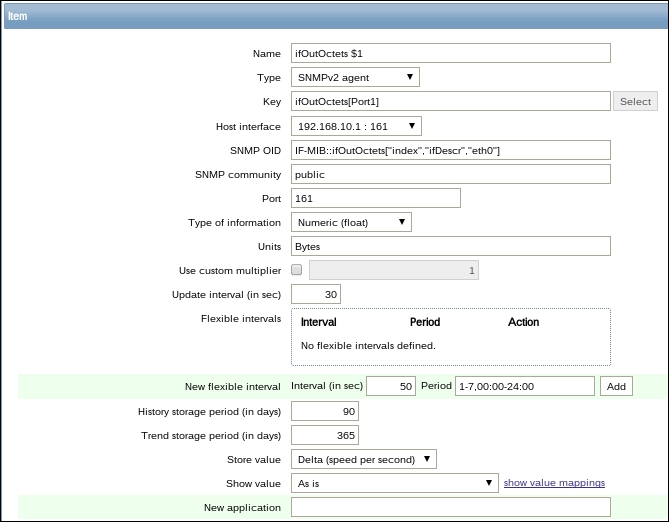
Another way to do some SNMP monitoring is to make use of dynamic indexes in Zabbix. Sometimes this makes sense as the OID number won't stay the same. Index numbers may be dynamic, they may change over time after an update and then our monitoring solution will stop working.
- Let's go back to our network card and do a
snmpwalkto find out the OID that we need to use for the network card on our Network Attached Storage (NAS):# snmpwalk -v 2c -c public 192.168.10.1 | grep ifDesc IF-MIB::ifDescr.1 = STRING: eth0 IF-MIB::ifDescr.2 = STRING: lo
- From the
ifDescr.1parameter, we know that our index is1. So we know that theifOutOctetsfor eth0 is this line:# snmpwalk -v 2c -c public 192.168.10.1 | grep ifOutOctets.1 IF-MIB::ifOutOctets.1 = Counter32: 23843596
- Dynamic indexing will take into consideration the possibility of an index number changing. For this, we make use of a special syntax in our SNMP OID. Let's see how to build our dynamic index with Zabbix from the data we have gathered:
- When you look now at Monitoring | Latest data, you should get some new data for the item you have created.
First of all your device needs to support SNMP. An easy way is to check for connectivity with:
# snmpstatus -v 2c -c public <host IP>
This gives us back some basic information from the device we want to monitor:
# snmpstatus -v 2c -c public 192.168.10.1
[UDP: [192.168.10.1]:161->[0.0.0.0]]=>[Linux NAS 2.6.15 #1636 Sun Oct 23 04:20:59 CST 2011 armv5tejl] Up: 0:05:16.95
Interfaces: 2, Recv/Trans packets: 2908/3112 | IP: 2947/3074
If all goes well, we get some data back that tells us that we made a connection on port 161 and that we made use of the User Datagram Protocol (UDP) protocol and that our device is a NAS. If this is not working, check with the -v 1 command to make sure the device supports version 2c and also verify on your device if the community string is set to public.
Zabbix supports protocols v1, v2c, and v3. When you read out the information from your device with snmpwalk, you need to specify:
# snmpwalk -v <version> -c <community string> <host IP>
This will generate a lot of data so best is to put a more at the end to make it easier to scroll.
From this data you need to find out the numeric OID. This can be done with a tool called snmpget.
# snmpget -v <version> -c <community string> -On <Host IP> <Data Base OID>
The OID that we get here can be used in Zabbix in our item as SNMP OID.
How to know what OID to use? Not so easy to answer. You either know it or you have to ask the manufacturer or find it out with Google. There is no other easy way to get it.
When we want to make use of dynamic indexes in Zabbix, it gets a bit more complicated. Here we have to retrieve two SNMP values. This means that it can create a bit more overload on our server.
First, we will retrieve with snmpwalk the description (ifDescr.1) to find out what the index is; for our item in our example with eth0 the index was 1. Then we can go and look for the actual desired information; in our case this was the ifOutOctets.1.
Now when we want to combine those two SNMP values into one, we have to do it like this:
|
Database OID |
index, |
ifDescr, |
eth0 |
Let's have a look at these in further detail:
- The database OID: This is the base part of the OID that is keeping the data that we want to retrieve without the actual index
- String index: This cannot be changed and will always be index as currently only 1 method is supported
- Index base OID: The part of the OID that will be looked up so that we get the index value that corresponds to the string'
- Index string: This is our exact string that will be searched for
If you don't have a SNMP device to do some testing it is possible to setup SNMP on your computer by:
- Installing the
net-snmppackage. - Starting the
snmpdservice (service snmpd start). - The command
snmpwalk -v 2c -c public 127.0.0.1should give you some output to work with.
Since Zabbix 2.2.3, Zabbix server and proxy query SNMP devices for multiple values in a single request (128 max). This makes monitoring SNMP devices more performant.
In Zabbix 2.4, there is an option in the snmp interface of the host to add bulk requests.
When monitoring devices with SNMP v3, it's important to check that the snmpEngineID parameter is never shared by two or more devices. Each device must have a unique ID else you would see a lot of errors in your zabbix_server.log file about the device being unreachable.
With some switches it is possible to force that the OID never changes, this can resolve the more complex setup of dynamic indexes.
To make use of SNMP v3 on your computer you can run the following commands:
# service snmpd stop
# net-snmp-create-v3-user -ro zabbix
Enter authentication pass-phrase:
adminadmin
Enter encryption pass-phrase:
  [press return to reuse the authentication pass-phrase]

adding the following line to /var/lib/net-snmp/snmpd.conf:
   createUser zabbix MD5 "adminadmin" DES
adding the following line to /etc/snmp/snmpd.conf:
   rouser zabbix
# service snmpd start
# vi ~/.snmp/snmp.conf
defVersion 3
defSecurityLevel authPriv
defSecurityName zabbix
defPassphrase adminadmin
# snmpwalk -v3 localhost system
Sometimes OIDs have only a numeric description and then it's quite difficult to find what the exact purpose of the OID is. Some vendors have Management Information Base (MIB) available for download that can be used to make the information more readable. Another place to find MIB's for your devices can be on some websites where the community collects them.
After you have downloaded your MIB file you have to copy the file to the correct location. This can be in ~.snmp/mibs per user or global in the /usr/share/snmp/mibs file.
Next, open the MIB file and look for the first line with, in my case, the name:
SYNOLOGY-SYSTEM-MIB DEFINITIONS ::= BEGIN
We need the name before the word DEFINITIONS.
Next time we run snmp, we will hopefully get a more descriptive output:
snmpwalk -m +SYNOLOGY-SYSTEM-MIB -v 2c -c public 192.168.10.1
A more definitive solution is to add the MIB file to your snmpd.conf file. This can be done by editing /etc/snmp/snmpd.conf and adding to the file:
mibs +SYNOLOGY-SYSTEM-MIB
Tip
In case you are looking to configure SNMP traps, then I suggest you look at the zabbxi.org web page as SNMP Traps in Zabbix have to be configured mostly on OS level.
http://zabbix.org/wiki/Start_with_SNMP_traps_in_Zabbix. https://www.zabbix.com/documentation/2.4/manual/config/items/itemtypes/snmptrap?s[]=snmp&s[]=traps. The rest of the configuration is done as Zabbix trapper item. You might want to read the recipe about Zabbix trapper in this chapter to understand how to use it. If you look for a MIB browser under Linux then you can make use of tkmib- a GUI that is provided by the net-snmp-gui package.
- https://www.zabbix.com/documentation/2.4/manual/config/items/itemtypes/snmp
- https://www.zabbix.com/documentation/2.4/manual/config/items/itemtypes/snmp/dynamicindex
- https://access.redhat.com/documentation/en-US/Red_Hat_Enterprise_Linux/6/html/Deployment_Guide/sect-System_Monitoring_Tools-Net-SNMP-Configuring.html