380 Solving Operational Business Intelligence with InfoSphere Warehouse Advanced Edition
– The output column designates the column name in the output table into
which the results of the transformation of this feature is written. The output
table is the input into the data mining model.
10.2.3 Data mining modeling in InfoSphere Warehouse Design Studio
After the source data has been prepared, the data mining model can be
developed and tested. Recall that it is best to develop the mining model using a
subset of the historical data available, saving an equal portion of the historical
data (with known outcomes) for validation. InfoSphere Warehouse 10.1 Design
Studio has two primary routes to develop the data mining model:
???? The first route is to use the
mining flow editor in Design Studio to manually
build the flow of information from the source data tables into the data mining
method operators and finally into an output target. Outputs can be tables or
columns, or they can also be visualization methods. Mining flows are
conceptually and practically similar to the SQL Warehousing (SQW) data
flows described in Chapter 4, “Data modeling: End to end” on page 81.
???? The second route is to use the solution plan wizards that have been defined
for a subset of common data mining solutions. The wizard prompts the
developer for information that will be used to produce the same mining flows
as though they were developed manually, but the interface is more business
analyst-oriented, seeking input in terms of the business analysis being
performed instead of in terms of tables and columns.
For a more thorough discussion of the data mining modeling process and tooling
in InfoSphere Warehouse Design Studio, see InfoSphere Warehouse: A Robust
Infrastructure for Business Intelligence, SG24-7813. We consider each of these
approaches at summary level in this document.

Chapter 10. Techniques for data mining in an operational warehouse 381
Data mining flow editor
InfoSphere Warehouse 10.1 Design Studio provides the data mining flow editor
to design and test data mining models in a manner that is similar to SQL
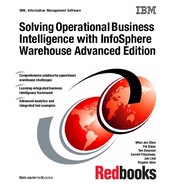
Warehousing data flows. Figure 10-13 shows an example of a data mining flow.
Figure 10-13 Data mining flow in Design Studio
Notice several items of interest in this mining flow:
???? On the left side of the graphic there are several Table Source (extract)
operators, such as Customer.
???? These operators all feed into a multiway Join operator.
???? The output of the Join operator feeds into a Select operator. The Select
operator reduces from all of the columns in all the input tables down to only
those columns required in the Clusterer operator.
???? The Clusterer operator takes the input columns and performs the cluster
mining method. The output of the Cluster operator goes into three operators
in parallel.
???? One of the operators that follows the Clusterer operator is the Visualizer. The
Visualizer is most useful during model design and ad hoc mining operations.
There are distinct visualizers for each data mining method. Each one is
tailored to graphically display the results of the mining function. We saw
examples of the cluster visualization during the discussion of data exploration
and univariate and bivariate analysis.
???? Another operator that follows the Clusterer operator is the Cluster Extractor.
This operator extracts clusters from the Clusterer operator for insertion into a
table for further analysis. It is the equivalent of performing a SELECT
382 Solving Operational Business Intelligence with InfoSphere Warehouse Advanced Edition
statement on a table. These clusters are merely the descriptions of the
clusters that were found in the data set.
???? The output of the Cluster Extractor is a Table Target, which is a table that
collects all of the cluster detail information.
???? The third output of the Clusterer operator is the Scorer operator. The Scorer
operator takes the Cluster model as one input and the data set (table) as a
second input. The result is a mapping of customers in the dataset to their
respective cluster. The scoring operator is what enables the model to be
applied to new data records.
???? The final output of the Scorer operator is another Table Target operator that
collects the results of the Scorer operator, a mapping of customers to
clusters.
Data mining modeling revisited
We previously provided an example data mining flow for the clustering method.
In this section, we revisit the key aspects of the modeling process. This process
is repeated for each mining method. The general steps of the process are as
follows:
1. Extract the source data; this is shown in Figure 10-13 on page 381 as multiple
tables sources feeding a multiway join operation.
2. The model operator (Clusterer, for example) operates on the input source
data and generates output that can be processed in several ways.
3. The visualization operator can be used in two primary ways:
– As a means of evaluating and validating the data mining model results for
“correctness.” It can aid the developer in the process of tuning the mining
model for effectiveness.
– As a means of communicating the model results for use by users and
business analysts.
The visualizer can provide an easy-to-grasp view of the results that allow
important or anomalous results to stand out against the “noise” of extensive
results.
There are visualizers for each data mining method in Design Studio, and they
tend to flow from the mining operator.
4. The extractor operation simply distills the model results into a form suitable
for insertion into a database table for standard relational query and reporting.
This is an easy way to make the mining results available for integration into
wider BI applications and reporting solutions, integrating with other data
sources.
..................Content has been hidden....................
You can't read the all page of ebook, please click here login for view all page.