
8
Hesitancy, Awareness, and Vaccination: A Computational Analysis on Complex Networks
Dibyajyoti Mallick, Aniruddha Ray, Ankita Das and Sayantari Ghosh⋆
Department of Physics, National Institute of Technology Durgapur, Durgapur, West Bengal, India
Abstract
The vaccines for preventing COVID-19 are being considered as the most effective way to reduce the high pandemic burden on the global health infrastructure. However, public hesitancy towards vaccination is a crucial and pressing problem. Our study has been designed to determine the parameters affecting the vaccination decisions of common individuals. Using the platforms of the compartmental model and network simulation, we categorize people and observe their motivation towards vaccinations in a mathematical social contagion process. We consider peer influence as an important factor in this dynamic and study how individuals influence their peers regarding vaccination decisions. The efficiency of the vaccination process is estimated by the period of time required to vaccinate a substantial fraction of the total population. We discovered the major barriers and drivers of this dynamics and concluded that it is required to formulate specific strategies targeting specifically the undecided and vaccine hesitant people.
Keywords: Complex network, mathematical model, social epidemic, vaccination strategies
8.1 Introduction
The novel coronavirus disease 2019 (COVID-19), caused by severe acute respiratory syndrome Coronavirus 2 (SARS-CoV-2), was first reported in Wuhan, Hubei Province of China. This disease is now a global pandemic which is spreading rapidly from person to person, causing major public health concerns and economic crisis [1, 14]. A variety of active intervention policies have been introduced to suppress the spreading of this disease such as hand sanitizing, social distancing, travel restrictions, partial or complete lockdown, wearing masks, quarantining, etc. After the declaration of the pandemic by WHO (World Health Organization) in March 2020, pharmaceutical companies and scientists have encountered a race against time to develop vaccines [6]. The recent availability of multiple vaccines against coronavirus has brought hope for prevention of the spreading and a rapid recovery of our badly affected economy with a promise of a sooner resumption of normal life. However, the widespread hesitancy about vaccines is becoming a major obstacle for global health. Many people have strong hesitation towards vaccination, which is defined as the confusion about safety and effectiveness of the vaccine. The origin of this usually lies in some rumors regarding vaccines concerning side effects. This has become a huge challenge for governments and public health authorities for reaching the expected and required vaccination coverage [3, 9, 19]. The key priority now is ensuring vaccine acceptance because the lag in vaccination may provide a window for spreading the new variants and can also be a major obstacle in developing society-wide herd immunity. Until now, many researchers and scientists have tried to conduct different surveys to understand the behavior towards vaccine acceptance and hesitancy [2, 8, 10]. Some studies [7] have applied different theoretical models to explain vaccine acceptance, hesitancy, and willingness of individuals towards vaccines as well as refusal to vaccinate, which may vary depending upon personal decisions and epidemiological conditions [18]. Many advanced countries are trying to conduct country specific surveys [11], while several reports are being prepared by different countries such as the United Kingdom (UK), United States of America (USA), China, India, and Saudi Arabia to understand this vaccine acceptance behaviour [5, 12, 16]. However, most of these studies are based on heuristic arguments rather than mathematical analysis. A computational framework having a mathematical foundation helps to draw quantitative conclusions and is much more effective for predictive modeling purposes. This paper represents a new mathematical model regarding the vaccination process which incorporates behavioral changes of every individual in a society, driven by global and local factors. The main assumption here is that the vaccination dynamics can be considered as a social contagion process. This study aimed to identify the acceptability of the Covid-19 vaccine and information in support or opposing vaccination that is flowing in a society like a viral infection. We take into account refusal and hesitancy factors as well as the positive attitude of people towards vaccination [17]. In our study, we focused on identifying the effects of the factors that could increase the vaccination coverage through numerical simulations on an artificial society. Moreover, we could justify several results found by survey based studies where this kind of question has already been explored using survey results [4, 15]. Our results address the vaccination acceptance problem using a comprehensive mathematical and computational framework that would help us figure out correct strategies to encourage community for vaccine uptake and to stop further spreading of this pandemic.
8.2 Model Formulation
To understand this kind of problem, we have considered a set of differential equations to depict the possible transitions. To describe the vaccine dynamics, we have a compartmental model, as shown in Figure 8.1. At any time t, the total population N(t) is subdivided into four states: Ignorant (I), Hesitant (H), Unwilling (U), and Vaccinated (V).
- Ignorant (I) − As the name suggests, in this group people are ignorant about the vaccine. They have no idea about vaccination and have no clear opinion. In general, these people will not involve themselves in the vaccination process. But, they may be influenced by hesitant and vaccinated groups as well. Each person in this group is represented by I(t).
- Hesitant (H) − In this group people know about vaccines, nevertheless they feel hesitation while making decisions regarding vaccination, being affected by the rumors. This group may be influenced by the global advertising campaigns in favor of vaccination and take vaccines eventually. On the other hand, they could also be influenced further by rumors and transit to an unwilling state. Each person in this group is represented by H(t).
- Unwilling (U) − In this group people believe in negative rumors regarding vaccines and they push themselves from vaccination. Again, some Unwilling people may return to the Hesitant class if they cannot decide whether to get vaccine or not, by influence through the vaccinated sub-population. Each person in this group is represented by U(t).
- Vaccinated (V) – In this group, people are completely vaccinated and they are trying to influence other groups to join them. Each person in this group is represented by V(t).
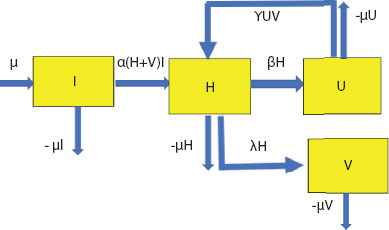
Figure 8.1 Compartmental diagram of proposed model (I-H-U-V).
All the transitions considered in the proposed model are shown through blue arrows. Sub-populations are denoted by yellow boxes.
In this model, the key variable we have is the vaccinated population who are influencing other populations to get vaccinated. This is also the target population which has to be maximized over a certain period of time. Here, this group of people is playing an effective role to control the epidemic and spread the infodemic. Considering the total population as 1 (normalized form),
Now, we will discuss the following possibilities of transition of people from one sub-population to another over a given time period ‘t’. Let us discuss all the possible transitions considered in the model categorically.
- Possible transitions related to I sub-population: In this population, µ is the rate at which people are entering into the ignorant population. This is added to consider the demographic variations. Now, the members of I may be influenced by the H and V population. H and V people might spread words on their inclination and decision and encourage others for vaccination. Let us consider α to be the effective contact rate. If each member of I group is going to be influenced by a hesitant and vaccinated group with that rate, then α(H + V)I amount will be subtracted from the I group and must be added to the hesitant group. In the normal course, there must be some people who can die from that population, hence the term µ should also be deducted from group I in the rate equation.
- Possible transitions related to H sub-population: As mentioned in the previous case, due to the effect of influence from group H and V, the term α(H + V)I should be added in this rate equation. As usual, people from Group 3 can also die, hence the term µH can also be deducted from H group in its rate equation. Due to some reasons (influence from other groups or due to development of self-awareness among people), they are going for vaccination at a rate λ and some are entering into the Unwilling group at a rate β. Hence, the term βH and λH should be deducted from the rate equation. Again, from the Unwilling group some people are coming back into the Hesitant group by believing in some rumors, hence the term γUV should be added to the rate equation of H.
- Possible transitions related to U sub-population: From the previous case discussed above it should be noted that the terms γUV and µU should be deducted from the rate equation due to their hesitant behavior and natural death from this group, respectively.
- Possible transitions related to V sub-population: From the discussion of Case 2, it is evident that the term λH must be added to its rate equation due to direct wishing for vaccination from group H and µV must be deducted due to natural death of people from this group.
Hence, all the rate equations of this model are compiled as follows:
8.3 Model Analysis on Complex Network
In ODE-based models, one of the major issues is homogeneous mixing, which indicates every individual in a population has the same probability of having contact with each other [20]. Our society is highly heterogeneous and to accommodate that fact into our findings, we study the model on the heterogeneous setting of a complex network. The simulations are performed on a random network having 10000 nodes with an average degree of 5. Here, we choose the EoN module in Networkx from python [13] and run these following simulations in Google Colaboratory. Varying the transition rates of each parameter we see the effects of that particular parameter on the time evolution of the dynamics through our model. The general dynamics have been depicted in Figure 8.2. It shows that eventually most of the people in the population get vaccinated, however the time of coverage might be different depending on the parameter values. Thus, to quantify this growth curve, we define vaccination coverage time as ζV:

Figure 8.2 Population of different classes vs. time.
Eventually most of the population gets vaccinated, but time of coverage depends on parameters.
This means that we consider a timescale, ζV, within which 90% of maximum vaccination, Vmax has been achieved. This will give us an estimate of the vaccination coverage speed.
8.3.1 Effect of Vaccination Rate
Vaccination rate is a major parameter of this dynamic. If you carefully observe different sub-populations, the effect could be prominently observed, as reported in Figure 8.3.
- Effect on vaccinated people: As we can see from the results in Figure 8.3(a), increasing the rate does not change the maximum number of vaccinated people, but it shifts the saturation point leftwards which means the system is reaching the saturation point faster.
- Effect on hesitant people: We can see from the plots shown in Figure 8.3(b) that increasing the rate shifts the peak point slightly leftwards, which means the system is reaching the peak point a bit faster and we also can see that the maximum number of people reaching in a hesitant class decreases a little bit.
- Effect on unwilling people: As we can see from the plots shown in Figure 8.3(c), increasing the parameter flattens the curve which means that the maximum number of people going to the unwilling class decreases, which can be explained by the success rate of the vaccination process.

Figure 8.3 (a) Vaccination coverage with time for different values of vaccination rate λ. (b) Time evolution of unwilling people in population with different values of vaccination rate parameter. (c) Time evolution of hesitant people in population with different values of vaccination rate parameter. (d) Vaccination coverage time (ζV) for different values of vaccination rate.
As shown in Figure 8.3(d), we can see that the saturation time decreases with increasing vaccination rate, that is λ, which states that this particular parameter will make the system reach the saturation point earlier.
8.3.2 Effect of Negative Rumors
Negative rumors often sway people towards some risky and dangerous activity. In this vaccination process, some negative rumors about the vaccine exist that concern matters like several side effects, cost effectiveness, fear, and misinformation regarding the vaccine. Hesitant people are often influenced by them. The parameter that takes into account this phenomena is β. The results related to this are shown in Figure 8.4.
- Effect on vaccinated class: As we can see in Figure 8.4(a), increasing the parameter, β, shifts the saturation point of vaccinated people rightwards. This means as more people feel negative about vaccination, more time will be taken by the system to reach the saturation point.
- Effect on unwilling class: In Figure 8.4(b), we can see that many people are motivated by their neighbors, friends, or relatives to believe some negative rumors about vaccination and refuse to get vaccines and along the way the maximum number of unwilling people increases.
8.3.3 Effect of Positive Peer Influence
Peer influence occurs when people are motivated or influenced towards something by seeing their neighbor or friends. When someone’s peers influence them to do something positive, it is considered as positive peer influence. In the vaccination context, positive peer influence occurs when someone who is vaccinated is motivating others who are not sure about vaccination. Here, the vaccinated people influence the hesitant people to get vaccinated. Here we are considering two parameters α and γ that take into account this phenomenon. The results related to this are shown in Figure 8.5 and Figure 8.6.
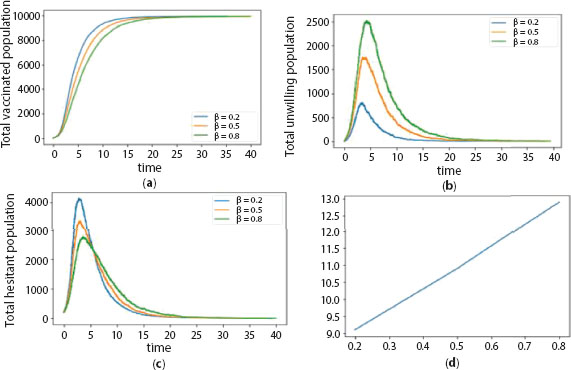
Figure 8.4 (a) Vaccination coverage with time for different values of negative rumor influence rate β. (b) Time evolution of unwilling people in population with different values of negative rumor influence rate parameter. (c) Time evolution of hesitant people in population with different values of negative rumor influence rate parameter. (d) Vaccination coverage time (ζV) for different values of negative rumor influence rate.
- Effect on Vaccinated people: As we can see in Figure 8.5(a) and 8.6(a), increasing the parameter shifts the saturation point of vaccinated people leftwards. This means the more people that feel positive about vaccination, then the sooner the system will reach the saturation point.
- Effect on Unwilling people: We can also see from Figures 8.5(b) and 8.6(b) that along the way, the maximum number of unwilling people decreases as they are getting motivated by some positive rumors towards vaccination.
So, we can draw the conclusion that if more people are well informed about the success rate of vaccination, then that would speed up the vaccination process and also decrease the amount of unwilling people. As shown in Figures 8.5(d) and 8.6(d), for both parameters of positive peer influence, that is, α and γ, the saturation time decreases with increasing parameters, which means positive peer influence will make the system reach the saturation point earlier.
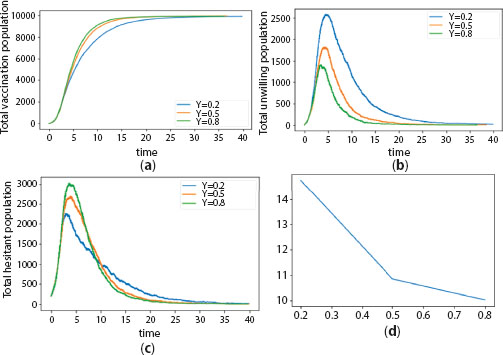
Figure 8.5 (a) Vaccination coverage with time for different values of positive peer influence rate γ. (b) Time evolution of unwilling people in population with different values of positive peer influence rate parameter. (c) Time evolution of hesitant people in population with different values of positive peer influence rate parameter. (d) Vaccination coverage time (ζV) for different values of positive peer influence rate.
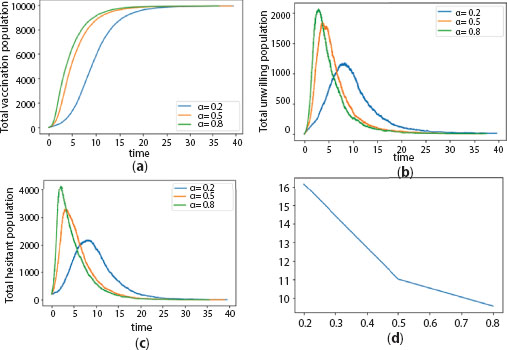
Figure 8.6 (a) Vaccination coverage with time for different values of positive peer influence rate α. (b) Time evolution of unwilling people in population with different values of positive peer influence rate α. (c) Time evolution of hesitant people in population with different values of positive peer influence rate α. (d) Vaccination coverage time (ζV) for different values of positive peer influence rate α.
8.4 Conclusions and Perspectives
Along with the infectious spread of SARS-COV2, the information and misinformation regarding available vaccines is also spreading person-to-person, causing a large-scale effect on vaccination coverage. Through computational analysis and network simulations, we have explored the contagion dynamics and proposed a framework to analyze this decision process. From the model it has been observed that the presence of the efficient vaccination systems can run the entire dynamic with positive feedback. This is a significant result, as we can see a lot of people not only in India but around the world are hesitant about getting vaccinated. In our model, we have shown that if the peer influence is overall positive, then the saturation point shifts leftwards, so we can conclude that the spreading of awareness about the positive effects of vaccination should be carried out on the ground level. We have also shown in our model that if vaccination rate increases, then the saturation point of V class shift leftwards. In real life we can explain it like this: if the vaccination rate in a particular area can be increased by awareness and smooth execution of the vaccination process by a competent authority, then the system would reach its saturation point sooner. A strong peer influence also might signify a strongly connected society. The shift of the saturation point leftwards for high positive peer influence means that physically and virtually everyone is well connected. This may also indicate high vaccination rates in urban areas. In the future we will focus on implementing further realistic terms in our model. For example, if someone from a hesitant class goes to the unwilling class, it can be considered that the person was under the influence of someone who has been vaccinated, thus we can bring the non-linearity. Mathematical explorations are used to find out the fixed points and bifurcations if there are any. Considering coupled dynamics or delayed dynamics of disease along with the infodemic might be another interesting future study.
References
- 1. W. Bank. The economy in the time of covid-19, 2020.
- 2. S. Bhattacharyya, A. Vutha, and C. T. Bauch. The impact of rare but severe vaccine adverse events on behaviour-disease dynamics: a network model. Scientific reports, 9(1):1–13, 2019.
- 3. A. A. Dror, N. Eisenbach, S. Taiber, N. G. Morozov, M. Mizrachi, A. Zigron, S. Srouji, and E. Sela. Vaccine hesitancy: the next challenge in the fight against covid-19. European journal of epidemiology, 35(8):775–779, 2020.
- 4. E. Dubé, M. Vivion, and N. E. MacDonald. Vaccine hesitancy, vaccine refusal and the anti-vaccine movement: influence, impact and implications. Expert review of vaccines, 14(1):99–117, 2015.
- 5. J. Eskola, P. Duclos, M. Schuster, N. E. MacDonald, et al. How to deal with vaccine hesitancy? Vaccine, 33(34):4215–4217, 2015.
- 6. K. B. Habersaat and C. Jackson. Understanding vaccine acceptance and demand—and ways to increase them. Bundesgesundheitsblatt-Gesundheitsforschung-Gesundheitsschutz, 63(1):32–39, 2020.
- 7. C. Jarrett, R. Wilson, M. O’Leary, E. Eckersberger, H. J. Larson, et al. Strategies for addressing vaccine hesitancy–a systematic review. Vaccine, 33(34):4180–4190, 2015.
- 8. K. Kalimeri, M. G. Beiró, A. Urbinati, A. Bonanomi, A. Rosina, and C. Cattuto. Human values and attitudes towards vaccination in social media. In Companion Proceedings of The 2019 World Wide Web Conference, pages 248–254, 2019.
- 9. D. Kumar, R. Chandra, M. Mathur, S. Samdariya, and N. Kapoor. Vaccine hesitancy: understanding better to address better. Israel journal of health policy research, 5(1):1–8, 2016.
- 10. H. J. Larson, C. Jarrett, W. S. Schulz, M. Chaudhuri, Y. Zhou, E. Dube, M. Schuster, N. E. MacDonald, R. Wilson, et al. Measuring vaccine hesitancy: the development of a survey tool. Vaccine, 33(34):4165–4175, 2015.
- 11. J. V. Lazarus, S. C. Ratzan, A. Palayew, L. O. Gostin, H. J. Larson, K. Rabin, S. Kimball, and A. El-Mohandes. A global survey of potential acceptance of a covid-19 vaccine. Nature medicine, 27(2):225–228, 2021.
- 12. J. Luyten, L. Bruyneel, and A. J. van Hoek. Assessing vaccine hesitancy in the UK population using a generalized vaccine hesitancy survey instrument. Vaccine, 37(18):2494–2501, 2019.
- 13. J. C. Miller and T. Ting. Eon (epidemics on networks): a fast, flexible python package for simulation, analytic approximation, and analysis of epidemics on networks. arXiv preprint arXiv:2001.02436, 2020.
- 14. A. Nishi, G. Dewey, A. Endo, S. Neman, S. K. Iwamoto, M. Y. Ni, Y. Tsugawa, G. Iosifidis, J. D. Smith, and S. D. Young. Network interventions for managing the covid-19 pandemic and sustaining economy. Proceedings of the National Academy of Sciences, 117(48):30285–30294, 2020.
- 15. P. Peretti-Watel, H. J. Larson, J. K. Ward, W. S. Schulz, and P. Verger. Vaccine hesitancy: clarifying a theoretical framework for an ambiguous notion. PLoS currents, 7, 2015.
- 16. P. Pronyk, A. Sugihantono, V. Sitohang, T. Moran, S. Kadandale, S. Muller, C. Whetham, and R. Kezaala. Vaccine hesitancy in indonesia. The Lancet Planetary Health, 3(3):e114–e115, 2019.
- 17. M. Sallam. Covid-19 vaccine hesitancy worldwide: a concise systematic review of vaccine acceptance rates. Vaccines, 9(2):160, 2021.
- 18. M. Siddiqui, D. A. Salmon, and S. B. Omer. Epidemiology of vaccine hesitancy in the United states. Human vaccines & immunotherapeutics, 9(12):2643–2648, 2013.
- 19. G. Troiano and A. Nardi. Vaccine hesitancy in the era of covid-19. Public Health, 2021.
- 20. N. Wang, Y. Fu, H. Zhang, and H. Shi. An evaluation of mathematical models for the outbreak of covid-19. Precision Clinical Medicine, 3(2):85–93, 2020.
Note
- ⋆ Corresponding author: [email protected]