
4
Detection and Classification of Leaf Blast Disease using Decision Tree Algorithm in Rice Crop
Sarvesh Vishwakarma1⋆ and Bhavna Chilwal2
1Department of CSE, Graphic Era (Deemed to be University), Dehradun, India
2Department of CSE, DIT University Dehradun, Uttarakhand, India
Abstract
The agricultural field is the most important field for any nation but some issues prevail and affect agricultural products every year. Agricultural diseases are the main concern for yield loss. This chapter uses the Decision Tree technique to form a tree structure for leaf blast disease level detection in rice crops. A Decision Tree is used as a classification technique and here disease levels are classified based on symptoms that occur during infection. The Iterative Dichotomiser 3 (ID3) algorithm is one of the important methods to form a Decision Tree based on entropy and information gain. The nodes in the tree are the symptoms that have different labels for disease occurrence. This decision tree will help detect the occurrence of disease as per the symptoms and help farmers get information about the severity level of a disease so that they can take required measures on time to save the crop from loss.
Keywords: Decision tree, ID3 algorithm, entropy, information gain, leaf blast disease
4.1 Introduction
There are so many fungal diseases that prevail in rice, but this chapter focuses on leaf blast disease in rice crops. Blast disease is also known as rice fever. Agricultural scientists find out about the disease by checking their symptoms, similarly, this paper uses three particular symptoms for leaf blast [5]. These symptoms will be used to form a decision tree and detect the labels of disease occurrence (as shown in Figure 4.1(a) and Figure 4.1(b)).

Figure 4.1 Comparison between healthy and diseased leaf.
The decision tree uses attributes to classify the leaves according to symptoms. Every decision tree comprises of two types of nodes: a Decision Node and the Decision Leaf Node. Different classification algorithms are used nowadays to implement decision trees. Here, an ID3 classification algorithm is used for implementation.
This algorithm stands for Iterative Dichotomiser 3. This algorithm forms the smallest decision tree possible. The ID3 algorithm uses the Entropy and Information Gain [6–8, 13]. The role of Entropy is to control the splitting of the data for the decision tree. With the help of entropy, the boundaries of the decision tree are decided. The formula for class entropy is given below:
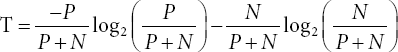
For a sample of negative N- and positive P+ Entropy for each attribute:
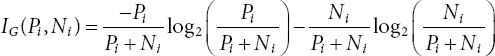
The information gain calculates the decrease in the value of entropy after data gets split on different attribute values. The decision tree finds the parameter value which has the highest information gain. The three symptoms taken for disease detection are the growth stage of the rice crop, disease index, and lesion type [1]. Linguistic variables are taken for different ranges of these variables. The ID3 algorithm will detect the leaf blast disease in rice crops by using these symptoms as the attributes and decide from which class the rice leaf belongs. The implementation of a decision tree in different research is very vast. It framed different rules to form a decision tree that is influenced by climatic parameters for the productivity of soybeans [2]. The tree takes symptoms and forms forty rules for fuzzy logic for detecting leaf blast disease by using regression methodology [3]. A decision tree classifier is used by measuring the temperature and soil moisture as parameters to form a system for predicting cotton crop disease [4]. Medical data mining for the prediction of heart disease is done by using Naïve Bayes and decision tree algorithms [8, 11, 12] and this research work shows a prediction accuracy of 99%. A prototype was used to evaluate the severity of disease on rice crops by using computational intelligence and machine learning. K-Mean segmentation has been used with fuzzy logic to calculate the degree of the disease that occurred in rice plants [9, 10]. The prototype has 86% accuracy.
4.2 Proposed Methodology
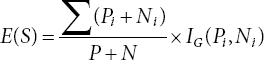
The symptoms and rule table are considered based on the work described in [14, 15], which presents fuzzy rule techniques for different combinations of symptoms [16–18]. First of all, we take the attributes of a dataset and form a table that comprises linguistic values regarding each attribute and response column with positive or negative responses [19, 20]. Then, we calculate the class entropy for the whole table, i.e., Entropy (T). But among all the attributes we have to find the root attribute for the tree, we calculate the information gain for each attribute which is then used to find the entropy value of that specific attribute, i.e., Entropy (X). The computation of gain has to be performed after getting the attributed entropy values and comparing them against the class entropy (as shown in Equation 4.4).
The attribute which has maximum gain value becomes the root node and again the iteration of the whole process starts for expanding the tree [21–23]. So, to form the table we have provided linguistic terms for different values of each attribute or symptom. The rice plant has three important growth stages and during these stages, the plant has some height between 1 cm to 100 cm on average. Therefore, the linguistic variables [24–26] for the Growth Stage are mentioned below:
- Germinating Stage – Small (S)
- Vegetative Stage – Moderate (M)
- Reproduction Stage – Tall (T)
For the disease index, the range of input scores is varying from 0 to 100%. Scores are predefined in the standard evaluation system by IRRI 2015. The linguistic variables for different scales are provided below:
- Score 1 and 3 – Low
- Score 5 and 7 – Mid
- Score 9 – High
Lesion type (standard evaluation system of rice (SES), IRRI 2015) values are taken from scale 5 to scale 9 because as per the experts, the lesions are noticeable properly.
- Scale 5 and 6 – Low
- Scale 7 and 8 – Mid
- Scale 9 – High
The result column has two specific classes for which two values are used to provide disease labels:
- Resistive R (+) for healthy leaves or leaves with a very small effect
- Susceptive S (-) for diseased leaves which need proper care and are harmful for crop production
4.3 Result Analysis
After deciding the linguistic values for different symptoms, we formed a rule base table (as shown in Table 4.1), which has fourteen combinations of these symptoms with their disease occurrence labels. The computation of class entropy for the disease occurrence has been done as below:
Resistive (+) = 4
Susceptive (-) = 10
Table 4.1 Rule-based disease occurrence.
| Growth stage | Disease index | Lesion type | Occurrence label |
|---|---|---|---|
| Small | No | No | R (+) |
| Moderate | Low | No | R (+) |
| Moderate | Low | Low | R (+) |
| Tall | Mid | Mid | S (-) |
| Moderate | Low | Low | S (-) |
| Tall | Mid | Mid | S (-) |
| Moderate | Mid | Mid | S (-) |
| Tall | Mid | Mid | S (-) |
| Tall | High | High | S (-) |
| Tall | Mid | Mid | S (-) |
| Moderate | Low | Mid | S (-) |
| Moderate | Low | Low | R (+) |
| Moderate | High | Low | S (-) |
E (Disease Occurrence) = E (4, 10)
E (4, 10) = − (0.714 log2 0.714) − (0.286 log2 0.286) = 0.863
This value is used to find the Gain for each attribute separately, as shown in Table 4.2.
The choice of parameter is done to reflect the highest gain value for the decision tree. Therefore, the ID3 algorithm is applied for creating a decision tree and we detect the symptoms which have maximum impact and that will become the root of the tree, i.e., lesions type as it has the highest information gain value. The attribute which has the greatest gain as the decision node becomes the root of the decision tree so the tree would look like a three-child leaf (Low, Mid, and High) with root node Lesions Type.
Table 4.2 Gain value for each attribute.
| Growth stage | R(+) | S(-) | IG | Growth stage | |
|---|---|---|---|---|---|
| Entropy | Gain | ||||
| Low | 0 | 0 | 0 | 0.496 | 0.367 |
| Moderate | 4 | 3 | 0.951 | ||
| Tall | 0 | 7 | 0 | ||
From Table 4.3, we get all mid and high-range lesion types having disease occurrence response as the susceptive (+) class label response, meaning the farmers have to take measures to stop the severity of the disease. But the low range of lesions type has two responses, both resistive and susceptive labels, for some rows so we take the next attribute branch which has the second greatest information gain, i.e., disease index which is 0.46, as depicted in Table 4.4.
Table 4.3 Lesion types for each attribute.
| Lesion type | R(+) | S(-) | IG | Lesion type | |
|---|---|---|---|---|---|
| Entropy | Gain | ||||
| Low | 4 | 1 | 0.721 | 0.281 | 0.582 |
| Mid | 0 | 7 | 0 | ||
| High | 0 | 2 | 0 | ||
Table 4.4 Disease index for each attribute.
| Disease index | R(+) | S(-) | IG | Disease type | |
|---|---|---|---|---|---|
| Entropy | Gain | ||||
| Low | 4 | 2 | 0.9198 | 0.397 | 0.466 |
| Mid | 0 | 5 | 0 | ||
| High | 0 | 3 | 0 | ||

Figure 4.2 Detection of root node for decision tree.
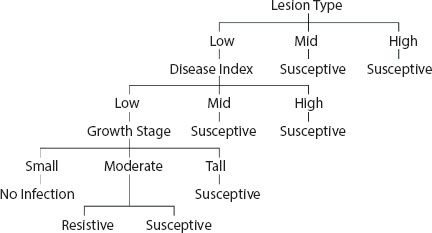
Figure 4.3 Final decision tree for leaf blast disease.
Figure 4.2 has been derived by using two major symptoms of leaf blast disease in which lesion type is the root node.
Now, in the next iteration we take the third greatest information gain attribute branch, i.e., the growth stage with a gain value of 0.367. The tree would take the shape, as shown in Figure 4.3.
4.4 Conclusion
Disease in crops and plants is a major problem faced by farmers. The traditional methods to detect the occurrence of diseases are tiresome, costly, and are not time efficient in comparison with the new soft computing techniques which provide a digital era in the agricultural sector. The decision tree provides an easier view of the whole process and how to detect the occurrence level of disease. We can say that the crop has specific symptoms during a particular type of disease. This means by making use of symptoms, the risk level could be detected which is very helpful for farmers and agricultural scientists to save the yield loss.
4.5 Future Work
The future scope for this work is to implement the tree by using different algorithms, except for ID3. Also, we can form the decision tree for the classification of other diseases. We can also extend this work by using a Random Forest algorithm by making more than one decision tree.
References
- 1. Pari Skamnioti, Sarah J. Gurr, Against the grain: safeguarding rice from rice blast disease, Trends in Biotechnology, Volume 27, Issue 3, 2009, Pages 141-150, ISSN 0167-7799, https://doi.org/10.1016/j.tibtech.2008.12.002.
- 2. P. Udupa, S. Vishwakarma, A survey of MRI segmentation Techniques for Brain Tumor Studies, Bonfring International Journal of Advances in Image Processing, Vol. 6, No. 3, August 2016, pp. 22-27. Doi: http://www.journal.bonfring.org/papers/aip/volume6/BIJ-10467.pdf
- 3. F. M. Shamim, S. Vishwakarma, Exploiting the Motion Learning Paradigm for Recognizing Human Actions, Bonfring Internation Journal of Advances in Image Processing, Vol. 6, No. 3, August 2016, pp. 11-16. http://www.journal.bonfring.org/papers/aip/volume6/BIJ-10465.pdf
- 4. Chopda, J., Raveshiya, H., Nakum, S., Nakrani, V., 2018. Cotton crop disease detection using decision tree classifier. International Conference on Smart City and Emerging Technology (ICSCET), 1–6.
- 5. Donatelli, M., Magarey, R.D., Bregaglio, S., L., W., Whish, J.P.M., Savary, S., 2017. Modelling the impacts of pests and diseases on agricultural systems. Agricultural Systems 155, 213–224.
- 6. Edwards-Murphy, F., Magno, M., Whelan, P.M., O’Halloran, J., Popovici, E.M., 2016. b+wsn: Smart beehive with preliminary decision tree analysis for agriculture and honey bee health monitoring. Computers and Electronics in Agriculture 124, 211–219.
- 7. Ilic, M., Ilic, S., Jovic, S., Panic, S., 2018. Early cherry fruit pathogen disease detection based on data mining prediction. Computers and Electronics in Agriculture (Elsevier) 150, 418–425.
- 8. Karthiga, A.S., Mary, M.S., Yogasini, M., 2011. Early prediction of heart disease using decision tree algorithm. International Journal of Advanced Research in Basic Engineering Sciences and Technology (IJARBEST) 3(03).
- 9. Nithya, A., Sundaram, V., 2011. Wheat disease identification using classification rules. International Journal of Scientific & Engineering Research 2(09), 1–5.
- 10. Sethy, P.K., Negi, B.S., 2018. Measurement of disease severity of rice crop using machine learning and computational intelligence. Cognitive Science and Artificial Intelligence (Springer) 2, 1–11.
- 11. Shouman, M., Turner, T., Stocker, R., 2011. Using decision tree for diagnosing heart disease patients. 9th Australasian Data Mining Conference (AusDM 2011) 121, 23–29.
- 12. Singh, P., Jagyasi, B., Rai, N., Gharge, S., 1–6. Decision tree-based mobile crowdsourcing for agriculture advisory system. 2014 Annual IEEE India Conference (INDICON), 2014.
- 13. Zhang, Y.D., Wang, S., Dong, Z., 2014. Classification of alzheimer’s disease based on structural magnetic resonance imaging by kernel support vector machine decision tree. Progress In Electromagnetics Research 144, 171–184.
- 14. Vishwakarma, S., Agrawal, A. A survey on activity recognition and behavior understanding in video surveillance. Vis Comput 29, 983–1009 (2013). https://doi.org/10.1007/s00371-012-0752-6
- 15. S. Vishwakarma and A. Agrawal, A novel approach for feature quantization using one-dimensional histogram, 2011 Annual IEEE India Conference, 2011, pp. 1-4, doi: 10.1109/INDCON.2011.6139391.
- 16. S. Vishwakarma, A. Sapre and A. Agrawal, Action recognition using cuboids of interest points, 2011 IEEE International Conference on Signal Processing, Communications and Computing (ICSPCC), 2011, pp. 1-6, doi: 10.1109/ ICSPCC.2011.6061680.
- 17. V. Shetty, S. Vishwakarma, Harisha and A. Agrawal, Design and implementation of video synopsis using online video inpainting, 2017 2nd IEEE International Conference on Recent Trends in Electronics, Information & Communication Technology (RTEICT), 2017, pp. 1208-1212, doi: 10.1109/ RTEICT.2017.8256790.
- 18. S. Vishwakarma and A. Agrawal, Framework for human action recognition using spatial temporal based cuboids, 2011 International Conference on Image Information Processing, 2011, pp. 1-6, doi: 10.1109/ICIIP.2011.6108881.
- 19. A. Genovese, V. Piuri, F. Scotti and S. Vishwakarma, Touchless Palmprint and Finger Texture Recognition: A Deep Learning Fusion Approach, 2019 IEEE International Conference on Computational Intelligence and Virtual Environments for Measurement Systems and Applications (CIVEMSA), 2019, pp. 1-6, doi: 10.1109/CIVEMSA45640.2019.9071620.
- 20. R. Singh, S. Vishwakarma, A. Agrawal, and M.D. Tiwari, Unusual activity detection for video surveillance, IITM ‘10: Proceedings of the First International Conference on Intelligent Interactive Technologies and Multimedia, December 2010 Pages 297–305 https://doi.org/10.1145/1963564.1963616
- 21. Donida Labati R., Genovese A., Piuri V., Scotti F., Vishwakarma S. (2020) Computational Intelligence in Cloud Computing. In: Kovács L., Haidegger T., Szakál A. (eds) Recent Advances in Intelligent Engineering. Topics in Intelligent Engineering and Informatics, vol 14. Springer, Cham. https://doi.org/10.1007/978-3-030-14350-3_6
- 22. Vishwakarma, S. and Agrawal, A., 2010. A Robust Algorithm for Shadow Removal of Moving Object Detection in Video Surveillance System. International Journal of Recent Trends in Engineering and Technology, ACEEE, AMAE, and ACEE, USA, 4(1), pp.73-75.
- 23. Donida Labati, Angelo Genovese, Vincenzo Piuri, Fabio Scotti, Sarvesh Vishwakarma, I-SOCIAL-DB: A labeled database of images collected from websites and social media for Iris recognition, Image and Vision Computing, Volume 105, 2021, 104058, ISSN 0262-8856, https://doi.org/10.1016/j.imavis.2020.104058
- 24. Vishwakarma S., Agrawal A. (2012) Representing Feature Quantization Approach Using Spatial-Temporal Relation for Action Recognition. In: Kundu M.K., Mitra S., Mazumdar D., Pal S.K. (eds) Perception and Machine Intelligence. PerMIn 2012. Lecture Notes in Computer Science, vol 7143. Springer, Berlin, Heidelberg. https://doi.org/10.1007/978-3-642-27387-2_13
- 25. Acharya P., Vishwakarma S., Abnormal Crowd Behavior Detection using Structural Context Descriptor, Bonfring Internation Journal of Advances in Image Processing, Vol. 6, No. 3, August 2016, pp. 17-21 DOI: 10.9756/ BIJAIP.10466
- 26. Udupa P., Vishwakarma S., Segmentation of Brain MRI to differentiate Healthy and Tumor Affected Tissues along with Subsequent Tumor Grading, International Journal of Image Processing and Applications, Vol. 1, Issue 01, October 2016, pp. 1-6.
Note
- ⋆ Corresponding author: [email protected]