A Project (Drawing Program)
Now that we are focusing on object-orientation and the development of larger programs, it will be helpful to have a larger program that we work on in this book. This chapter will introduce a project that we will develop incrementally in many of the following chapters. You will be building other large programs as part of the projects in the rest of this book as well, but it is helpful for you to see something besides the code that you are creating to give you a more complete view of how things work.
The program that we are going to develop is a drawing program. It is not going to be like Paint® or quite like any other "normal" drawing program. We will do a few things differently to make it so that this program can better illustrate key concepts through the rest of the book. A few things will be thrown in just for educational purposes, but in general features will be included to produce a final application that is capable of things that you do not normally see in drawing programs, including animation.
18.1 Software Development Stages
As was originally discussed in section 7.11. There are five stages involved in the production of any large software system. There are many different approaches to organizing these five stages, but the general nature of them is always the same, and they all have to be involved. The five stages are as follows.
Analysis This is where things begin. During analysis the developers figure out what it is that the program is supposed to do. This is a problem definition phase. The more detailed the analysis, the easier the other stages will be. In practice, it is not possible to get an initial analysis that covers everything, and inevitably, things change over time on real products. For this reason, while all software must start with analysis, it is not something you finish and leave, you generally have to come back to it. Analysis is very independent of programming and only looks at what you want to do, not how to do it.
Design After you have sufficient analysis so you know what you are trying to do, the development turns to figuring out how to produce the desired result in code. This is the design phase where you map out what will be happening in the code. Once again, a more complete design will make life easier later on, but realize it is basically impossible to make a perfect and complete design initially, so this is something that will also be revisited. The design phase discusses code, but does not actually involve writing code.
Implementation The middle of the five stages is where you actually write the code. This book, and much of your introduction to Computer Science (CS), focuses on developing your ability to write code. However, this is only one phase in the life cycle of software development and when things are done well it can actually be a small phase relative to others. This is the focus early on though because you can not really do any of the other phases, with the possible exception of analysis, unless you have a strong grasp of how the implementation will work.
Debugging At this point you should have already learned that just writing a program is not the biggest hurdle you have to clear. Finding the errors in the program can take far longer. The process of finding and fixing errors is called debugging. It is an ongoing process in software development and it often takes significantly longer than the implementation.
Maintenance After the software is deemed complete and sufficiently free of errors/bugs, it is released. This ushers in the maintenance phase. Maintenance is something that is hard to simulate in a classroom environment, but it is critical for most professional software. People who pay money for a piece of software often want to know that if they find something wrong, someone will be there to correct it. Often customers will think of additional features they would like to see as well. Maintenance is the general process of dealing with issues in the software after it has been released.
You will come back to these different steps in many later CS courses. The field of software engineering is all about how to do these things in a way that produces the best results with the minimal amount of effort.
18.2 Analysis
So what exactly is entailed in the analysis phase of software design? What do you have to do in order to be able to say that you know what problem you are solving? One key way to approach this question is to think about how the software is going to be used. Picture a user running the software. What different types of users are there? What are the different ways they can interact with the system? By answering these questions, you can come to truly understand the main functionality of the software.
There are many different approaches to doing software analysis (and design). Simply writing down prose that describes the system is an option, but not a very good one because it is dense and requires anyone viewing the document to do a significant amount of reading to get the needed information from it. For this reason, there are diagramatic approaches to analysis that can communicate key ideas quickly. These are backed up by prose that provide details which are not captured in the diagram. One of these is the Use-Case diagram. This is one of a number of different diagram specifications that constitute the Unified Modeling Language (UML).
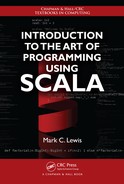
A Use-Case diagram includes various actors and the use-cases they participate in. Actors often represent humans in different roles, but they can also represent software from outside of the current system that communicates with that system asking it to do things. Figure 18.1 shows a very simple use-case diagram with a single actor and a few basic use-cases. As you can see, actors are represented with stick figures. Ease of drawing is a significant feature of UML diagrams. One could say that they are whiteboard friendly. Indeed, whiteboards are a common feature of many software development companies and one of the main roles of use-case diagrams and the other UML diagrams is to provide an efficient, common language to communicate ideas to other people.
This is a simple example of a UML Use-Case diagram. Actors are drawn as stick figures. The system being analyzed is a box. The ways in which the actors use the system are drawn as circles.
Figure 18.1 has a large box in it that represents the system being analyzed. This is the standard notation for use-case diagrams. Note that the actor is outside of the system. This makes sense, unless you happen to be putting people into your software. This is also why other pieces of software are represented as actors. They are not part of what you are focusing on. They are external and send in commands to make things happen.
Inside the system there are a few bubbles with text in them that represent use-cases. There are lines from the actor to the "Login" and "Logout" use-cases to indicate that these are actions that the "User" can initiate. The bubbles represent things that can be done in the software and the lines indicates who can do it. If your system had both regular users and administrators as two types of actors, the administrator would have lines to use-cases that were not available to the normal user. Actions like deleting a user account should not be part of the options given to normal users.
There are two other use-case bubbles shown with the text "Enter Credentials" and "Re-validate". These both have annotated arrows connecting them to the use-case for "Login". The arrow pointing from "Login" to "Enter Credentials" is annotated with the text "<<include>>". This indicates that when the "Login" use-case is invoked, it can include having the user enter his/her credentials. The arrow pointing from "Re-validate" to "Login" is annotated with "<<extends>>". This implies that the source of the arrow is a subtype of its destination. So having the user re-validate is shown to be a special case of logging in.
Use-case diagrams might seem a little silly, but they can force you to really think about all the different actions that a user should be able to do in your application and then to see how those different actions fit together. That can be very useful as you enter the design step of building your software.
18.3 Design
In the first half of this book, most of the work you did in the design process was to break the problem down into different functions and decide what data needed to be passed between those functions. When you are working in an object-oriented mode the design process involves figuring out the types of objects that you need in the programs and laying out classeses, objects, and traits for them. Each class, object, and trait can have member data and and methods in it.
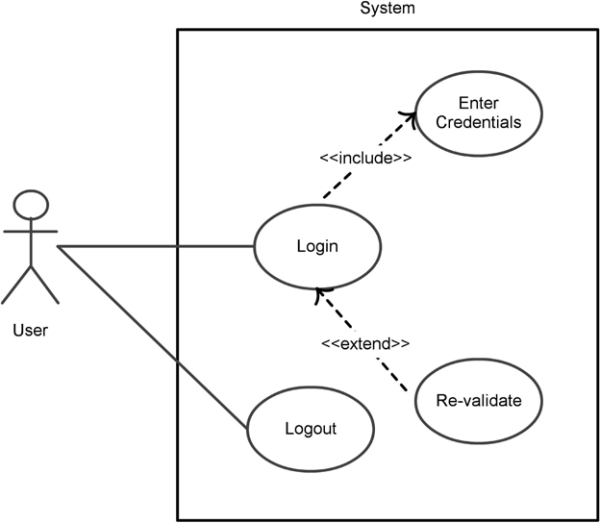
The way to represent this in UML is with a Class diagram. Figure 18.2 shows a simple class diagram showing two classes, one for a Student type and one for a Course type. Each class is represented with a box that has three different parts. The top is the name of the type. Below that are the data members of the type. The bottom section lists the methods for that type. The data members and methods are preceded by a symbol indicating their visibility. A ’+’ indicates that it is public, a ’-’ indicates that it is private, and a ’#’ indicates that it is protected.
This is a simple UML class diagram that shows a course that can contain multiple students.
This figure also shows an arrow between the Course and Student classes. There are multiple types of arrows the are used in class diagrams. We’ll see more of them over time. This particular style of arrow represents composition. It implies that a Course is composed of multiple Students.
Like the use-case diagram, the class diagram does not show you everything about a system. However, it does communicate quite a bit of information in a format that people can read quickly and easily. The information that it imparts is particularly significant for helping them understand how the system works. The most obvious piece of information is the classes/types that are used in the system. It also gives you a quick reference to the capabilities of the different elements through the methods and member data.
What is less obvious is that the lines and arrows can be just as important. By showing you the links between different parts of a system, a class diagram lets you quickly see what parts are critical to the working of other parts. This lets you identify key points in the system that can lead to failures or vulnerabilities. Looking at a system at this higher level can also help you to see structures that might not otherwise jump out at you.
You will occasionally see an even less detailed version of the class diagram that represents each class by a simple box with arrows, leaving out the member data and methods. This view exists because often knowing the classes and the relationships between them is more important than knowing the details of any one class.
There is a lot more to UML class diagrams, including not only other types of arrows to represent different relationships, but also boxes for packages and annotations on the relationships between types. These different aspects will be introduced as needed in later chapters.
18.4 Making Packages
Large software projects that have a lot of code in them need to be organized. This is done by adding packages. We saw in the last chapter how we can create new packages in Eclipse. In Java, packages are always represented as directories and creating packages in Eclipse will mirror this arrangement. Scala does not require that source files be organized into a directory structure that mirrors the packages, but doing so is recommended to make it easier to find files.
In a source file, you specify a package using the package keyword. If everything in a file is in a single package, you can place a line at the top of the file that specifies the package. You can also follow a package declaration with curly braces and the code inside that block will be in the specified package. In this book we will use the first approach based on the idea that packages should be reasonably large groupings of code and single files should not get too long.
Note that in Eclipse, you need to be careful that the object and package names in files match those of files and directories if you want to run main method as an application. If the file has a package declaration that does not match the directory location, or the name of the file does not match the name of the object, Eclipse will tell you that it can not find the class when you try to run it.
18.5 Project Analysis and Design
Now it is time to start working on the project that we are going to carry forward through the rest of the book. This is going to be a fairly big piece of software, so as was just discussed, we should start with the analysis and then work on the design some before we try to implement anything. We are not going to try to figure out every possible option that could go into the software right now. We want to figure out enough that we have some direction to go in. We also want to identify where we might want to add functionality later so that as we move into the design phase, we can keep those in mind.
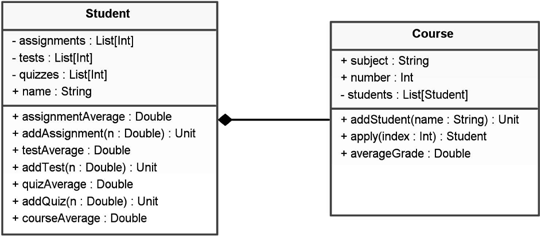
The program itself is a drawing program that has the flexibility of text input to issue commands. Figure 18.3 shows a use case diagram for our system. There are two actors in the diagram. The obvious one is the user who is running the program. This user has the ability to add elements to the drawing and edit elements of the drawing. They also have the ability to give text commands to the program. The less obvious parts of the diagram involves having two separate instances of the program talk to one another. This leads to use-cases where the local user makes connections to other instances of the program and does things such as sending them parts of drawings or other forms of communication.
This diagram shows some arrows connecting different use cases. The solid line with the open arrow indicates a generalization. This implies that one use-case is a specific type of another use-case. There is also a dotted arrow with an open head labeled <<include>>. That style of arrow indicates that whenever one use-case occurs, another will be included as part of it. This diagram is sufficient for our current needs. It lays out the basic operations of the program, and its creation forces us to think about what it is we want the program to be able to do. With that in place we can start to lay out a design.
Like the analysis, we will only take the design so far at this point. Unlike the analysis, part of this is because we need to learn a few more things to complete the design. There are a few things that we can put in place with our class diagram. These are shown in figure 18.4, which has four boxes representing three classes and one object. The object contains the main method for our application as well as some other aspects required for the Graphical User Interface (GUI). A TabbedPane is being used in the main window so that there can be multiple drawings open, each with its own tab. There is also a private method that is called when the user selects to create a new drawing and a Buffer of the drawings that are currently open. A <<uses>> arrow is drawn from the DrawMain object to the Drawing class to represent that DrawMain depends on the functionality of the Drawing.
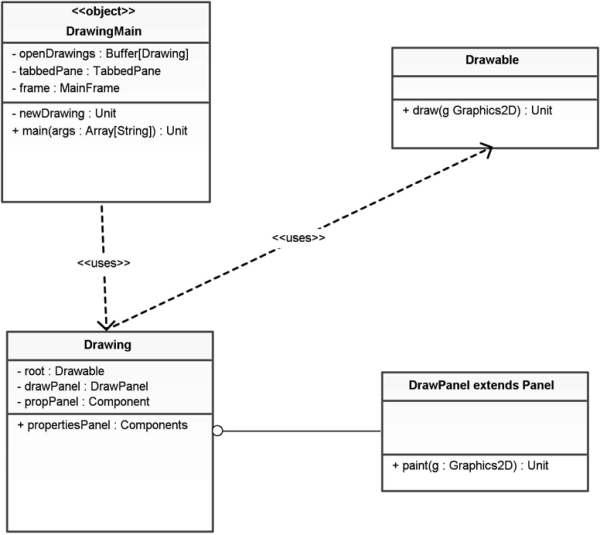
The Drawing type keeps track of a root Drawable and two GUI components that are significant for interacting with the Drawing. It has a method for getting hold of a Component that lets the user interact with the properties of the Drawing. The Drawing class contains another class called DrawPanel which, as the name implies, is a custom-drawn panel in which the drawing will actually appear.
18.6 Implementing the GUI
At this point we have a sufficient understanding of what we want to do to start actually writing a little code. At least initially, the only thing we will set up is the GUI for the program and a little other code to get the program running.
The simplest class in this application is the Drawable class. This is largely because we do not yet have the knowledge of what should go inside of it. The current code, minus package statements and imports, is just this.
class Drawable {
def draw(g:Graphics2D) {}
}
In many ways, this code is simply a placeholder for now so that the other parts of the code will compile. The next chapter will give us the means to put more into this.
The next step up in complexity is the DrawingMain object. At this point, this is a fairly basic GUI that opens a frame with a menu and a tabbed pane. Initially there are no tabs. Each drawing that the user creates or opens up will be displayed as a tab. The code for this is shown here.
object DrawingMain {
private val tabbedPane = new TabbedPane
private val openDrawings = mutable.Buffer[Drawing]()
private def newDrawing {
val nd = new Drawing
openDrawings += nd
tabbedPane.pages += new TabbedPane.Page("Unnamed",nd.propertiesPanel)
}
private val frame = new MainFrame {
contents = tabbedPane
menuBar = new MenuBar {
contents += new Menu("File") {
contents += new MenuItem(Action("New")(newDrawing))
contents += new Separator()
contents += new MenuItem(Action("Exit")(sys.exit(0)))
}
}
size = new Dimension(800,600)
}
def main(args : Array[String]) : Unit = {
frame.visible = true
}
}
As you can see, there are currently only two menu options for adding a new drawing and exiting. The new drawing option makes a new drawing and adds a tab for it. Clearly this does not fully implement the use case diagram. That will take a bit more effort to build.
The last two classes are inside of a single file with the DrawPanel embedded inside of the Drawing type. This class is responsible for laying out the majority of the GUI. That is a significant task as most of the interaction of the program will take place in this environment. If it is too limiting it will not let us do the things that we want.
This drawing program is based on the concept of a scene graph. This is a data structure that organizes different elements of a drawing in a hierarchy so that changes can be made in one place that will impact a whole group of geometry elements. There are four basic pieces of information we need displayed: the drawing itself, the hierarchy of Drawables, the properties of a selected Drawable, and command input and output elements. It is hard to know in advance how much space a user will want to give to these elements so SplitPanes are a good choice of GUI component to use for the setup. Having things nested in ScrollPanes will also help the user see things if they get bigger than the space on screen. Here we see code for building such a GUI.
class Drawing {
private val drawPanel = new DrawPanel
private val root = new Drawable {}
private var propPanel:Component = null
def propertiesPanel = {
if(propPanel == null) {
val commandField = new TextField()
val commandArea = new TextArea()
commandArea.editable = false
val commandPanel = new BorderPanel {
layout += commandField -> BorderPanel.Position.North
layout += new ScrollPane(commandArea) -> Border Panel. Position. Center
preferredSize = new Dimension(500,200)
}
val tree = new javax.swing.JTree
val drawProps = new GridPanel(1,1)
propPanel = new SplitPane(Orientation.Vertical,
new GridPanel(2,1) {
contents += new ScrollPane(new Component {
override lazy val peer = tree
})
contents += new ScrollPane(drawProps)
},new SplitPane(Orientation.Horizontal,
new ScrollPane(drawPanel),
commandPanel))
}
propPanel
}
class DrawPanel extends Panel {
preferredSize = new Dimension(500,500)
override def paint(g:Graphics2D) {
g.setPaint(java.awt.Color.white)
g.fillRect(0,0,size.width,size.height)
root.draw(g)
}
}
}
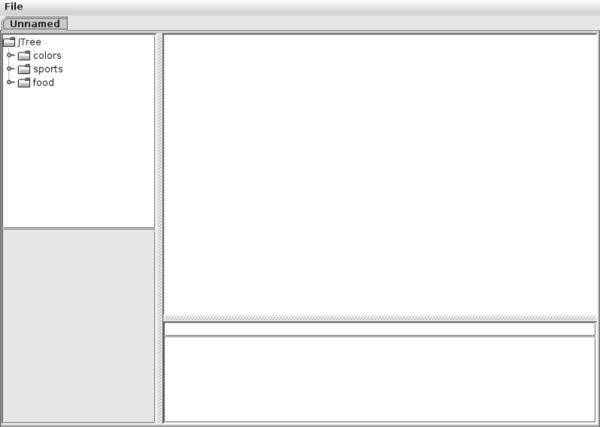
There is a SplitPane with a vertical bar at the top of the GUI. On the left side of the bar is a GridPanel with a JTree on the top and an empty GridPanel on the bottom. The JTree will be used to display the hierarchy of Drawables and the empty panel, called drawProps, will display whatever information the selected Drawable requires for settings. On the right side of the top SplitPane is another SplitPane that has a horizontal bar. Above that bar is the drawing in the form of a DrawPanel, and below the bar is a panel that contains a TextField for inputing commands and a TextArea to display the output of those commands.
With these three files we can run the DrawingMain as an application and, after adding one new drawing, it produces the window shown in figure 18.5. As you can see, significant parts of this remain blank. The JTree has some things in it that you can interact with, but they have no relationship to what this program is doing. They are part of the default appearance and will go away later when we put in a proper implementation. The TextField will allow you to type in it, but it will not cause anything to happen. Many of these shortcomings will be fixed in the next chapter.
18.7 End of Chapter Material
18.7.1 Summary of Concepts
- The software life cycle is the different steps taken in creating a piece of software.
- The process of figuring out what the program is actually supposed to do is called analysis.
- Laying out how code is going to be written is called design.
- Implementation is the actual act of writing the software.
- After code has been written you have to go through debugging to correct any errors that have been put into the code.
- After software is released, the continued work on it for enhancements and further bug fixes is called maintenance.
- UML stands for Unified Modeling Language and it is a standard for a number of diagram types that are used for the software development process. This chapter introduced two of them.
- The Use-Case Diagram is a style of diagram used during analysis to help consider the ways in which users and other outside entities interact with the software.
- A Class Diagram is a diagram that shows a rough sketch of major code groupings like classes, objects, and traits as well as relationships between them.
- This chapter also introduced a project that will be used through the rest of the book. It also begins the analysis and design of that project.
18.7.2 Exercises
- Describe the different phases of the software life cycle.
- Imagine that you are writing software that has to model a car. Draw a UML diagram for how you might break down that problem.
- Draw use-case and class diagrams for a project from the last chapter.
18.7.3 Projects
This chapter described a new project that will be followed through the rest of the text and there will be new lines of projects at the end of chapters too. There are several different projects that are developed through the rest of this book. Information on these and how different projects in each chapter are related to different end projects as well as some sample implementations can be found at the book’s website. The projects in this chapter have you getting started by laying out some initial foundation and gaining some experience with what you are doing. Note that code you write this early is not likely to survive all the way to the end of the book. You are going to learn better ways of doing things and when you do, you will alter the code that you have written here.
- One option has you writing a multiuser, networked text-based game, sometimes called a MUD. If you did the text-based game in the first half of the book then you already have some code you might be able to use for this. For this project at this time, you should make a number of classes to represent things like characters, rooms, and items in the game. Have it so that they can be read in from file and written out to file. Create an object with a main method that you can use to run the game and have a single player walk through the world.
A full MUD implementation will also include computer-controlled characters. At this point only include one type of these. Make it so that character moves randomly around the map as the player executes commands. If the player enters the same room as that character, the description should show them much as it would items in the room.
- Another option for the project is a web spider for data collection and processing. This option can be customized to fit lots of fields. The basic idea of a web spider is that it loads pages and follows links to get to other pages. Search engines like Google® use spiders to find data and index it so that people doing searches can find it. This project will be much more focused so that you do not require an entire farm of servers to make it run.
The idea here is that you are spidering one site or a short list of sites for particular types of files. You might be looking for certain data sets, images, box scores, or anything else that you can find a way to recognize. You might want to have several possibilities. The program will compile that information and then provide useful ways for the user to view it.
For this project option, you can currently build a GUI and think about what data you want to collect and set up some classes to store that information. Pull down one or two files manually (consider using wget) and have the GUI do a minimal display of the information from those files.
- You can make a graphical game that is fairly simple, but includes networking so that multiple players can play with or against one another. The possibilities for this are extremely broad and range from puzzle games like Tetris where you have classes for Board and Piece to strategy or RPG games where you have Units and Cities or Characters and Items.
At this time you should put together a GUI and get code up where you can have the player at the computer the application is running on move something around that is visible in the GUI.
- Instead of doing networking, you can make a more complex graphical game that includes computer-controlled players with more significant Artificial Intelligence. The steps at this point will be about the same for this option as for the last one.
- By the end of the semester you will have the ability to parse, evaluate, and manipulate functions. These are critical aspects of graphical mathematical software like Mathematica®. As such, one option you could do is to make a Mathematica-like worksheet program. In the end this program will have the ability to plot functions and do basic symbolic manipulations of those functions. It should also have some programmability in a simple language. All of this will be inside of a GUI.
For now you should build a GUI, make a class for a Worksheet, and see if you can get it to plot some preprogrammed functions.
- Another option you could work on is an image processing program somewhat similar in nature to Photoshop®. The goal is to have the ability to build an image from multiple layers as well as a number of different filters for processing images and some tools for creating images. The result will not be as complex as Photoshop itself, but it will be significantly more complex and functional than Paint.
For now you can write something on the order of Paint. Give it the ability to load and save files as well as a number of different drawing tools for things like lines, rectangles, and similar primitives as well as color selections.
- For the more numerically inclined you might consider the option of simulation workbench. There were some projects early in the book that had you do basic Newtonian mechanics on gravitational systems using the simplest possible integrator we could write. For this option, we will explore other systems and other integration techniques including the ability for the user to specify a force law and see how such a system would behave. This will also look at some elements of discrete event simulations.
By the end of the semester, this project will evolve to the point where you can distribute work across multiple machines and view what a simulation is doing. You will also implement some spatial data structures to make integration of long-range forces more efficient. You might even be able to do things like simulate cloth using a particle mesh technique.
For now, make an application that does Newtonian gravity for a number of particles. Break this problem up into different classes and include a GUI so that you can watch the particles moving around. It should also have the ability to save to a file and load from a file.
- Your instructor might have other ideas as well. Check with him/her about the other possibilities they have in mind and what they would entail.
Additional exercises and projects, along with data files, are available on the book’s website.