Chapter 15
Liquid Crystal-Based Chemical Sensors
15.1 Introduction
This chapter presents an overview of recent advances in the use of liquid crystals (LCs) for sensing of small organic molecules from vapors (chemical sensing). The fundamental phenomenon underlying the approach to LC-based sensors addressed in this chapter is an adsorbate-driven anchoring transition in a film of LC, a phenomenon that has been known since the pioneering studies in the early 1990s by Pieranski and Jerome [1–4]. Recent studies have sought to realize chemical sensors based on LCs by using combinations of chemically tailored surfaces and LCs in order to engineer highly selective adsorbate-induced ordering transitions in the LCs. We also note that cholesteric LCs have been used for chemical sensing (with a change of pitch occurring upon absorption of an analyte), but approaches to chemical sensing based on cholesteric LCs lie beyond the scope of this chapter [5–14]. Finally, a number of studies with LCs as biological sensors have been reported over the past decade; however, we do not attempt to address those advances but rather refer the interested reader to relevant literature [15–24].
Figure 15.1 depicts two examples of adsorbate-driven ordering transitions that have been utilized as the basis of chemical sensors. In the first example, intermolecular interactions between the chemically functionalized surface and the LC lead to an initial azimuthal orientation of the LC on the surface (Figure 15.1A). Binding of the targeted analyte to the surface disrupts the intermolecular interactions of the surface with the LC, resulting in an azimuthal ordering transition of the LC to an orientation that is orthogonal to the initial orientation, as dictated by an anisotropic topography engineered into the chemically functionalized surface (Figure 15.1B). As discussed later in this chapter, this type of azimuthal, adsorbate-induced ordering transition in a LC can lead to the detection of organoamine compounds. As shown in Figure 15.2A, prior to binding of the organoamine, a LC with a nitrile group (e.g. 4′-pentyl-4-biphenyl-carbonitrile, 5CB) will assume a uniform azimuthal orientation on a surface presenting oriented, carboxylic acid groups due to hydrogen bonding between the nitrile groups of the LC and the carboxylic acids. Upon exposure of the system to organoamines, the stronger acid-based interaction of the amine and carboxylic acid will displace the nitrile group from its hydrogen bonded state on the surface: this loss of hydrogen bonding results in an azimuthal ordering transition of the LC. As noted above, the final azimuthal orientation of the LC is dictated by topography of the surface [25–28].
Figure 15.1 Schematic illustration of the competitive interaction between a LC and a low molecular weight targeted compound for a molecular receptor hosted on a surface with nanometer-scale topography. (A) Before exposure to a targeted compound, the molecules forming the LC mesogens bind with the molecular receptor and thereby anchor the LC in an azimuthal orientation that is orthogonal to the topography of the surface. (B) Binding of the targeted analyte to the surface-immobilized receptors displaces the LC from its interaction with the receptor shown in panel (A), and the LC orients along the topography. (C) A receptor-induced orientation of a LC that is perpendicular to a surface. (D) Binding of a targeted analyte to the surface-immobilized receptors displaces the LC from its interaction with the receptor shown in panel (A), and the LC tilts away from the surface normal. Reprinted with permission from Shah and Abbott [25]. Copyright 2001 AAAS.
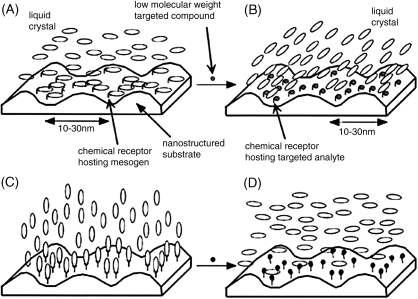
Figure 15.2 Schematic illustration of the intermolecular interactions that occur between chemically functionalized surfaces and either mesogens (top) or analytes (bottom) to create chemically responsive LC systems.
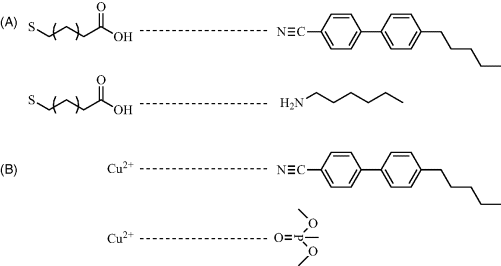
The second class of ordering transitions to be discussed in this chapter as the basis of chemical sensors are those that involve a change in the out-of-plane orientation of the LC (Figure 15.1C and D). In this case, the intermolecular interactions between the chemical functionality presented by the surface and the LC lead to an initial homeotropic orientation of the LC. Upon binding of the adsorbate to the surface, the loss of these intermolecular interactions results in a tilting of the LC away from the homeotropic orientation. As detailed in the next section, a number of studies have revealed that surfaces decorated with metal salts that coordinate with the nitrile groups of LCs, can be used to achieve the initial homeotropic orientation of the LC (Figure 15.2B). Upon exposure of the system to an analyte that coordinates to the metal ions with an affinity that is greater than the nitrile group (e.g., a molecule with a phosphoryl group), the nitrile–metal ion coordination interaction is lost, resulting in an ordering transition of the LC toward a planar orientation [25, 29–39].
The remainder of the chapter is as follows. In Section 2, we present design principles for chemically functionalized surfaces that can be used to create chemical sensors based on adsorbate-driven ordering transitions in LCs. In Section 3, we describe the analytic characteristics of LC sensors for detection of coordinating compounds. Section 4 addresses principles for LC sensors designed using acid–base interactions, and Section 5 presents some concluding perspectives.
15.2 Design of Chemically Functionalized Surfaces for use in LC-Based Chemical Sensors
15.2.1 Surfaces Decorated with Metal Salts
As described in Section 1, surfaces that are decorated with metal salts represent a promising class of surfaces for chemical sensing because choice of the metal cation of the salt can be used to tune the selectivity of the LC-based sensor. In this section, we describe enabling studies of the orientations of LCs on surfaces decorated with metal salts, and summarize evidence that coordination interactions between the nitrile group of LCs and the metal cation play a central role in determining the orientations of the LCs.
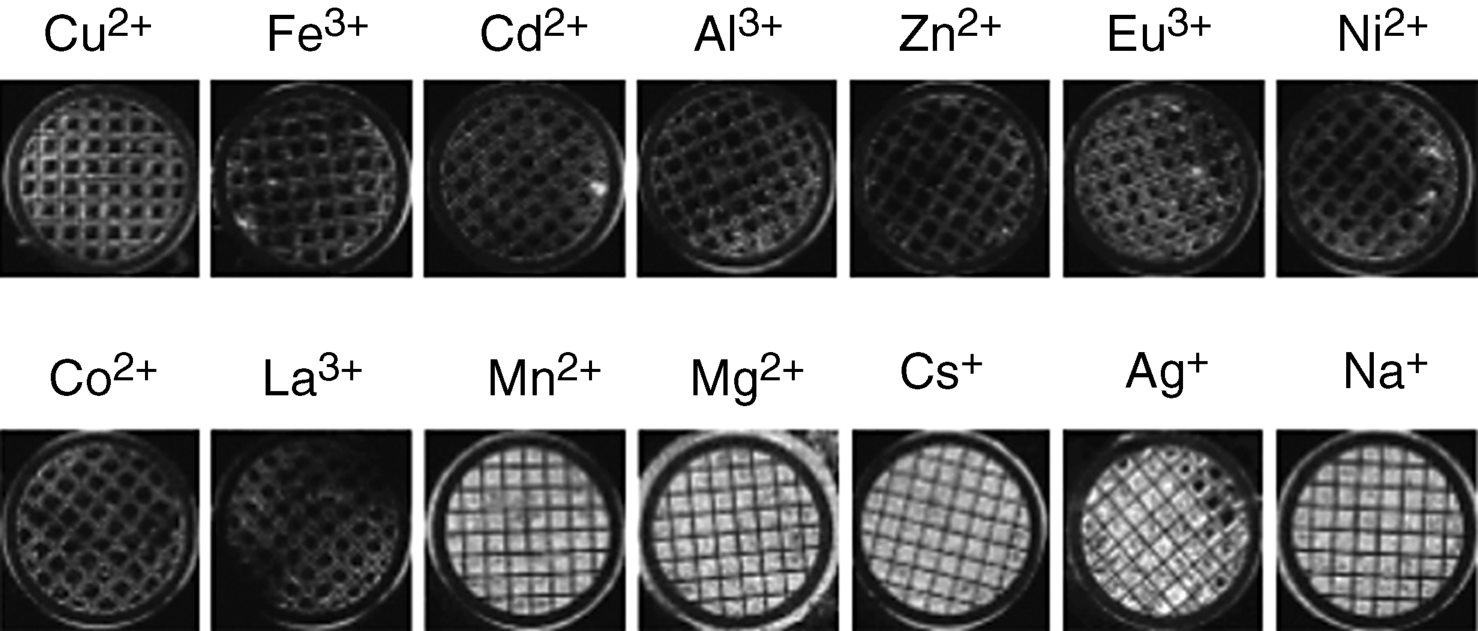
The effect of varying the type of metal perchlorate salt on the LC orientation of nematic 5CB is shown in Figure 15.3. The figure shows polarized light micrographs (crossed polars) of nematic 5CB, placed into the pores of 20-μm-thick metallic grids, supported on metal perchlorate salt-decorated surfaces. Because the easy axis of the nematic phase of 5CB at the air interface is homeotropic, images that appear dark between crossed polars indicate that the anchoring of the 5CB on the metal salt surface was homeotropic. Thus, it is apparent from Figure 15.3 that the perchlorate salts of Cu2+, Fe3+, Cd2+, Al3+, Zn2+, Eu3+, Ni2+, Co2+, and La3+ all cause homeotropic anchoring whereas Mn2+, Mg2+, Cs+, Ag+, and Na+ lead to bright micrographs between cross polars, indicating a tilted or planar orientations of the LC at the metal salt decorated surfaces [38].
Figure 15.3 Optical images (crossed polars) of gold grids impregnated with 5CB supported on metal perchlorate salts. Each grid is 3 mm in diameter. Reprinted with permission from Yang et al. [38]. Copyright 2004 American Chemical Society.
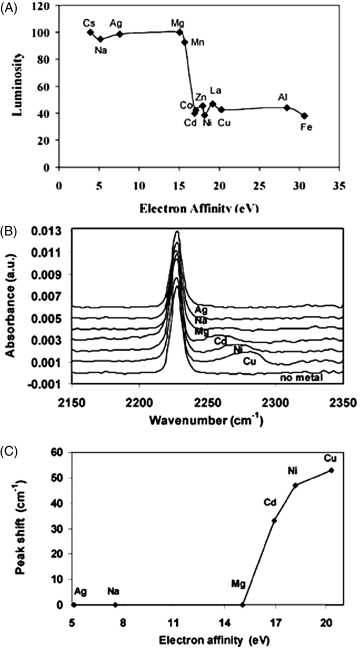
The results described in Figure 15.4A provide insight into the origins of the cation-dependent orientation of the LCs seen in Figure 15.3. These results reveal that the alignment of 5CB in contact with the metal perchlorate salts is dependent on the electron affinity of the metal cation, where metal cations with a high-electron affinity cause homeotropic orientations of the nematic phase of 5CB whereas metal cations with a low electron affinity cause planar or tilted orientations. Because the electron affinity of an ion is a measure of the ability of the ion to accept electrons from electron-donating ligands (e.g., nitrile groups), the correlation between the orientation of the LC and electron affinity of the metal ions suggests that the orientations of the LC result from the binding of the nitrile groups of the nematic phase of 5CB with the metal ions presented at these surfaces. This proposition is supported by infrared (IR) spectroscopy (Figure 15.4B). Whereas free nitrile groups give rise to a peak in the vibrational spectrum at ~2227 cm−1, a new peak is evident in the IR spectrum for surfaces presenting metal ions with high electron affinity. For example, for Cu2+ a peak is apparent at ~2287 cm−1, consistent with formation of a nitrile–Cu2+ complex [40–42]. We note that while the LC used in the IR studies shown in Figure 15.4B and C is 8CB, it possesses the same nitrile chemical functionality as 5CB [38].
Figure 15.4 Characterization of the ordering of LCs on metal ion-decorated surfaces, and IR spectroscopy of those surfaces. (A) Intensity of light (crossed polars) transmitted through 5CB supported on various metal perchlorate salts as a function of the electron affinities of the metal ions. (B) and (C) IR spectra of films of 8CB spin coated onto surfaces presenting metal ions. The peak at 2227 cm−1 corresponds to the stretching vibration of the nitrile groups of 8CB in bulk. Reprinted with permission from Yang et al. [38]. Copyright 2004 American Chemistry Society.
Overall, these results along with similar results reported in the literature [31, 38] provide strong support for the proposition that metal salts can be used to prepare a class of chemically functionalized surfaces at which LCs can be oriented through metal ion–LC coordination interactions involving the nitrile group of the LC. As discussed below, these coordination interactions can be disrupted by targeted chemical analytes, thus leading to a class of LC-based sensors for coordinating compounds.
15.2.2 Surfaces Decorated with Carboxylic Acids
The principles underlying the design of LC-based sensors, as shown in Figure 15.1A and B, can be applied to surfaces with a wide range of chemical functionality. As a second example, we briefly mention the use of surfaces that present carboxylic acid groups [25, 26, 28]. As described in Section 3 such surfaces are useful for detecting basic analytes, such as organoamines.
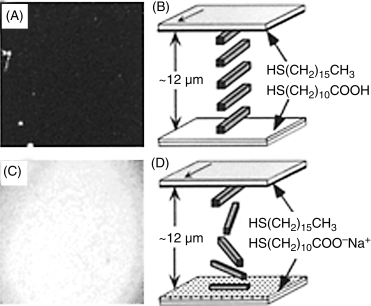
The utility of carboxylic acid-functionalized surfaces for chemical sensing is the capacity of these surfaces to participate in hydrogen bonding with chemical functional groups present on the LC [27, 28]. As evidence that hydrogen bonding between the nitrile group of 5CB and a carboxylic acid-functionalized surface can orient a nematic phase, Figure 15.5 shows that conversion of a carboxylic acid into a sodium carboxylate group on a surface can trigger an azimuthal ordering transition in nematic 5CB. The carboxylic acid can serve as a hydrogen bond donor to the nitrile group of the LC whereas the carboxylate group cannot participate in a hydrogen bond with a nitrile group, consistent with a role for hydrogen bonding in the observed ordering transition. We note here that the surfaces presenting the carboxylic acid/carboxylate species in Figure 15.5 also possess an anisotropic topography. Thus, in the absence of hydrogen bonding, the azimuthal orientation of the LC was dominated by the influence of the topography of the surface [27].
Figure 15.5 (A) and (C) Optical textures (crossed polars) formed by nematic 5CB within optical cells prepared with one surface supporting a self-assembled monolayer (SAM) formed from H3C(CH2)15SH and an opposing surface supporting a SAM formed from HOOC(CH2)10SH that was pretreated at pH 3.2 (A) or 10.6 (C). (B) and (D) Schematic illustrations of the orientations of the LCs interpreted from the optical textures shown in panels (A) and (C), respectively. The arrows indicate the direction of deposition of gold onto the substrate. Reprinted with permission from Shah and Abbott [27]. Copyright 1999 American Chemical Society.
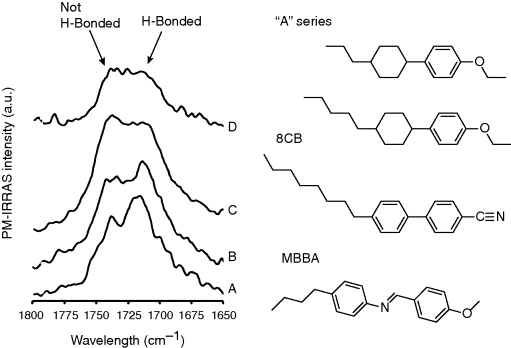
Additional spectroscopic evidence for hydrogen bonding is found in the IR spectra as shown in Figure 15.6. Figure 15.6A shows the IR spectra of the carboxylic acid-terminated surface prior to contact with one of three LCs. Inspection of Figure 15.6A reveals evidence of carbonyl groups within the monolayer in two environments (i.e., two peaks in the IR spectrum). These two peaks correspond to hydrogen bonded and non-hydrogen bonded carbonyl groups, with the hydrogen bonding occurring laterally within the monolayer. Contact of the “A” series LC (Figure 15.6B) with the carboxylic acid-terminated monolayer leads to very little change in the IR spectrum. This indicates that the “A” series LC does not form hydrogen bonds of sufficient strength to disrupt the intra-monolayer hydrogen bonding. In contrast, the IR spectra in (Figure 15.6C and D) indicate that both 5CB and MBBA do form hydrogen bonds with the carboxylic acid groups of the monolayer and thus disrupt the lateral network of hydrogen bonds between adjacent carboxylic acid groups on the surface [26]. Additional discussion regarding the interpretation of the IR spectra can be found in Ref. [26].
Figure 15.6 IR spectra of carboxylic acid-terminated SAMs before and after contact with LCs. SAMs formed from HS(CH2)11COOH on gold (A), coated with the LC “A” series (B), 8CB (C), and MBBA (D). Also shown are the molecular structures of the mesogen. Reprinted with permission from Luk et al. [26]. Copyright 2004 Elsevier.
15.3 LC-Based Sensors for Coordinating Compounds
The results presented in Section 2.1 clearly demonstrate that surfaces presenting metal cations can orient nitrile-containing LCs through metal ion–nitrile coordination interactions. As discussed below, this type of surface presents the opportunity to trigger ordering transitions in LC films through exposure of the system to analytes that coordinate with metal cations more strongly than the nitrile groups of the LC. Figure 15.7 shows a first example of a LC-based chemical sensor for an organophosphonate compound, dimethylmethylphosphonate (DMMP). DMMP is a common simulant for chemical nerve agents and pesticides, and possesses a phosphoryl group that coordinates strongly to a range of transition metal cations (see Figure 15.2B). As shown in Figure 15.7A–D, prior to exposure to a vapor of DMMP, the film of nematic 5CB assumes a homeotropic orientation on the surface decorated with copper perchlorate, consistent with coordination between the Cu2+ ions and the nitrile groups of the LC. Following exposure to a vapor of DMMP, however, the LC film was observed to undergo an orientational transition that was driven by a change in anchoring of the LC at the metal salt-decorated surface. This response is consistent with displacement of the nitrile group of 5CB from its coordination interaction with Cu2+, driven by competitive binding of DMMP (see below for spectroscopic evidence that supports this interpretation) [25].
Figure 15.7 Optical textures (crossed polars) formed by a film of nematic 5CB on a surface that was (A) pretreated with 100 mM Cu(ClO4)2 and (B) pretreated as in panel (A) and subsequently exposed to a vapor concentration of 900 ppmv (CH3O)2POCH3 (viewed at maximum transmission). The inset in panel (B) shows the optical texture at maximum extinction. (C) and (D) Schematic illustrations of the orientations of the LCs interpreted from the optical textures are shown in panels (A) and (B), respectively. The arrow in panel (C) indicates the direction of deposition of gold onto the substrate. (E) Reversibility of the optical brightness of a film of 5CB supported on a SAM formed from HOOC(CH2)10SH that was pretreated as shown in panel (A) and exposed sequentially to 10 ppmv (CH3O)2POCH3 and N2. (F) Response times of films of 5CB (thickness 4 μm) supported on surfaces presenting Cu2+ that were exposed to (CH3O)2POCH3 convected to the surface from a nozzle that was placed 2 mm (closed circle) or 3 mm (closed square) above the film of 5CB. The response time is defined as the time at which the onset of reorientation of the LC was visible to the naked eye. Reprinted with permission from Shah and Abbott [25]. Copyright 2001 AAAS.
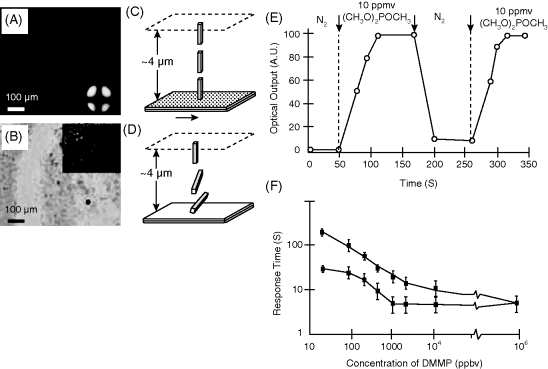
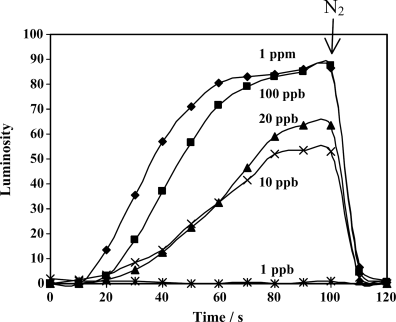
Several key characteristics of the DMMP-induced ordering transitions are described in Figures 15.7E and F. Firstly, Figure 15.7E demonstrates that the DMMP-induced ordering transitions are reversible [25, 31, 33, 36, 39]. Secondly, Figure 15.7F reveals that the LC responds to concentrations of DMMP that are in the 10s of parts-per-billion range [25]. These ordering transitions are not limited to nematic 5CB, but smectic thin films of 8CB heated to a temperature very close to the nematic–smectic phase transition, when supported on Cu2+-decorated surfaces, also undergo ordering transitions upon exposure to DMMP (Figure 15.8) [39]. In addition, the dynamics of the response of the film of smectic LC is dependent on the concentration of DMMP in the vapor phase that passes above the film of LC. Here we also note that the quantitative response of the LC sensor is strongly dependent on the geometry of the system, and that variations in the thickness of the LC film likely contribute to the scatter in the experimental data as shown in Figure 15.8 [39].
Figure 15.8 Time-dependent change in the intensity of light transmitted through a thin film of 8CB (thickness 900 nm) supported on Cu2+-decorated surfaces following exposure to various concentrations of DMMP. Reprinted with permission from Yang et al. [39]. Copyright 2005 Elsevier.
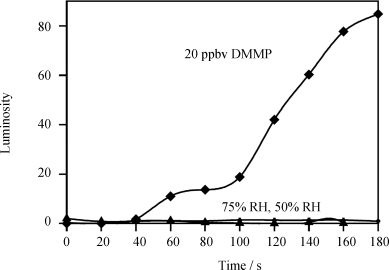
A key attribute of a chemical sensor is selectivity-detection of the targeted compound but not other compounds found in the sampling environment. Figure 15.9 shows an example of the selective response of LC-based chemical sensors to DMMP as compared to water. Water is commonly problematic in chemical sensing because it is present in many sampling environments in high yet variable concentrations. Because water does not coordinate with Cu2+ with sufficient strength to displace the nitrile group of 8CB from its coordination with Cu2+, the results in Figure 15.9 show that a LC sensor based on 8CB and Cu2+-decorated surfaces does not respond to water present in air at concentrations that correspond to relative humidities of 50% or 75% [39].
Figure 15.9 Effect of relative humidity (RH) on the visual appearance of a film of 8CB supported on Cu2+-decorated surfaces. No change in luminosity was observed when the sample was exposed to pure N2 with RH of 50% and 75%, respectively, whereas a 20 ppbv DMMP vaporous stream leads to an observable color change in the 8CB film in 60 s. Reprinted with permission from Yang et al. [39]. Copyright 2005 Elsevier.
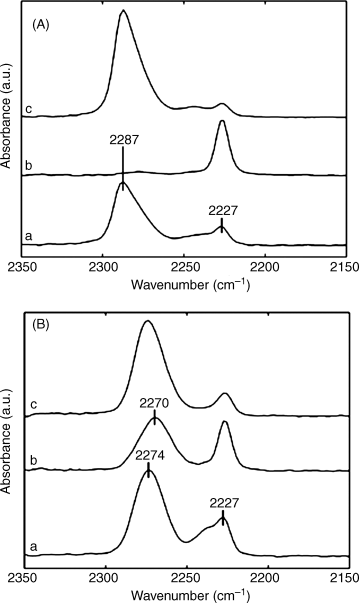
The proposition that the ordering transitions shown in Figures 15.7–15.9 result from ligand exchange reactions at the metal ion-decorated surfaces is supported by IR spectroscopy [38]. Prior to exposure to DMMP, two nitrile absorption peaks are evident in the IR spectrum (Figure 15.10A, bottom curve). As discussed above, the peak at 2227 cm−1 corresponds to free nitrile groups and the peak at 2287 cm−1 corresponds to nitrile groups coordinated with Cu2+. Following exposure to DMMP (Figure 15.10A, middle curve), the peak at 2287 cm−1, present prior to exposure, disappears. The loss of this peak is consistent with displacement of the nitrile group of the 8CB from its coordination with the Cu2+ due to competitive binding of DMMP with the Cu2+ ion. Finally, following a nitrogen purge of the system the nitrile peak corresponding to the coordinated state of the nitrile group reappears in the IR spectrum (Figure 15.10A, top curve). The reappearance of this peak is consistent with the reversible response of the LC film to DMMP, as shown in Figures 15.7 and 15.8. The connection proposed between the ordering transitions of nitrile containing LCs and IR spectroscopy is further strengthened by the IR spectra shown in Figure 15.10B, obtained using surfaces presenting Ni2+ ions. Whereas Ni2+-decorated surfaces cause homeotropic orientations of nitrile-containing LCs (see Figure 15.3), such films of LCs do not undergo ordering transitions upon exposure to DMMP. These observations are consistent with the IR spectra in Figure 15.10B, where exposure of a film of 8CB to DMMP does not result in elimination of the peak corresponding to the coordinated state of the nitrile group. That is, the Ni2+–nitrile coordination complex is not disrupted by DMMP to the extent that is observed with Cu2+-decorated surfaces. Overall, these results and others reported in the literature [31, 32, 38, 40–42] support our conclusion that ligand exchange reactions underlie the sensitive and selective ordering transitions of LCs that can be observed on surfaces decorated with metal ions.
Figure 15.10 Infrared spectroscopy characterizing the response of 8CB supported on surfaces decorated with Cu2+ or Ni2+ ions to DMMP. (A) IR spectra of a thin film of 8CB on a surface presenting Cu2+ perchlorate salts (a) before and (b) during exposure to 10 ppm DMMP, and (c) after a 30-min air purge. (B) IR spectra of a thin film of 8CB on a surface supporting Ni2+ perchlorate salts (a) before and (b) during exposure to 10 ppm DMMP, and (c) after a 30-min air purge. Reprinted with permission from Cadwell et al. [31]. Copyright 2006 American Chemical Society.
15.4 LC Sensors Designed to Report Acid–Base Interactions
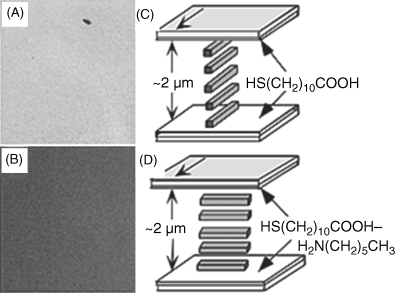
To illustrate the generality of LC-based sensors that use chemically functionalized surfaces, we next describe a class of sensors that report acid–base interactions [25, 26, 28]. Such sensors can report important classes of compounds such as organoamines compounds that can be used, for example, to indicate the freshness of foods [25, 28]. As discussed in the context of Figures 15.5 and 15.6, past studies have provided evidence that hydrogen bonding between carboxylic acid-functionalized surfaces and nitrile-containing LCs can lead to preferred azimuthal orientations of supported LC films [26, 27]. The binding of an alkylamine to these surfaces, which results from an acid–base reaction between the amine and carboxylic acid, leads to the disruption of the initial hydrogen bonded state of the LC and thus an azimuthal ordering transition (Figure 15.11). As noted above, in the absence of the hydrogen bonding interactions, the topographical features of the surface define the azimuthal orientation of the LC [28].
Figure 15.11 (A) and (B) Interference color of a film of nematic 5CB supported on a SAM formed from HOOC(CH2)10SH before (A) and after (B) exposure to n-H2N(CH2)5CH3. (C) Schematic illustration of the orientation of the LC in contact with a carboxylic acid monolayer that is consistent with interference colors shown in panel (A). The bold arrow indicates the direction of deposition of gold onto the substrate. (D) Schematic illustration of the orientation of the LC in contact with the hexylamine-reacted carboxylic acid monolayer that is consistent with the interference colors shown in panel (B). Reprinted with permission from Shah and Abbott [28]). Copyright 2003 American Chemical Society. (See the color version of this figure in Color Plates section.)
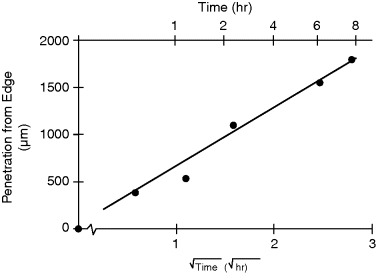
Exposure of a film of LC confined between two surfaces presenting carboxylic acids groups, when exposed to a vapor of hexylamine, can cause an ordering transition that propagates laterally across the film of LC (Figure 15.12A). If the surface is patterned with stripes of carboxylic acids groups that are separated by methyl-terminated areas, the ordering transition triggered by the hexylamine can lead to patterned orientations of the LC and a diffraction grating (Figure 15.12B and C) [28]. Figure 15.13 illustrates the progression of the ordering transition across the LC sample is consistent with diffusion of the hexylamine laterally across the film. The LC film, thus, provides a diffusion cell in which transport of the gas across the cell is readily visualized via an ordering transition that is induced in the LC [28].
Figure 15.12 Optical images formed by 5CB within optical cells (12 μm) fabricated with surfaces presenting carboxylic acid. The cells were exposed to 750 ppmv n-H2N(CH2)5CH3 at the edge shown at the bottom of the image. Panel (A) shows the optical textures of 5CB during diffusion of n-H2N(CH2)5CH3 across the cell. In region I, the presentation of carboxylic acid causes a 90° twist distortion in the LC. In region II, n-H2N(CH2)5CH3 bound to the carboxylic acid groups results in a uniform orientation of the LC. The arrow indicates the limit of the diffusion front of n-H2N(CH2)5CH3. (B) and (C) Optical textures (cross polars) formed by nematic 5CB within optical cells (12 μm) prepared with one surface supporting a SAM formed from H3C(CH2)14SH and an opposing surface supporting a SAM patterned using HOOC(CH2)10SH and H3C(CH2)11SH pretreated at pH 3.2 (B) prior to exposure to n-H2N(CH2)5CH3 and (C) after exposure for 8 min to 750 ppmv of n-H2N(CH2)5CH3. The inset in panel (C) is a magnified region showing the formation of the patterned region upon exposure to the analyte. Reprinted with permission from Shah and Abbott [28]. Copyright 2003 American Chemical Society.
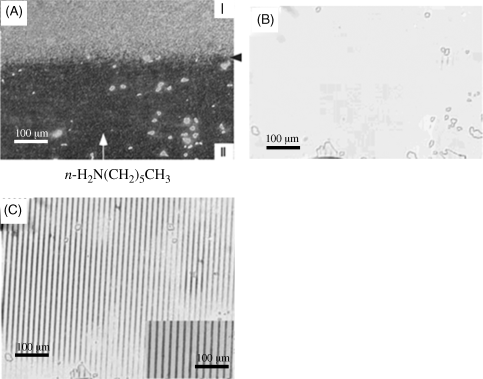
Figure 15.13 Penetration distance (from the edge of a LC cell) of n-H2N(CH2)5CH3 as a function of exposure time and as a function of the square root of exposure time. Reprinted with permission from Shah and Abbott [28]. Copyright 2003 American Chemical Society.
15.5 Concluding Comments
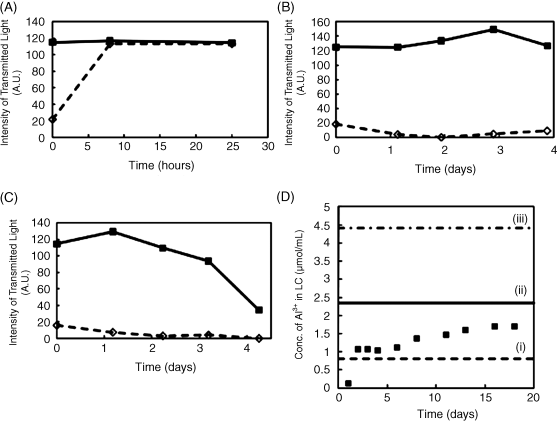
We end this chapter by making several additional observations regarding the promise and opportunity defined by LC-based sensors. Firstly, whereas many of the results presented above were obtained using a model organophosphonate compound, we have also demonstrated that the principles described above can be extended to live nerve agents, which are also organophosphonates [25, 31, 38]. As shown in Figure 15.14, using surfaces presenting Al3+, Zn2+, and Fe3+, it is possible to use LCs to detect the nerve agents GB, GD, GA, and VX [32]. Secondly, we comment that there exists a substantially unexplored opportunity to design LCs that are tailored for chemical sensing. The experiments described above were largely based on commercially available LCs that were designed largely with a view to application in LC displays, and there is little reason to believe that they represent optimal designs for LC-based chemical sensors. As a first example of an attempt to tailor the design of a mesogen for chemical sensing, we show in Figure 15.15 results obtained using a mesogen that was synthesized to contain two nitrile groups [34]. The incorporation of two coordinating nitrile groups into a mesogen resulted in observations of homeotropic orientations of the LC on surfaces presenting low densities of Cu2+ ions (densities that did not cause homeotropic orientation of 5CB) (Figure 15.15). However, the strong coordination of the mesogens to the Cu2+-decorated surface also inhibited ordering transitions triggered by DMMP, that is, DMMP was not able to readily displace the dinitrile-based mesogens from coordination with the Cu2+ (Figure 15.16). This example serves to illustrate how the attributes of LC-based sensors can be potentially improved through the tailoring of the design of mesogens [34]. Finally, we comment that the realization of practical LC-based sensors requires that the systems be stable over long periods of time. We have recently reported on the time-dependent behaviors of LC sensors at surfaces decorated with metal salts (Figure 15.17) [33]. Those studies revealed that the stability of the sensor is strongly dependent on the amount of metal salt present on the surface. We have also found evidence that partial dissolution of the metal salt into the LC leads to formation of an electrical double layer that can influence the response of the LC-based sensor [33]. Such phenomena at these complex LC interfaces are not yet fully understood and define a fertile territory for future investigations.
Figure 15.14 Optical images (crossed polars) of the nitrile containg LC E7 supported on perchlorate salts of (a) aluminum(III), (b) zinc(II), and (c) iron(III) before (top row) and after (bottom row) exposure to organophosphorous nerve agents. The duration of agent exposure is indicated. Imaged areas are approximately 7.5 mm by 7.5 mm. Reprinted with permission from Cadwell et al. [32]. Copyright 2007 Elsevier.
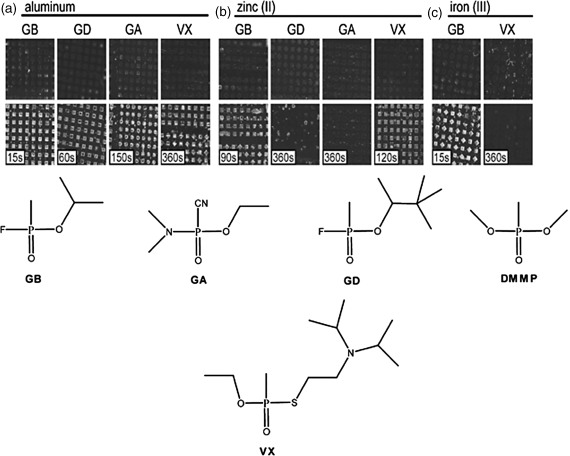
Figure 15.15 (A) Optical micrographs (crossed polars) of a thin film of nematic LC mixture containing 2 wt.% DCB (D, lower structure) in 5CB (D, upper structure) confined between SAMs formed from HOOC(CH2)10SH that were pretreated sequentially with aqueous solution of 0.01 (N) NaOH and 50mMCu(ClO4)2, followed by a thorough rinse with ethanol. The inset in panel (A) is a conoscopic image indicating homeotropic alignment. (B) and (C) Optical micrographs (crossed polars) of LCs containing 2 wt.% DCB in 5CB confined within optical cells with surfaces prepared from either (B) SAMs formed from HOOC(CH2)10SH or (C) SAMs formed from HOOC(CH2)10SH and pretreated with 0.01 (N) NaOH. Reprinted with permission from Pal et al. [34]. Copyright 2010 American Chemical Society.
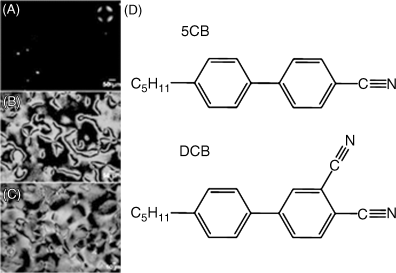
Figure 15.16 Optical images (crossed polars) of a mixture of 5CB containing 2.0 wt.% DCB (see Figure 15.15) showing the time-dependent response of the LCs hosted in micropillar arrays to a vapor of DMMP (Scale bar = 50 μm). Reprinted with permission from Pal et al. [34]. Copyright 2010 American Chemical Society.
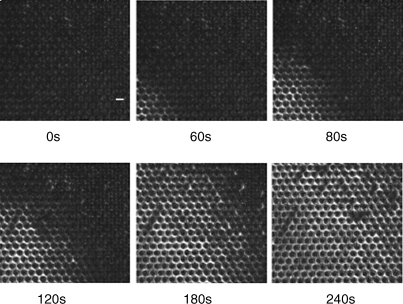
Figure 15.17 (A) Quantification of the optical response of a film of nematic 5CB supported on a surface decorated with 0.39 ng/mm2 Al perchlorate. The solid data points indicate the response of the LC to exposure to 5 ppm DMMP; the open data points show the optical response of the LC prior to exposure to DMMP. (B) Quantification of the optical response of a film of nematic 5CB supported on a surface decorated with 1.13 ng/mm2 Al perchlorate. The solid data points indicate the response of the LC to exposure to 5 ppm DMMP; the open data points show the optical response of the LC prior to exposure to DMMP. (C) Quantification of the optical response of a film of nematic 5CB supported on a surface decorated with 2.14 ng/mm2 Al perchlorate. The solid data points indicate the response of the LC to exposure to 5 ppm DMMP; the open data points show the optical response of the LC prior to exposure to DMMP. (D) Concentration of Al3+ dissolved in 5CB as a function of time of contact of the LC with excess Al perchlorate salt. The horizontal lines indicate the concentration of Al3+ that would be present in a 20 μm thick film of LC if all metal salt on the surface dissolved into the LC; (i) 0.39 ng/mm2 Al perchlorate, (ii) 1.13 ng/mm2 Al perchlorate, and (iii) 2.14 ng/mm2 Al perchlorate. Reprinted with permission from Hunter et al. [33]. Copyright 2010 American Chemical Society.
Acknowledgments
This study was funded by the Army Research Office through Grants W911NF-07-1-0446 and W911NF-10-1-0181 as well as by the National Science Foundation through grants DMR-0520527 and DMR-0602570.
1. P. Pieranski, B. Jerome, and M. Gabay. Adsorption-induced anchoring transitions. Mol. Cryst. Liq. Cryst. Incorporating Nonlinear Optics 1990, 179, 285–315.
2. B. Jerome and Y. R. Shen. Anchoring of nematic liquid crystals on mica in the presence of volatile molecules. Phys. Rev. E 1993, 48, 4556.
3. J. Bechhoefer, J. L. Duvail, L. Masson, B. Jérme, R.M. Hornreich, and P. Pieranski. Critical behavior in anchoring transitions of nematic liquid crystals. Phys. Rev. Lett. 1990, 64, 1911.
4. J. Bechhoefer, R. M. Hornreich, B. Jérme, and P. Pieranski. Systematic studies of the anchoring transition in nematic liquid crystals. Phys. Rev. A, 1990, 41, 3187.
5. T. J. Novak, E. J. Poziomek, and R. A. Mackay. Use of anisotropic materials as chemical detectors. Anal. Lett. 1972, 5, 187–192.
6. E. J. Poziomek, T. J. Novak, and R. A. Mackay. Transparency characteristics of several cholesteryl esters. Mol. Cryst. Liq. Cryst. 1972, 15, 283–295.
7. F. L. Dickert, A. Haunschild, P. Hofmann, and G. Mages. Molecular recognition of organic solvents and ammonia: shapes and donor properties as sensor effects. Sensors and Actuators B: Chemical 1992, 6, 25–28.
8. F. L. Dickert, A. Haunschild, and P. Hofmann, Cholesteric liquid crystals for solvent vapour detection — Elimination of cross sensitivity by band shape analysis and pattern recognition. Fresenius' J. Anal. Chem. 1994, 350, 577–581.
9. A. D. Rey. Theory and simulation of gas diffusion in cholesteric liquid crystal films. Mol. Cryst. Liq. Cryst. 1997, 293, 87–109.
10. D. A. Winterbottom, R. Narayanaswamy, and I. M. Raimundo. Cholesteric liquid crystals for detection of organic vapours. Sensors and Actuators B: Chemical 2003, 90, 52–57.
11. N. Kirchner, L. Zedler, T. G. Mayerhofer, and G. J. Mohr. Functional liquid crystal films selectively recognize amine vapours and simultaneously change their colour. Chem. Commun. 2006, 1512–1514.
12. L. Sutarlie, H. Qin, and K.-L. Yang, Polymer stabilized cholesteric liquid crystal arrays for detecting vaporous amines. Analyst 2010, 135, 1691–1696.
13. L. Sutarlie, J. Y. Lim, and K.-L. Yang, Cholesteric liquid crystals doped with dodecylamine for detecting aldehyde vapors. Anal. Chem. 2011, 83, 5253–5258.
14. E. J. Poziomek, T. J. Novak, and R. A. Mackay. Use of liquid crystals as vapor detectors. Mol. Cryst. Liq. Cryst. 1974, 27, 175–185.
15. Y. Bai and N. L. Abbott. Recent advances in colloidal and interfacial phenomena involving liquid crystals. Langmuir 2011, 27, 5719–5738.
16. X. Bi, S. L. Lai, and K.-L. Yang. Liquid crystal multiplexed protease assays reporting enzymatic activities as optical bar charts. Anal. Chem. 2009, 81, 5503–5509.
17. J. M. Brake, M. K. Daschner, Y.-Y. Luk, and N. L. Abbott. Biomolecular interactions at phospholipid-decorated surfaces of liquid crystals. Science 2003, 302, 2094–2097.
18. T. Govindaraju, P. J. Bertics, R. T. Raines, and N. L. Abbott. Using measurements of anchoring energies of liquid crystals on surfaces to quantify proteins captured by immobilized ligands. J. Am. Chem. Soc. 2007, 129, 11223–11231.
19. V. K. Gupta, J. J. Skaife, T. B. Dubrovsky, and N. L. Abbott. Optical amplification of ligand–receptor binding using liquid crystals. Science 1998, 279, 2077–2080.
20. C.-H. Jang, L.-L. Cheng, C. W. Olsen, and N. L. Abbott. Anchoring of nematic liquid crystals on viruses with different envelope structures. Nano Lett. 2006, 6, 1053–1058.
21. C.-H. Jang, M. L. Tingey, N. L. Korpi, G. J. Wiepz, J. H. Schiller, P. J. Bertics, and N. L. Abbott. Using liquid crystals to report membrane proteins captured by affinity microcontact printing from cell lysates and membrane extracts. J. Am. Chem. Soc. 2005, 127, 8912–8913.
22. A. D. Price and D. K. Schwartz. DNA hybridization-induced reorientation of liquid crystal anchoring at the nematic liquid crystal/aqueous interface. J. Am. Chem. Soc. 2008, 130, 8188–8194.
23. S. V. Shiyanovskii, T. Schneider, I. I. Smalyukh, T. Ishikawa, G. D. Niehaus, K. J. Doane, C. J. Woolverton, and O. D. Lavrentovich. Real-time microbe detection based on director distortions around growing immune complexes in lyotropic chromonic liquid crystals. Phys. Rev. E 2005, 71, 020702.
24. L. S. Birchall, R. V. Ulijn, and S. J. Webb. A combined SPS-LCD sensor for screening protease specificity. Chem. Commun. 2008, 2861–2863.
25. R. R. Shah and N.L. Abbott. Principles for measurement of chemical exposure based on recognition-driven anchoring transitions in liquid crystals. Science 2001, 293, 1296–1299.
26. Y. Y. Luk, K. L. Yang, K. Cadwell and N. L. Abbott. Deciphering the interactions between liquid crystals and chemically functionalized surfaces: Role of hydrogen bonding on orientations of liquid crystals. Surf. Sci. 2004, 570, 43–56.
27. R. R. Shah and N. L. Abbott. Using liquid crystals to image reactants and products of acid-base reactions on surfaces with micrometer resolution. J. Am. Chem. Soc. 1999, 121, 11300–11310.
28. R. R. Shah and N.L. Abbott. Orientational transitions of liquid crystals driven by binding of organoamines to carboxylic acids presented at surfaces with nanometer-scale topography. Langmuir 2003, 19, 275–284.
29. X. Bi and K.-L. Yang. Real-time liquid crystal-based glutaraldehyde sensor. Sens. Actuators B: Chem. 2008, 134, 432–437.
30. M. L. Bungabong, P. B. Ong, and K.-L. Yang. Using copper perchlorate doped liquid crystals for the detection of organophosphonate vapor. Sens. Actuators B: Chem. 2010, 148, 420–426.
31. K. D. Cadwell, M. E. Alf, and N. L. Abbott. Infrared spectroscopy of competitive interactions between liquid crystals, metal salts, and dimethyl methylphosphonate at surfaces. J. Phys. Chem. B 2006, 110, 26081–26088.
32. K. D. Cadwell, N. A. Lockwood, B. A. Nellis, M. E. Alf, C. R. Willis, and N. L. Abbott. Detection of organophosphorous nerve agents using liquid crystals supported on chemically functionalized surfaces. Sens. Actuators B: Chem. 2007, 128, 91–98.
33. J. T. Hunter, S. K. Pal, and N. L. Abbott. Adsorbate-induced ordering transitions of nematic liquid crystals on surfaces decorated with aluminum perchlorate salts. ACS Appl. Mater. Interf. 2010, 2, 1857–1865.
34. S. K. Pal, C. Acevedo-Vélez, J. T. Hunter, and N. L. Abbott. Effects of divalent ligand interactions on surface-induced ordering of liquid crystals. Chem. Mater. 2010, 22, 5474–5482.
35. A. Sen and B. R. Acharya. Alignment of nematic liquid crystals at inorganic salt-liquid crystal interfaces. Liq. Cryst. 2011, 38, 495–506.
36. S. S. Sridharamurthy, K. D. Cadwell, N. L. Abbott, and H. Jiang. A microstructure for the detection of vapor-phase analytes based on orientational transitions of liquid crystals. Smart Materials & Structures 2008, 17, 4.
37. H. J. VanTreeck, D. R. Most, B. A. Grinwald, K. A. Kupcho, A. Sen, M. D. Bonds, and B. R. Acharya. Quantitative detection of a simulant of organophosphonate chemical warfare agents using liquid crystals. Sens. Actuators B: Chem. 2011, 158, 104–110.
38. K. L. Yang, K. Cadwell, and N. L. Abbott. Mechanistic study of the anchoring behavior of liquid crystals supported on metal salts and their orientational responses to dimethyl methylphosphonate. J. Phys. Chem. B 2004, 108, 20180–20186.
39. K. L. Yang, K. Cadwell, and N. L. Abbott. Use of self-assembled monolayers, metal ions and smectic liquid crystals to detect organophosphonates. Sens. Actuators B: Chem. 2005, 104, 50–56.
40. E. Escalona Platero, M. Peñarroya Mentruit, and C. Morterra. Fourier transform infrared spectroscopy study of CD3CN adsorbed on pure and doped γ-alumina. Langmuir 1999, 15, 5079–5087.
41. Y. Marcus. Preferential solvation of silver(I), copper(I) and copper(II) ions in aqueous acetonitrile. J. Chem. Soc., Dalton Trans. 1991, 2265–2268.
42. A. G. Pelmenschikov, R. A. van Santen, J. Janchen, and E. Meijer. Acetonitrile-d3 as a probe of Lewis and Broensted acidity of zeolites. J. Phys. Chem. 1993, 97, 11071–11074.
