
Chapter 5. A Domed House
“The most typical Three Peak-Domed House formations start at a bear market low. When this has been true, the highest point in the pattern has never equaled the top of the previous major bull market. Not all of the minor bull markets of the past have taken the shape of the Three Peaks and Domed House, but most of them have.”1 —George Lindsay
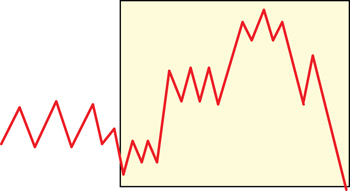
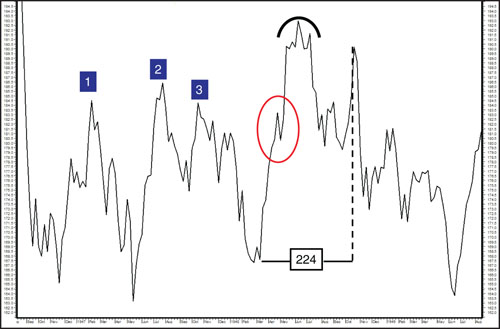
After the Separating Decline, the Domed House formation begins (see Figure 5.1). Like the Three Peaks pattern, the Domed House pattern is “distinguished by advances and declines which travel many points in a straight line. But the movements never last very long. In between the few explosive moves, the market spends much of the time backing and filling in a comparatively narrow range.” By keeping this simple requirement of both patterns in mind at all times, the analyst will avoid the mistake of seeing 3PDh formations everywhere and the losses associated with false attribution of the pattern. This chapter breaks down the Domed House formation into its component parts, identifies and discusses the characteristics of each component part, and lays out the counts and counting methods necessary to identify and confirm the formation.
Bases
The Domed House begins with some kind of base. It is important to distinguish whether the base is irregular or symmetrical. To be a satisfactory base, whether irregular or symmetrical, there should be a rebound from the low of the Separating Decline and then two secondary dips after the rebound from the low. Lindsay makes it clear that one dip doesn’t suffice; there must be two dips. Determining the number of dips, however, is somewhat arbitrary, as one can see in the examples that follow.
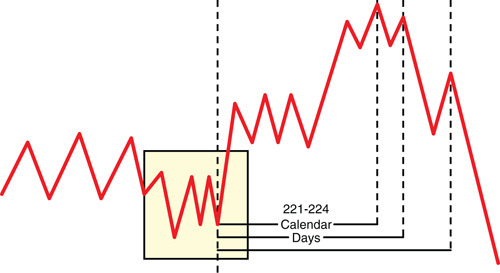
Determining the nature of the base (irregular or symmetrical) was critical to Lindsay because the labeling of the base will determine the origin date of the count. Also critical to Lindsay was the determination of whether the base was longer or shorter than “normal.” Unfortunately, Lindsay never revealed what time period he considered to be normal. It does appear, from the examples he gave, that a base lasting one month is shorter than “normal” and a base lasting approximately two months is to be considered “normal.” The count (221–224 calendar days) is used to estimate the final day of the bull market—usually to within three days. Counting 221–224 days forward from the determined point of origin will direct one to either the exact date of a bull market top or an easily recognized and defined point near the bull market top. The uncanny ability of the model to pinpoint the end of a bull market to within such a small time frame is what makes the 3PDh model so amazing and Lindsay’s genius so obvious.
Lindsay never actually defines a Symmetrical Base, opting instead to identify bases in his charts as symmetric or irregular. The base in the idealized chart example (see Figure 5.2) is an example of a Symmetrical Base. When a Symmetrical Base is present, we begin our count from the bottom of the second dip following the Separating Decline, as shown in Figure 5.2.
If the secondary sell-off (the final sell-off in the base) is too shallow (an ascending base) to call the base symmetrical, we cannot count from it. The span must be counted from the low of the base, that is, the bottom of Separating Decline. Even if an ascending base is symmetrical, the count must originate before the secondary sell-off.
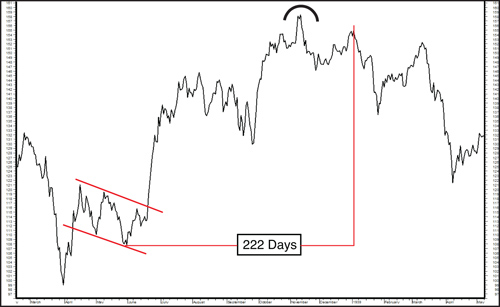
Figure 5.3, which shows the Domed House in 1938, contains an example of a Symmetrical Base as identified by Lindsay. Note how the base is descending but contained within two parallel lines, giving it a symmetric presence.
Figure 5.3. Symmetrical Base. Chart created by MetaStock®.
Counts
The typical duration from the end of a base (bottom of the First Floor Wall) to the peak of a Domed House is 221–224 calendar days (seven months plus eight to ten calendar days, or 32 weeks). Note that counts are made using calendar days, not trading days. While exceptions can be found to all of Lindsay’s “rules,” it is his rules concerning the counts that seem to have the most exceptions and to be the most arbitrary. For every rule Lindsay listed, an exception can be found such that one has to wonder how Lindsay decided which example was to become his “rule”! The rules that follow should be thought of more as rules of thumb, heuristics, at best. Lindsay even lists several examples that called market tops in the 20th century, none of which met his requirements for counts. They are included in Chapter 3, “The Phenomenon,” in Table 3.1. “Movements of very irregular duration have occurred in the course of Three Peak-Domed House patterns. We then go by the shape of the chart, and not by the number of days.” Part III of this book describes the Lindsay Timing Model, which Lindsay holds out as a way to make sense of all the seeming contradictions that follow. Bypassing the following heuristics would be a mistake for the reader, however, as one must not only be acquainted with them, but be actively looking for each of these possibilities in order to ascertain which count is correctly confirmed by the Lindsay Timing Model. As Lindsay wrote, “The market is never exactly the same twice. To have a chance of applying any theory satisfactorily, a student must be familiar with all past examples of each formation, so that the variations in each recurrence will not confuse him.”
Domed House Longer Than Normal
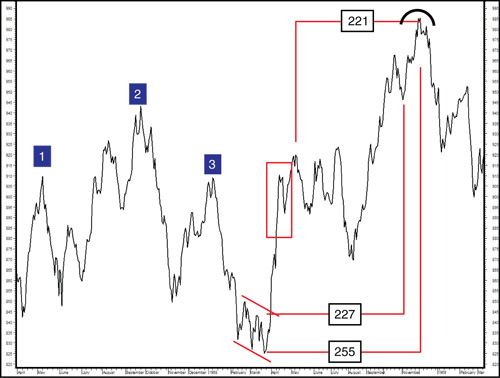
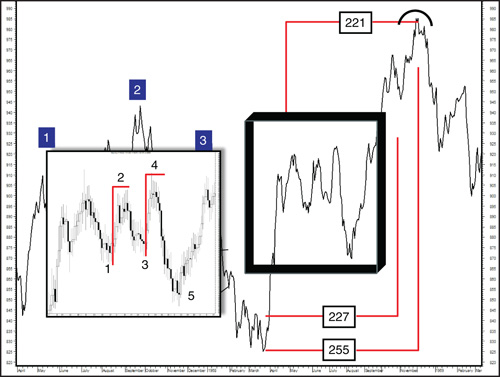
Lindsay gave only one example of a longer-than-normal Domed House (see Figure 5.4). This was a formation in which the Cupola formed in December 1968. From the bottom of the base to the top of the Cupola, 255 days passed. He gives two explanations for its extended period.
Figure 5.4. Long Domed House. Chart created by MetaStock®.
1 A Descending Base Instead of a Normal Ascending Base
Lindsay’s first explanation for a Domed House that was longer than the normal 221–224 calendar days was that the base was of the descending variety. The reader will notice that the base in Figure 5.3 was also a descending base but the Domed House was shorter than normal, and certainly shorter than the Domed House in Figure 5.4. Lindsay doesn’t address that apparent contradiction, but we will note that the formation in Figure 5.3 was a reversed pattern, a Domed House followed by Three Peaks.
2 The Base Was Shorter Than Normal
Lindsay wrote that the base being shorter than normal explained the longer-than-normal Domed House based on the “principle of equalization.” The base measured 37 days. “Under the principle of equalization, this meant that the next move would probably be longer than normal.”
It is worth highlighting that a count of 227 days from the bottom of the First Floor Wall precisely targets the absolute bottom of the left shoulder of the Cupola. It is also of interest that a count of 221 days forward, from the top of the First Floor Roof (the beginning of the five-wave reversal), targets a date (December 10th) in the heart of the topping formation (looking for the “center of gravity” in a top formation is a favorite technique of Lindsay’s, and this approach is dealt with, in depth, in Part III, “The Lindsay Timing Model”). The preceding counts are examples of an easily recognized and defined point near the bull market top.
Domed House Shorter Than Normal
Lindsay also addressed the situation of a Domed House being shorter than normal. He listed two irregularities that the reader should be aware of.
1 Missing First Floor Roof
If a Domed House is shorter than normal, the count will usually end at the peak of either of the two right shoulders following the absolute top. In 1947, the base was symmetrical (see Figure 5.5) yet the count extended to the right shoulder in 1948. Lindsay notes that an analyst should have suspected a shorter-than-normal Domed House, prior to its completion, because where a five-wave reversal was expected, price simply slid off for seven days. Lindsay, however, failed to explain how an analyst could know where or when a five-wave reversal should be expected! The time required to build the First Floor Wall varies considerably between formations. In hindsight, the absence of a First Floor Roof (five-wave reversal) told us that the Domed House would be shorter than normal. “The failure of the 5 reversals to appear implied that this would be an unusually short-lived domed house.”
Figure 5.5. Short Domed House. Chart created by MetaStock®.
2 Patterns at Secular Bull Market Tops
This chapter’s opening quote from Lindsay, “The most typical Three Peak-Domed House formations start at a bear market low,” does not mean to imply that most 3PDh formations start at bear market lows. Rather, the intent was to bring attention to the fact that 3PDh patterns that begin at bear market lows normally adhere to Lindsay’s rules more faithfully. Contrast those patterns with the patterns that appear at the end of secular bull markets. “The patterns which start in the latter part of a major bull market do not normally last as long as those that begin at a bear market low, and they are often less symmetrical.”
Since a Domed House at the top of a bull market seldom lasts as long as the formation that begins at a bear market low, we count the span to the peak of the Dome from the bottom of the Separating Decline or from an even earlier low such as the bottom of the sell-off from the Second Peak and sometimes even the First Peak sell-off.
Again, the preceding “rules” are more “rules-of-thumb” than hard-and-fast rules. The Lindsay Timing Model explained in Part IV, “The Counts,” gives the analyst the confirming information and confidence needed to sort out and determine which of the possible counts is the correct one. “Variations of this sort must always be expected. They are hard to predict, but a technician familiar with the underlying principles should have no trouble recognizing them when they occur.”
First Floor Wall
Once the base following the Separating Decline is completed by the second dip, or test of the bottom, price is then expected to shoot up in a fast, short-lived advance. This is called the First Floor Wall of the Domed House (see Figure 5.6). The advance from the bottom to the top of the First Floor Wall should be extremely powerful—almost straight up. A wall that appears to be broken into two advancing waves by an intervening wave may contain no roof and be rushing to its completion at the Cupola. This implies that the Domed House will be shorter than normal. Again, Lindsay did not share how to determine whether the roof is missing prior to completion of the pattern. While a missing roof may be known with certainty only in hindsight, the chance that a roof may be missing is an important possibility of which to be aware.

First Floor Roof
This First Floor Wall is followed by a five-wave reversal pattern that serves to consolidate the sharp rise. The five-wave reversal is referred to as the First Floor Roof (see Figure 5.7). Lindsay wrote that a five-wave reversal extending three months or more nearly always means that the formation is a Domed House. To help identify the five reversals, look for a period in which the average makes no net progress over a significant period of time. The First Floor Roof is similar to a triangle in that it usually has five reversals. After the fifth reversal is completed, the main uptrend is resumed.

Characteristics
The First Floor Roof is not as straightforward as the First Floor Wall. The reader will find it helpful to be aware of both the characteristics of the Roof as well as the anomalies that have been known to occur.
Roof Rallies
Lindsay wrote, “Usually, both of the rallies within a triangle are of about the same amplitude.” This characteristic can be a big help in identifying the First Floor Roof of a 3PDh formation, particularly when the First Floor Roof is not of the shape expected. Once the roof is identified, the rest of the suspected formation is easily confirmed or invalidated. Figure 5.8 breaks out the First Floor Roof from the 1968 top formation. Note that the first decline is a false start (to be discussed later). Once the high of the First Floor Wall is complete, however, wave 1 of the roof begins its decline in earnest. Waves 2 and 4 are of equal length in distance covered (price, not time). Another interesting aspect of this particular roof is the deep drop made during wave 5. At the time, a decline of this magnitude would have been fairly disconcerting to the analyst. But the knowledge that (the assumed) waves 2 and 4 were equal should have given him or her confidence to stay with the inferred pattern. Other than the wave-5 plunge, the 1968 First Floor Roof stays true to the idealized formation in its horizontal character.
Figure 5.8. Roof Rallies. Chart created by MetaStock®.
Despite the horizontal roof depicted in Figure 5.8 and Lindsay’s idealized chart, it appears that an equal number of roofs tend to decline as in Figure 5.3. Having noted this, the analyst still needs to be alert for variations.
Anomalies
The following two anomalies, while not common, have occurred enough times that the reader will find it advantageous to be prepared to see them again in the future.
Missing Roof
It is extremely rare, but sometimes it does happen that the roof is composed of a simple pullback, or short reaction, rather than the five reversals we would normally expect.
As discussed previously, if this happens, the missing roof implies that the Domed House will be unusually short-lived. An example of this phenomenon can be seen in the 1948 formation in Figure 5.5.
False Starts
Sometimes what is perceived as the top of the First Floor Wall is not correct. Oftentimes we see a little dip after the strong advance of the wall and it is tempting to count that as the first reversal of the roof. “This is a peculiarity which comes up in many triangles and similar chart patterns, both in the average and individual stocks. If the first sell-off in a trading range is shallower than the next two, it may not count as the First Reversal at all, even though it lines up with them symmetrically on the chart.” Figures 5.3 and 5.4 both show false starts to the ensuing triangles. This irregularity should not provide anything more than an annoyance to the analyst. Being aware of the possibility of this peccadillo will help to avoid unnecessary frustration.
Second Floor Wall
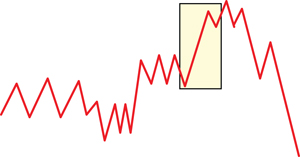
The First Floor Roof is subsequently followed by another sharp rise, referred to as the Second Floor Wall (see Figure 5.9). The Second Floor Wall, like the First Floor Wall, is characterized by an abrupt spurt upward. Lindsay also said to watch for high volume during the “construction” of the wall because that too is a characteristic of the wall.
Figure 5.9. Second Floor Wall.
The Cupola and the Decline
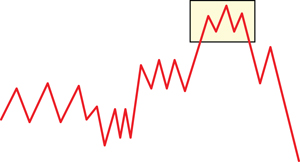
Once the advance from the First Floor Roof (the Second Floor Wall) is complete, the average pulls back slightly. Price can then be expected to make a run to yet another new high. “Normally, the average gains less on the last leg of a major advance (despite continued high volume) than on most of the previous legs. If this is not true, the market is not making a top.” In other words, the advance slows down as it gets older. The new high is not held and the average quickly pulls back again, retracing the entire gain. Once the new and final high has been passed and prices start to drop, they usually do not drop very far before they start to rally again and form a clearcut right shoulder or the right side of the second-story rooftop (see Figure 5.10). A horizontal line drawn through the left and right shoulder of the Cupola suggests the roof of a second story. These movements suggest a cupola or a small dome on the top of a building, hence the formation is called a Domed House. The entire 3PDh formation is capped by a small head-and-shoulders pattern that resembles the cupola of a house.
An abrupt decline then follows that right shoulder. This larger decline from the right shoulder of the Cupola precedes another short recovery. The top of this second recovery often ends at a level, relative to the First Story Roof, which suggests that it is the right side of the First Story Roof. This advance can also be interpreted as the right shoulder of a different, larger head-and-shoulders formation. In this head-and-shoulders formation, the triangle-shaped First Floor Roof functions as the left shoulder. “Note that the First Floor Wall is balanced by the drop from the final right shoulder, and the rise from the First Floor Roof is offset by the decline from the first right shoulder in the Cupola. This gives the pattern a square effect. At the same time there is a rounded effect at the top due to the head-and-shoulders pattern.”
After this second, lower-right shoulder is completed, the average drops back to the ultimate low of the base where the Domed House began. “But there has never been an exception to the rule that the entire gain in a Domed House has eventually been cancelled.” The knowledge that the entire gain of the previous (approximately) two-plus years will be wiped out is what makes familiarity with the 3PDh formation so empowering and potentially profitable. Even if a trader misses the top of the Cupola, he or she still has plenty of time to profit from shorting the market, given the size of the move ahead. The size of that move is easily ascertained by measuring the remaining distance to the bottom of the 3PDh formation.
Conclusion
In a newsletter dated September 4, 1968, Lindsay shared some tips for recognizing a Domed House that the reader should find helpful: “Here’s how the advance of January 1967 could have been recognized as a Domed House. All technical measurements of the market were terrifically strong; the advance-decline line, odd-lot indexes, volume and momentum studies, etc. They were entirely too favorable for the move to be just a rally in a bear market. On the contrary, they suggested a major bull market had begun. Yet after rising only three weeks, the Dow-Jones Industrials stalled. In a genuine bull market and after such a powerful start, the average would have kept going. It wouldn’t have hesitated as long as it did before and after [the top of the First Floor Wall]. It was a combination of a bullish technical position and a sideways movement which began prematurely and lasted unduly long. The only way of reconciling the contradictions was to assume that a Domed House was under way.” In his August 16, 1972, newsletter, Lindsay wrote that the most important long-term interval lasts about 15 years or somewhat longer. “It is needed to understand the Domed House fully.” The 15-year interval is covered in Part IV.
George Lindsay is most well known for his Three Peaks and a Domed House model, no doubt due to its descriptive, if awkward, name. While many technical analysts are familiar with the name of the model, very few have any experience using it. Even a superficial familiarity with the model should be of great benefit to the most passive investor. While the array of possible counts may seem confusing at first, Lindsay shared several examples (see Table 3.1) in which only the basic form of the model was present at several market tops and the counts that he had established were missing. The 3PDh model is one of those few methods that will yield results to the beginner and continue yielding as more effort is expended on the part of the student. Part III examines the Lindsay Timing Model, which is both its own, free-standing model as well as the concluding technique for determining the correct count for the 3PDh model.
Endnote
1 Unless otherwise indicated, all quotes in this chapter are taken from George Lindsay’s self-published newsletter, George Lindsay’s Opinion, during the years 1959–72.