
Chapter 3. The Phenomenon
“There are also periods when trends are short-lived and subject to frequent reversal. Technicians assume that such irregular markets do not follow any recognizable pattern for long and that abrupt changes in trend cannot be predicted. My studies show that these apparently haphazard movements nearly always follow the same pattern. The two formations to be explained have been repeated over and over again from the earliest records. A rough tally indicates that the market has followed them at least 60% of the time for the past 150 years.”1 —George Lindsay
After introducing the concept in 1968, George Lindsay published his “Three Peaks and a Domed House” newsletter in 1970. This newsletter, along with others, later appeared in a book titled Encyclopedia of Stock Market Techniques, published by Investors Intelligence.
Those who are already familiar with this model will notice something missing from this book: Lindsay’s numbering system for the different waves within the formation. The system Lindsay used in his 1970 newsletter explaining the “Three Peaks and a Domed House” was cumbersome and distracted from a student’s understanding of the model. Even Lindsay didn’t hold the system he used in that newsletter sacrosanct because only two years later, in his May 15, 1972, newsletter, he changed the system to include fewer numbers. This book has eliminated the numbering system entirely and replaced it with terms that should be intuitively obvious to the reader rather than forcing the reader to constantly check and recheck which numbers apply to which parts of the model.
Lindsay had a very definite opinion as to which equity index should be used with his model. In his 1969 pamphlet, “One Year Later: A Follow-Up of the Three Peaks and Domed House,” Lindsay writes, “Averages composed of a small number of blue chips have always had crisper chart patterns than all-inclusive indexes. It is largely because unseasoned stocks are in a state of flux: new ones are being added, old ones are dropped, and the number of shares is constantly changing. The Dow Jones stocks are more stable in composition. Talk of the Dow Jones Average as being unrepresentative is beside the mark. If you want to know the true level of ‘the market,’ look at the broader averages. If you want to predict the future, go by the Dow or the New York Times Industrials. Indeed, some technicians get the most reliable results by using an index of only ten or twelve sensitive and influential stocks. The NYSE Index of all stocks is nearly worthless in forecasting.”
This chapter’s opening quote from Lindsay contains the bold statement (Lindsay was prone to such statements), “A rough tally indicates that the market has followed them at least 60% of the time for the past 150 years.” Clearly 60% of the Dow’s price action for the past 150 years was not spent forming the “Three Peaks and a Domed House” pattern. Lindsay’s contention was that the pattern could be found at 60% of bull market tops and at the peaks of rallies in bear markets (cyclical bull markets). “The majority of all major advances ended in a pattern which resembled the Three Peaks and a Domed House. Some came closer to the ideal form than others. However, a few top areas don’t fit into the pattern at all: it would be stretching the imagination to see it around the highs of 1909 and 1937.” One hundred-fifty years prior to the year of publication of Lindsay’s newsletter would have meant 1820—well before the Dow Jones Industrial Average was created in 1896 (and even before its forerunner, the Dow Jones Averages, was created and published by Charles Dow in 1884). Lindsay wrote, “The Dow-Jones 20-stock average is used before 1897, the Dow-Jones Industrials since then.” The Dow-Jones 20-stock average is the Dow Railroad index, which, by 1896, contained 20 railroad stocks and evolved from the original Dow Jones Averages and its 11 transportation-related stocks. In Lindsay’s 1965 newsletter “A Timing Method for Traders,” Lindsay wrote that he used a daily average of seven market leaders from 1861 to 1885. That still leaves 41 years unaccounted for, but the examples Lindsay shares are no earlier than 1890.
Identifying Characteristics
Lindsay wrote that the two patterns which began July 26, 1893, and July 26, 1910, were very clear and provided the inspiration for the “Three Peaks and a Domed House” formation. These two patterns peaked September 4, 1895, and September 30, 1912, respectively. This chapter introduces the “Three Peaks and a Domed House” formation (subsequently referred to as 3PDh) and its major characteristics. These characteristics should not be passed by too quickly by the reader in search of more depth or detail because these characteristics, though simple, are extremely important. The pattern is ostensibly a method for identifying the end of a bull market. However, 3PDh is broader in scope than simply using it to find the top of a bull market. Once it’s recognized, one can trade it on the way up, too. Identifying and separating true 3PDh patterns from imposters is essential to profitable trading of the pattern prior to its completion. Lindsay wrote: “These patterns last a long time so anyone can use them to advantage if he recognizes them at an early stage.”
Lindsay also wrote, “Through a very complicated procedure, it is possible to forecast the inception of such a movement before it begins.” Unfortunately, he didn’t describe that “complicated procedure” and, unless he passed it on orally, it appears he took it with him to his grave. Fortunately, by identifying the key characteristics of the pattern, one needn’t use complicated procedures to recognize the pattern long before its completion. The beauty of the pattern is in its simplicity.
Figure 3.1 presents an idealized shape of the 3PDh price pattern. One can clearly see the three peaks toward the left side of the figure followed by a sharp, two-wave sell-off. The Domed House encompasses everything after the two-wave sell-off (middle to right side of Figure 3.1), including the large sell-off taking prices back to the bottom of the entire 3PDh pattern. The chief characteristic of the whole chart is that price makes rapid upside progress, but continues for only a short time. In between the brief spurts, prices go through long stretches of consolidation, or sideways movements. The pattern is characterized by sharp rises followed by long consolidations. When you’re searching for the pattern, it is tempting to accept advances that clearly break down into advancing waves rather than the sharp advances Lindsay described. Don’t be tempted by these advancing “waves” unless other segments of the pattern are absolutely 3PDh and the weight of the evidence is undeniable. Whenever the market spends lots of time moving sideways, we should look for other indications of a 3PDh pattern. In this pattern, prices advance only about half the time—they move sideways on as many days as they advance.
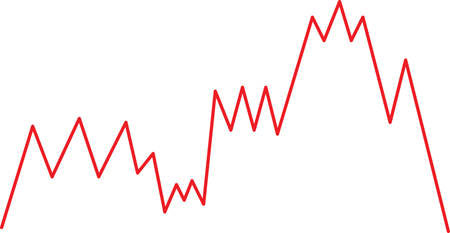
Lindsay wrote: “Both the Three Peaks and the Domed House are distinguished by the advances and declines which travel many points in a straight line. But these movements don’t last long. In between the few explosive moves, the market spends much of the time backing and filling in a comparatively narrow range. These characteristics usually make it easy to recognize a formation shortly after it begins. Once the formation is underway, it usually lasts a long time. This gives it predictive value.”
Lindsay differentiated between patterns that emerge from advances off a bear market low (capping a cyclical bull market) and those that culminate a secular bull market.
“The most typical Three Peak-Domed House formations start at a bear market low. When this has been true, the highest point in the pattern has never equaled the top of the previous major bull market.”
Lindsay didn’t mean to imply that the 3PDh formations are any more common off of bear market lows than bull market highs. He only meant that formations which emerge from advances off bear market lows have a more “typical” structure (see Chapter 4, “Three Peaks,” and Chapter 5, “A Domed House”) than what one sees in patterns at bull market highs. Hence the following quotes:
“The Three Peak-Domed House pattern can also begin in the course of a long advance. When this happens, the top of the Domed House is usually the bull market high.”
“The patterns which start in the latter part of a major bull market do not normally last as long as those that begin at a bear market low and are often less symmetrical.”
Finally, the completed Domed House section of the pattern should have a square effect about it and a rounded top. In Figure 3.1, after the Three Peaks at the left side of the chart, and after the two-wave sell-off, a small base is formed. This base is the first section of the Domed House and is followed by a sharp rise, which is called the First Floor Wall.
This First Floor Wall is followed by a five-wave reversal pattern that serves to consolidate the sharp rise. The five-wave reversal is referred to as the First Floor Roof. Lindsay wrote that a five-wave reversal extending three months or more nearly always means that the formation is a Domed House.
The First Floor Roof is subsequently followed by another sharp rise, which is referred to as the Second Floor Wall. The Second Floor Wall is followed, and the entire 3PDh formation is capped, by a small head-and-shoulders pattern that resembles the cupola of a house. A horizontal line drawn through the left and right shoulder of the cupola suggests the roof of a second story. After the Cupola, a decline back to the beginning of the pattern begins, which normally will include at least one bounce (a final right shoulder) on the way down. Note that the First Floor Wall is balanced by the drop from the final right shoulder and the rise from the First Floor Roof is offset by the decline from the first right shoulder in the cupola. This gives the pattern a square effect. At the same time, there is a rounded effect at the top due to the head-and-shoulders pattern.
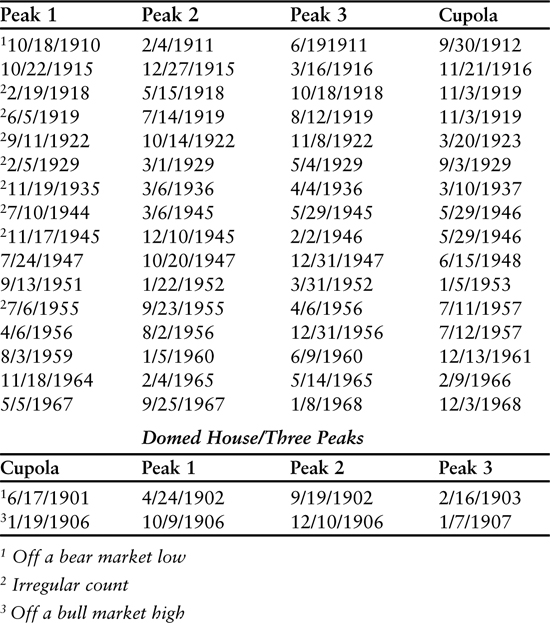
Finally, the 3PDh formation can sometimes take the place not just of a single advance, but of a bear market. In other words, instead of going down, the market fluctuates back and forth and traces this familiar pattern. When it takes the place of a bear market, the timing is irregular. See examples of 3PDh formations with irregular timing in Table 3.1.
Table 3.1. Three Peaks/Domed House
Each of these segments of the 3PDh will be examined in detail in the chapters that follow. Before moving on, however, two simple concepts that Lindsay wrote about are reviewed.
Principle of Equalization
As the reader will soon discover, when we examine actual examples of the 3PDh pattern, real life doesn’t always follow the “idealized” shape, time frame, or counts. Lindsay helps the analyst adjust for real-world uncertainties through the Principle of Equalization. Lindsay mentions the Principle of Equalization almost in passing. He defines it this way: “When one formation falls short of the normal duration, the next one equalizes the total elapsed time by becoming longer.” Determining what a “normal” time frame is requires some detective work. He is very clear that the time between the three peaks is “normally” eight months, so we would expect to adjust the expected duration of the Domed House if the Three Peaks were longer or shorter than eight months. It was mentioned previously that Lindsay wrote that a five-wave reversal extending three months or more nearly always means that the formation is a Domed House. He didn’t say whether there exists a minimum or maximum time period for the five-wave reversal (First Floor Roof), so a three-month estimate is all there is to work with. Adjusting the duration of the “count” (to determine the final top of the bull market) is not as simple as adding an extra month if the duration of the Three Peaks is a month short. Fortunately, it isn’t complicated either and is explained in Chapter 5.
Domed House Before Three Peaks
There have been instances when the Domed House formation appeared before the Three Peaks formation. In this case, the Separating Line (explained in Chapter 4) follows the Domed House. “Every time a clearly defined Domed House started at a bear market low, it was followed in due course by the Three Peaks before there was another major decline. There have been only a few cases when a major bull market high took the form of a Domed House followed by the Three Peaks. When the Three Peaks follows the Domed House, a complete retracement may not be made for a long time but it’s always made.” This inversion of Lindsay’s model is relatively rare and the reader would almost certainly notice it if it were to happen. Other than the formation that occurred in April 1938 to June 1940, the few examples given by Lindsay of this reversed pattern were all in the last decade of the 19th century and first decade of the 20th century. See Table 3.1 for examples.
Endnote
1 Unless otherwise indicated, all quotes in this chapter are taken from George Lindsay’s self-published newsletter, George Lindsay’s Opinion, during the years 1959–72.