
Chapter 4. Three Peaks
“The chief characteristic of this movement, as of the whole chart, is that the average makes rapid upside progress, but keeps going for only a short time. In between brief spurts, the average goes through long stretches of consolidation, or sideways movements.”1 —George Lindsay
It is very easy to find the Three Peaks formation on a chart given the Separating Decline that follows. Once you understand the Three Peaks formation, you will begin seeing it everywhere. “It is not unduly technical. All you have to do is fix a couple of shapes in your mind and then look at the charts with fresh eyes.” At that point, the challenge will be to make certain that the Three Peaks pattern you have identified fulfills the requirements, or characteristics, of the 3PDh formation. This chapter introduces the reader to actual examples of the Three Peaks formation and prepares the reader for certain irregularities that have appeared in the past.
Characteristics and Irregularities
One can clearly see the three peaks toward the left side of Figure 4.1 followed by a sharp, three-wave sell-off. The Three Peaks pattern usually starts with a base (not shown), but Lindsay made clear that the base is not important in identifying the formation. From the bottom of the base, the average rises sharply to the First Peak. Lindsay wrote that, typically, the top of the peak has a rather flattened shape.
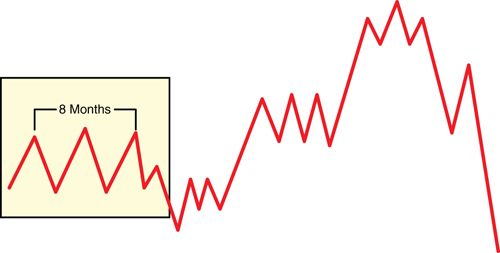
“The tops of all three peaks are usually in the same general price range. While there can be considerable variation in the exact levels, the symmetry of the whole formation is usually apparent.” The “same general price range” is a relative statement and depends on the time frame you are examining. When looking only at a 3PDh formation, the Three Peaks may not appear to be in the “same general price range.” But when the reader examines not just the 3PDh pattern but also the entire advance that preceded the pattern, the phrase “same general price range” takes on a different meaning. After each peak is completed, prices react more than you would expect after such a short advance. Normally, the retracements after peaks one and two are of equal depth.
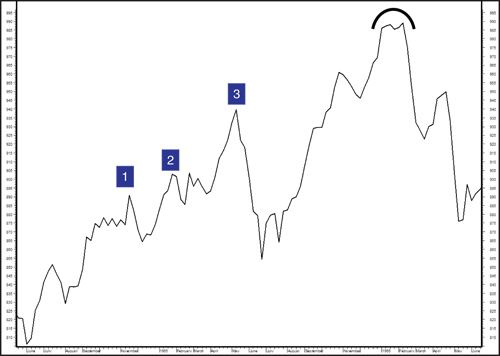
Lindsay’s first example of a 3PDh formation starts at the bear market low in October 1946 (see Figure 4.2). Note that the period between Peaks One (February 8, 1947) and Three (October 10, 1947) is the standard eight months. In this example, Peak Two is above both Peak One and Peak Three.
Figure 4.2. Three Peaks (1946–48). Chart created by MetaStock®.

An irregularity in the Three Peaks formation in 1947 is the decline from Peak One. The reaction after Peak One declined much more deeply than the decline after Peak Two. This irregularity is caused by the fractal nature of Peak One. This particular phenomenon is examined later in this chapter.
Figure 4.3 is an example Lindsay shared of the 3PDh formation at a bull market high. In this case, it was the February 1966 bull market high. Note that the advance into Peak Three on May 14, 1965, was preceded by a short consolidation during most of February and March just as the advance into Peak One was preceded by a short consolidation from late September to early November. “Whenever the market spends so much time moving sideways, we look for indications of a Three Peaks-Domed House pattern.” Lindsay made note of the fact that the time between Peak One and Peak Three in this case was six months—the minimum duration. “In a major formation, the typical duration from the top of the First Peak to the high of the Third is about eight months. It has never been less than six nor more than ten, and usually has varied between seven and eight.” He also noted that the time period between the start of the consolidation in late September (prior to Peak One) and Peak Three was eight months—the normal duration. He doesn’t explain this; he simply makes note of it. But it is one of many examples of how counts can differ and the analyst must show flexibility, even some imagination, when working with this geometric formation. One particular example of flexibility: If the time between Peak One and Peak Three is short (less than six months), look to see whether Peak Three has the “flattened shape” (rounded top) discussed previously. If a trading range forms after the highest day (the peak) of this rounded top at Peak Three, and there is a point at the end of the trading range where price falls off suddenly, then measuring from Peak One to that point usually causes the time span between Peaks One and Three to meet the minimum required time—six months. Variation in counts is dealt with more in Chapter 3, “The Phenomenon.”
Figure 4.3. Three Peaks (1964–66). Chart created by MetaStock®.
Fractals
Sometimes a 3PDh formation will occur within a single peak of a larger (“major”) formation. Lindsay referred to a 3PDh pattern inside of a single Peak as a “minor” formation. Modern readers will know this manifestation as a fractal. Figure 4.4 breaks out the fractal structure that created Peak One of the 1946–48 3PDh formation. The horizontal line helps delineate the fact that the Separating Decline after the fractal’s Third Peak extended below either of the reactions from Peaks One or Two as is required for the 3PDh formation. Separating Declines are covered in the next section. One can just make out the head-and-shoulders top that forms the Cupola, but a five-wave reversal that creates a First Floor Roof is definitely missing. After the Cupola, the index returns to the beginning (bottom) of the formation as is expected of any 3PDh pattern.
Figure 4.4. Three Peaks (1946–48). Chart created by MetaStock®.
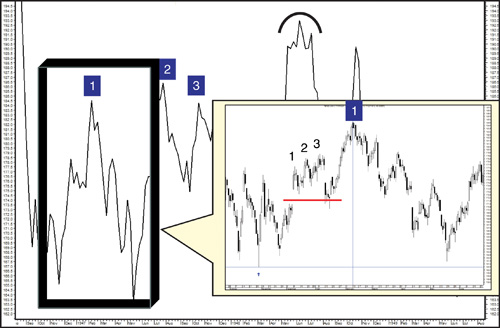
“Any one of the Three Peaks (in a major formation) can double as the Domed House of a minor formation. As a rule, it is more likely to be the Third Peak, rather than the first one, as in this case.”
Recognizing possible fractals is crucial to trading the 3PDh model. A relatively severe decline has always followed a Three Peak/Domed House pattern even when the pattern is contained within another pattern. A severe decline is expected after Peak Three of a 3PDh pattern as well. If the 3PDh pattern is a fractal, a relatively severe decline can be expected here too. A 3PDh pattern inside of one of the peaks is a warning that a big decline may be coming because it will need to undercut one of the previous reactions from a peak. By being aware of fractals, one can avoid big declines or even profit from them.
Separating Decline
After the Third Peak, a rather severe downtrend begins. It is called the Separating Decline because it separates the Three Peaks from the Domed House formation that follows (see Figure 4.5). The Separating Decline is a three-wave decline usually composed of at least two declining waves. The bottom of the second declining wave is always at a lower level than at least one of the reactions from Peaks One or Two, and often it is lower than both. Unless at least one of the two reaction lows is breached, the formation under consideration does not qualify as a Separating Decline and, by extension, the previous formation is simply three random peaks and not a Three Peaks pattern. One should have no trouble identifying the Separating Declines in Figures 4.2 and 4.3. They are the declines that immediately follow the Third Peak in each chart. Note that in Figure 4.2, the Separating Decline only breaches the reaction low following Peak Two and not Peak One (due to the fractal causing an abnormally deep decline after Peak One), whereas the Separating Decline in Figure 4.3 breaches both reaction lows following both Peaks One and Two.
Figure 4.5. Separating Decline.

Important Note: Toward the end of an advance that has proceeded for a year or longer with a subnormal rate of gain, the convention that the Separating Decline must dip under the low of a previous sell-off is not required. This exception is explored in Chapter 6, “The Tri-Day Method.”
Conclusion
The Separating Decline dropping below a reaction from a previous peak makes it appear as if the advance is getting tired. One can imagine traders and investors exiting the market in expectation of an extended decline. Perhaps it can be interpreted as a bearish head-and-shoulders top. The market participant who is aware of the 3PDh model is unlikely to be fooled by a failed head-and-shoulders top. Even a casual market participant acquainted with the 3PDh model will not only recognize a fractal within a peak being formed and suspect that a 3PDh is under construction, but also be prepared to avoid, or profit from, the coming downturn within the peak being observed, understand that a time is coming to reenter the trade, continue tracking the formation of a possible Three Peaks pattern, again avoid (or profit from) the approaching Separating Decline, and, finally, be mentally prepared to reenter the trade for what is possibly the biggest move of the bull market. All this while other traders and investors have become worn out from what they perceive as unprecedented volatility. Chapter 5, “A Domed House,” examines the Domed House pattern and its individual building blocks.
Endnote
1 Unless otherwise indicated, all quotes in this chapter are taken from George Lindsay’s self-published newsletter, George Lindsay’s Opinion, during the years 1959–72.