
Before we can add IPMI items to Zabbix, we should test IPMI access. By default, IPMI uses UDP port 623, so make sure it is not blocked by a firewall. Check whether your Zabbix server has the ipmitool package installed—if not, install it, and then execute the following:
$ ipmitool -U zabbix -H <IP address of the IPMI host> -I lanplus -L user sdr
Password:
Provide the password that you have set in the IPMI configuration. We are using user-level access, as specified by the -L user flag, so that administrative privileges should not be required for the Zabbix IPMI user. The -I lanplus flag instructs ipmitool to use the IPMI v2.0 LAN interface, and the sensor command queries the host for the available sensors. If your device has IPMI running on a non-default port, you can specify the port with the -p flag.
The output will contain a bunch of sensors, possibly including some such as these:
BB +5.0V         | 4.97 Volts        | ok
Baseboard Temp   | 23 degrees C      | ok
System Fan 2     | 3267 RPM          | ok
Power Unit Stat  | 0x00              | ok
That looks like useful data, so let's try to monitor fan RPM in Zabbix. In the frontend, navigate to Configuration | Hosts. To keep things organized, let's create a new host for our IPMI monitoring—click on Create host. Then, enter the following values:
- Name:
IPMI host - Groups: Click on Linux servers in the Other groups box, then click on the
 button, and make sure no other groups are in the In groups listbox
- IPMI interfaces: Click on the Add control and enter the IPMI address, and then click on Remove next to Agent interfaces
Switch to the IPMI tab, and enter the following values:
- IPMI username: Enter the username used for IPMI access
- IPMI password: Enter the password you have set for IPMI access
If you have a different configuration for IPMI, such as a different privilege level, port, or other parameters, set them appropriately. When done, click on the Add button at the bottom.
Now that we have the host part of IPMI connectivity sorted out, it's time to create actual items. Make sure Linux servers is selected in the Group dropdown, then click on Items next to the IPMI host, and then click on Create item. Enter these values:
- Name: Enter
System Fan 2(or, if your IPMI-capable device does not provide such a sensor, choose another useful sensor) - Type: IPMI agent
- Key:
System_Fan_2 - IPMI sensor:
System Fan 2 - Units:
RPM
When done, click on the Add button at the bottom.
Tip
For this item type, the item key is only used as an item identifier, and we could enter any string in there. We opted to use the sensor name with spaces replaced with underscores to make it easier to identify the item in trigger expressions and other places. The IPMI sensor name will determine what data will be collected.
On some devices, the sensor name could have a trailing space. This is not obvious from the default sensor output in ipmitool. If the sensor name seems correct but querying it from Zabbix fails, try to retrieve data for a single sensor from the Zabbix server:
$ ipmitool -U zabbix -H <IP address of the IPMI host> -I lanplus -L user sensor get "System Fan 2"
This will print detailed information for that sensor. If it fails, the sensor name is probably incorrect.
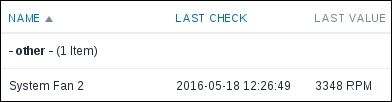
Let's check out the results of our work; open Monitoring | Latest data, and then select IPMI host in the filter:
Tip
Notice how the value is displayed fully and is not shortened to 3.3K. The RPM unit is included in a hardcoded unit blacklist, and items that use such units do not get the unit multiplier prefix added. We will discuss the unit blacklist in more detail in Chapter 22, Zabbix Maintenance.
Great, the hardware state information is being gathered correctly. What's even better, this information is retrieved independently of the installed operating system or specific agents and is retrieved even if there is no operating system running or even installed.