
Until now, you have learned how most of a server's components work and how to leverage Zabbix to acquire data from various external sources. Considering that, set up your monitoring system in a large, heterogeneous, and complex infrastructure. Most probably, you will find a different custom device, server appliance, and proprietary hardware. Usually, all those devices have an interface to be enquired, but, unfortunately, it often happens that most of the metrics are not exposed via Simple Network Management Protocol (SNMP) or any other standard query method.
Let's consider a practical example. Nowadays, all the UPSes own a temperature sensor, and if you are in a complex infrastructure, it is possible that those UPS's are custom made and out of standard, and, most probably, this sensor can be enquired only with a tool provided from the UPS vendor. Now, the temperature of a UPS is a critical parameter, especially if the UPS is a big, custom-made UPS. It is really important to monitor these metrics.
Imagine that your cooling system is not working properly; receiving an alarm right when the temperature reaches over the warning level is fundamental. On the other hand, predicting the failure will save a lot of money. Also, even if the physical damage is not really expensive, the downtime can cost a lot of money and have a terrible impact on your business. A good example is the case of a trading company. In this scenario, everything should be in perfect working order. In this environment, there is terrible competition to achieve better performance against competitors—buying a stock option some milliseconds before the others is a big advantage. Here, it is easy to understand that, if servers are not performing well, it is already an issue; if they are down, it is a complete disaster for the company. This example explains how critical it is to predict a failure. Moreover, it is important to understand how critical it is to retrieve all functioning parameters of your infrastructure. This is where Zabbix comes to the rescue, providing interesting methods to retrieve data that interacts with the operating system, eventually enabling you to use a command-line tool. Zabbix's responses to this kind of requirement are as follows:
- External checks (server side)
UserParameter(agent side)Zabbix_sender: This binary can be used on both the agent side and the server side- A simple, efficient, and easy-to-implement communication protocol
This chapter will entirely explore those alternatives to interact with the operating system and receive data from external sources. In this chapter, you will learn that there isn't a general, optimal, valid solution for all the problems, but each of them has its pros and cons. This chapter will make you aware of all the things that need to be considered when you implement a custom check. The analysis proposed in this chapter will enable you to choose the best solution for your problems.
This chapter will cover the following points:
- Writing a script and making it available as external scripts
- The advantages and disadvantages of scripts on the server side and on the agent side
- Exploring alternative methods to send data to your Zabbix server
- Detailed documentation about the Zabbix protocol
- Commented educational implementation of the Zabbix sender protocol
Zabbix provides features to cover all the items that cannot be retrieved with the standard agent. In real life, it is possible that you are not able to install the standard agent on the device that you would like to monitor. A practical example is the UPS, all the servers that, for some reason, cannot be compromised when installing external software, or all the appliances that cannot have custom software installed.
Now, for all those reasons, you cannot have an agent on your device but you need to monitor the vital parameters of this device, the only feasible solution for which is to use an external check.
The script's location on Zabbix is defined in the zabbix_server.conf configuration file. Since Zabbix Version 2.0, the default location has changed to /usr/local/share/zabbix/externalscripts.
Previously, it was defined as /etc/zabbix/externalscripts; anyway, you can change it by simply specifying a different location on zabbix_server.conf using the ExternalScripts parameter:
### Option: ExternalScripts
# Mandatory: no
# Default:
# ExternalScripts=${datadir}/zabbix/externalscripts
ExternalScripts=/usr/lib/zabbix/externalscripts
There are some important enhancements in external checks and scripts have been introduced since Zabbix versions 2.2 and 2.4:
- The key syntax now supports multiple comma-separated parameters
- There is support for user macros in script commands
- User parameters, global scripts, and external checks now return the standard error along with the standard output—this can be managed within your trigger
- There is support for multiline values
Now, let's see how external checks work in detail.
Now, it is time for a practical example. This is an easy example to understand how an external script works. In the following example, we will count the number of open files for a specified user. The first thing to do is create the script and place it in the ExternalScripts location. The script will be called lsof.sh and will contain the following code:
#!/bin/bash
if grep -q  $1 /etc/passwd
        then  lsof -u $1 | tail -n +2 |wc -l
 else
        echo 0
fi
This software requires the username as an input parameter; check whether the username exists on the system, and then return the number of open files for that account.
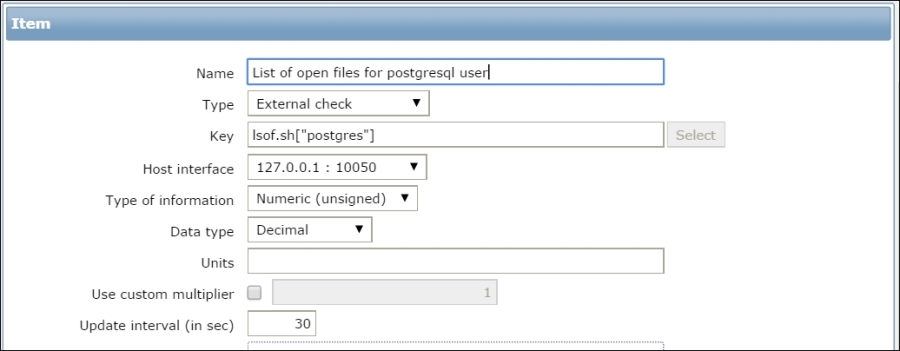
Now, you only need to create a new item of the External check type. In the Key field, enter lsof.sh["postgres"], as shown in the following screenshot:
Now, on navigating to Monitoring | Latest Data, it is possible to see the data retrieved by our script:
The external script must be come back in a reasonable time; otherwise, the item will be marked as unsupported.
Now that you know how ExternalScripts works, it is time to see how we can implement something more complex thanks to this feature.
In the next example, we will monitor certain remote Oracle instances. There are some prerequisites to have this setup fully working: an Oracle client installed with a working sqlplus, a tnsping, and an account configured on your Oracle database target.
The latest version of this software is available for download at http://www.smartmarmot.com/product/check_ora.
Anyway, it is interesting to see how it evolved from Version 1.0. Version 1.0 is available for download directly on the Zabbix forum at https://www.zabbix.com/forum/showthread.php?t=13666.
This script is a good example of an external check. Basically, to have everything properly configured, you need to do the following:
The last point is of particular importance and is a particular mode of using Zabbix. This method can be reused every time you need to aggregate metrics that are not tied to a real host but to a service. To do a practical example, if you have a DBMS that can failover against another server, you can simply create a Zabbix fake host that is called with the same name as that of your database. Now, if the services do failover, you don't have an interruption on your collected data because the failover process is transparent from the server that provides the service. This method is applied here because the Oracle client will handle a failover automatically once properly configured.
Now, you can go ahead and create a host with the same name as that of your SID, for example, you have an Oracle instance to monitor that is defined as ORCL on tnsnames.ora; thus, the Zabbix host will be ORCL.
The detailed configuration of an Oracle client is out of the scope of this book. Once you complete the configuration, you can test the script by simply running the following command:
check_ora.sh[-i <instance> -q <query>]
In the preceding command line, <instance> represents your instance name and <query> is the query file that you would like to run. There is a large number of query files prebuilt in the check_ora directory; you can check all of them against your database.
Now, in the Zabbix host, you need to create the item to retrieve the external check, and the key will be as follows:
check_ora.sh[-i {HOSTNAME} –q <queryhere>]
For example:
key="check_ora.sh[-i {HOSTNAME} -q lio_block_changes]"
The template is available on the forum at the same location. Note that {HOSTNAME} is expanded with the hostname, which, in our case, is exactly the Oracle instance name. You can have a generalized template using the {HOSTNAME} macro, and their items are propagated across all your databases' hosts.
Now, the life cycle of this item will be the following:
- Zabbix calls the script.
- The script will perform the following:
- Log in to the database
- Execute the query and retrieve the value
- Return the value on the standard output; Zabbix will receive the value, and, if it is valid, it will be stored
The core function of check_ora.sh is execquery(). The function is the following:
execquery () {
start_time=$(date +%s)
#        echo "Time duration: $((finish_time - start_time)) secs."
echo "BEGIN check_ora.sh  $1 $2 `date`"  >> /tmp/checkora.log
   cd $SCRIPTDIR;
   sqlplus -S $1 <<EOF | sed  -e 's/^ *//g'
set echo off;
set tab off;
set pagesize 0;
set feedback off;
set trimout on;
set heading off;
ALTER SESSION SET NLS_NUMERIC_CHARACTERS = '.,';
@$2
EOF
finish_time=$(date +%s)
echo "END check_ora.sh  $1 $2 `date`"  >> /tmp/checkora.log
echo "check_ora.sh  $1 $2 Time duration: $((finish_time - start_time)) secs."  >> /tmp/checkora.log
}
This function will begin producing log information on /tmp/checkora.log:
start_time=$(date +%s)
#        echo "Time duration: $((finish_time - start_time)) secs."
echo "BEGIN check_ora.sh  $1 $2 `date`"  >> /tmp/checkora.log
Those are useful to understand which external check is ongoing and against which database. Plus, in the log file, you will find the elapsed time for the whole operation:
finish_time=$(date +%s)
echo "END check_ora.sh  $1 $2 `date`"  >> /tmp/checkora.log
echo "check_ora.sh  $1 $2 Time duration: $((finish_time - start_time)) secs."  >> /tmp/checkora.log
}
Since this file is shared (between the check_ora.sh process) and the Zabbix calls are not serialized, it is important to report the script-calling line twice so that you can identify exactly which stating line corresponds to which finish line. Here, to avoid any doubt, the elapsed is calculated and reported on the finish message.
After the script, call sqlplus:
sqlplus -S $1 <<EOF | sed -e 's/^ *//g'
Here, sed cleans up the white space at the beginning of the output. This is because the returned data is a number that cannot begin with blank spaces; if that happens, the item will become unsupported!
The following code snippet makes an Oracle client less verbose:
set echo off;
set tab off;
set pagesize 0;
set feedback off;
set trimout on;
set heading off;
The preceding lines are important to avoid noise in the output. The following code snippet explains the separator that should be used:
ALTER SESSION SET NLS_NUMERIC_CHARACTERS = '.,';
This section is important because you can have databases installed for different reasons with different character sets. Also, the client can use a different separator for decimals. You need to avoid all the uncontrolled charset conversions, and this is a general rule. Finally, the script executes the query file in the following way:
@$2
EOF
The output is returned in a standard output and is collected from Zabbix.
This script covers all the critical points that you need to pay attention to:
- Don't introduce unwanted characters into the output
- Be aware of the type; so, if a number is expected, remove all the unneeded characters (such as heading spaces)
- Avoid local conversions of numbers; the case of the dot and comma is a good example
- Have a log, keeping in mind that external scripts are not serialized, so you can have your log messages mixed in your log file
- Be aware of the time spent by the script from when the script is called until the script provides the output
- Those scripts, of course, run with the Zabbix server user, so perhaps you need to take care of file permissions and
sudoprivileges
Remember that, if the requested script is not found or the Zabbix server has no permissions to execute it, the item will become unsupported. Also, in the case of a timeout, in both of the preceding cases an error message will be displayed and the forked process for the script will be killed.
In this section, you have seen how external checks can be executed and how a complex task, such as database monitoring, is handled with them. If you have few external checks to implement, this can be a feasible solution to retrieve metrics. This kind of approach with externals checks, unfortunately, is not the solution to all the problems. On the other hand, you need to consider that they are really resource intensive and were once widely applied. Since external checks are on the server side, it is better not to overload the Zabbix server.
The Zabbix server is the core component of your monitoring infrastructure, and you can't steal resources from this server.