 Creating graphs
by Andrea Vacche, Patrik Uytterhoeven, Rihards Olups
Zabbix: Enterprise Network Monitoring Made Easy
Creating graphs
by Andrea Vacche, Patrik Uytterhoeven, Rihards Olups
Zabbix: Enterprise Network Monitoring Made Easy
- Zabbix: Enterprise Network Monitoring Made Easy
- Table of Contents
- Zabbix: Enterprise Network Monitoring Made Easy
- Zabbix: Enterprise Network Monitoring Made Easy
- Credits
- Preface
- I. Module 1
- 1. Getting Started with Zabbix
- The first steps in monitoring
- Zabbix features and architecture
- Installation
- Summary
- 2. Getting Your First Notification
- 3. Monitoring with Zabbix Agents and Basic Protocols
- 4. Monitoring SNMP Devices
- 5. Managing Hosts, Users, and Permissions
- 6. Detecting Problems with Triggers
- 7. Acting upon Monitored Conditions
- 8. Simplifying Complex Configurations with Templates
- 9. Visualizing Data with Graphs and Maps
- 10. Visualizing Data with Screens and Slideshows
- 11. Advanced Item Monitoring
- 12. Automating Configuration
- 13. Monitoring Web Pages
- 14. Monitoring Windows
- 15. High-Level Business Service Monitoring
- 16. Monitoring IPMI Devices
- 17. Monitoring Java Applications
- 18. Monitoring VMware
- 19. Using Proxies to Monitor Remote Locations
- 20. Encrypting Zabbix Traffic
- 21. Working Closely with Data
- 22. Zabbix Maintenance
- A. Troubleshooting
- B. Being Part of the Community
- 1. Getting Started with Zabbix
- II. Module 2
- 1. Zabbix Configuration
- 2. Getting Around in Zabbix
- 3. Groups, Users, and Permissions
- 4. Monitoring with Zabbix
- Introduction
- Active agents
- Passive agents
- Extending agents
- SNMP checks
- Internal checks
- Zabbix trapper
- IPMI checks
- JMX checks
- Aggregate checks
- External checks
- Database monitoring
- Checks with SSH
- Checks with Telnet
- Calculated checks
- Building web scenarios
- Monitoring web scenarios
- Some advanced monitoring tricks
- Autoinventory
- 5. Testing with Triggers in Zabbix
- 6. Working with Templates
- 7. Data Visualization and Reporting in Zabbix
- 8. Monitoring VMware and Proxies
- 9. Autodiscovery
- 10. Zabbix Maintenance and API
- C. Upgrading and Troubleshooting Zabbix
- III. Module 3
- 1. Deploying Zabbix
- 2. Distributed Monitoring
- 3. High Availability and Failover
- Understanding high availability
- Understanding the levels of IT service
- Some considerations about high availability
- Implementing high availability on a web server
- Configuring the Zabbix server for high availability
- Implementing high availability for a database
- Summary
- 4. Collecting Data
- 5. Visualizing Data
- 6. Managing Alerts
- 7. Managing Templates
- 8. Handling External Scripts
- 9. Extending Zabbix
- 10. Integrating Zabbix
- D. Bibliography
- Index
In this recipe, we will show you how to build some nice looking graphs from the data that we have gathered from our items.
For this recipe, we need a Zabbix installation and an agent installed on the Zabbix server or another host that we can use. We also need admin rights in Zabbix to be able to create our graph.
- First we need an item. For this we will monitor our CPU load as it always gives a nice graph. Add an item
system.cpu.load[percpu,avg1]. If you don't know how to do this, have look at Chapter 4, Passive agents or Active agents. - Next go to Configuration | Hosts, then go to Configuration | Template if you would like to create it in a template.
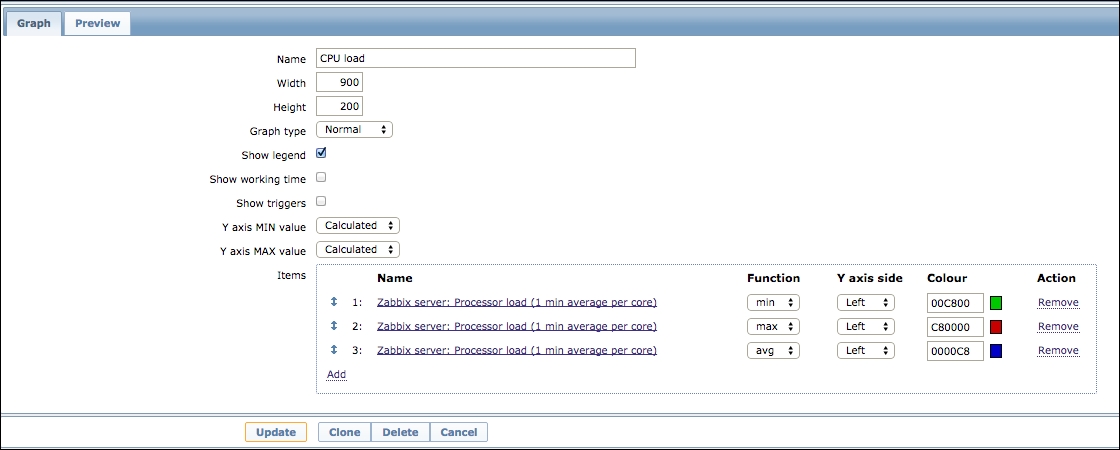
- Click on the Graphs link after your host and click Create graph in the upper right corner.
- In the Name box we add a name for our graph, example:
CPU load. - We can set the Width and the Height of our graph.
- Next we select the Graph type. This can be
Normal,Stacked,Pie, orExploded.Normalis with lines,Stackedis layers above each other andPie/Explodedis a representation in a pie form.Explodedis almost exactly the same except that it shows the individual segments of the pie in an exploded view. - The Show legend will display the graphs legend if marked.
- The Show working time box will show the working hours in our graph. (Remember those can be set under Administration | General | Working time).
- Percentile line (left | right) will set the percent for the graph left or right. This only works for normal graphs.
- Y axis (Min | Max) value will be the maximum or minimum value for our Y axis. This can be changed in
Calculated,Fixed, orItem. When choosingCalculatedthose will be calculated by Zabbix.Fixedwill set a fixed min or max value. This can't be done forpieandexploded pie. When we choose X, it will be the last value of the selected item. - When we select
pieorexploded pie, we also have the option 3D view which will create a 3D view of our pie. - Next we click on Add in the Items box and we add our item. This we can select from the list of items that will pop up.
- Next select the Function here; we can choose
avg,max, andmin. This will show us the average minimum or maximum values. - Y axis side can be switched from
LefttoRight. - And in the Colour box, we can choose another color by adding the correct RGB color in hex notation or by clicking on the color box and choosing a new color from the list of colors.
- When this is all done we can save our graph.
For every item in Zabbix, we can create a graph. For this, we should select the item that the graph should check. We can select more then one item from the item box. Another great feature is that we can mix different items in one graph, example. CPU load, Memory usage, Disk I/O, and so on. This way we could, for instance, see the impact of memory usage on other parts of our system.
We can make use of macros in map names but have to do it a bit differently. We have to add it with this syntax: {host:key.function(param)}. In our case, it would look like this, CPU load {{HOST.HOST}:system.cpu.load[percpu,avg1].last(0)}. This example would return a header such as: CPU load 0.5.
Also Zabbix supports some graphs out of the box. That means if you add a Zabbix template to your host, it will probably already contain some graphs.
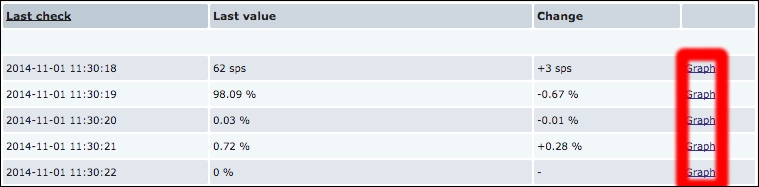
Since Zabbix 2.4, there is support for ad hoc graphs on several items. When you go to monitor latest data you will have the option Graph behind most of the items. By clicking on this link, you will see a graph built by Zabbix for this item.
- A full list of macros that can be used can be found here:
https://www.zabbix.com/documentation/2.4/manual/appendix/macros/supported_by_location
-
No Comment